
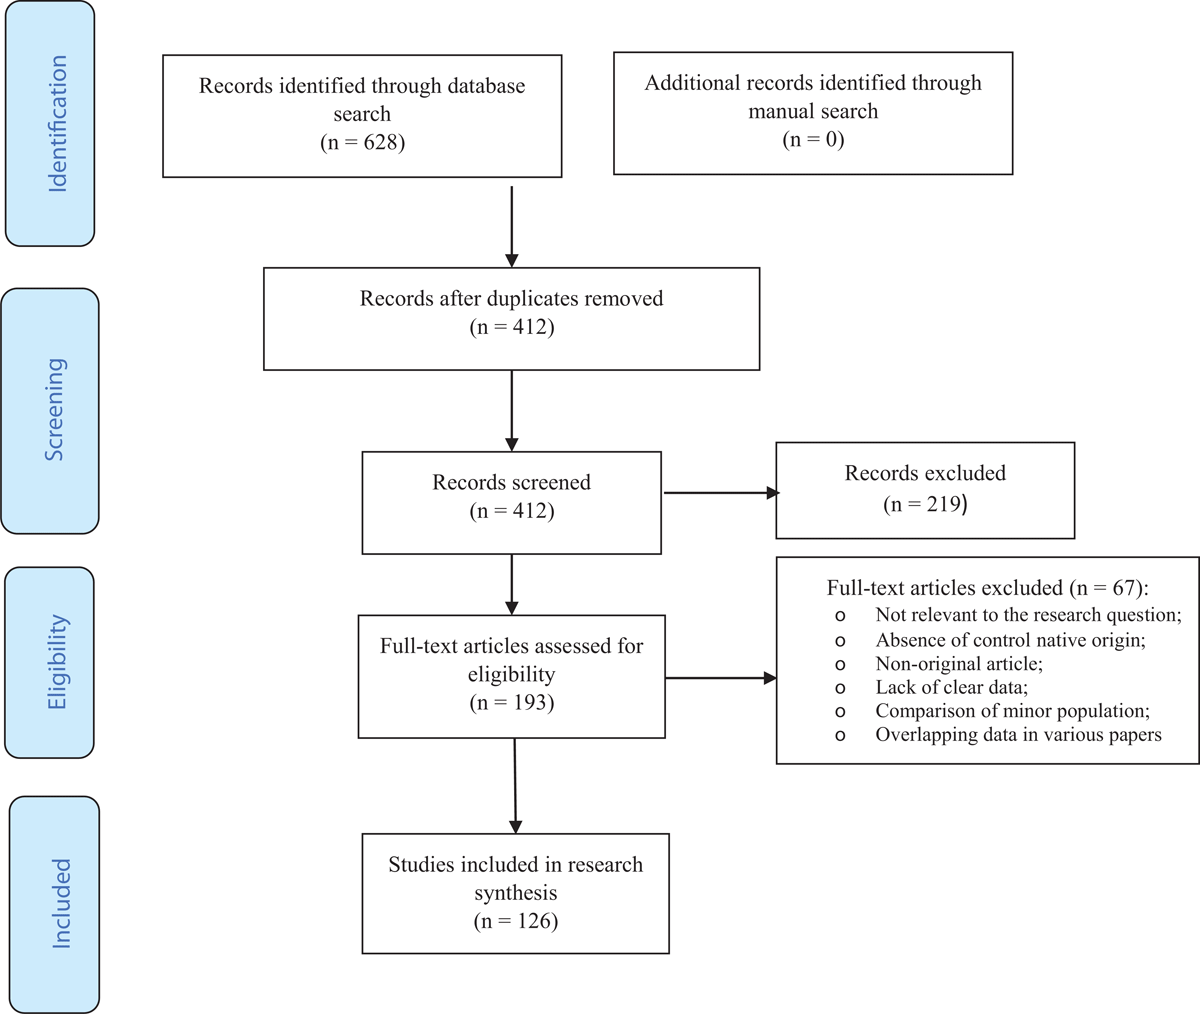
Figure 1
The PRISMA flowchart for the search process.
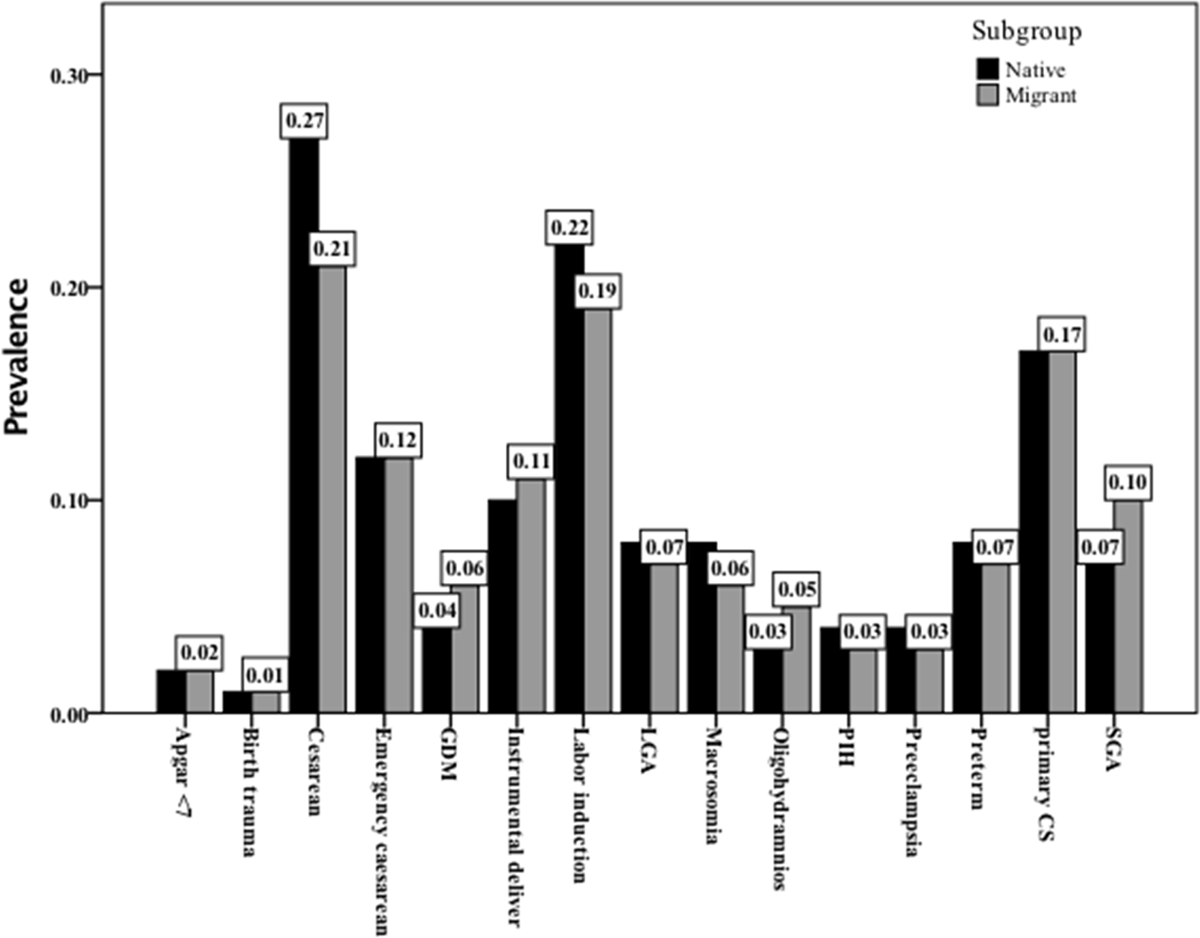
Figure 2
Pooled prevalence of adverse maternal and neonatal outcomes in the studied population including immigrant women and those with the native origin background.
GDM: gestational diabetes mellitus, LGA: large for gestational diabetes, PIH: pregnancy induced hypertension, SGA: small for gestational age.
Table 1
Heterogeneity, estimation of publication bias, and meta-analysis of the studies on the risk of adverse maternal and neonatal outcomes among immigrant women and native origin women.
| OUTCOME | SAMPLE SIZE OF IMMIGRANT | SAMPLE SIZE OF NATIVE ORIGIN | POOLED PREVALENCE (95% CI)* | PUBLICATION BIAS HARBORD TEST* | HETEROGENEITY I-SQUARED % | POOLED OR (95% CI) | |||
|---|---|---|---|---|---|---|---|---|---|
| EVENT | TOTAL | EVENT | TOTAL | MIGRANT | NATIVE ORIGIN | ||||
| Adverse maternal outcome | |||||||||
| Cesarean section | 148931 | 660205 | 3677824 | 20596518 | 0.21 (0.20, 0.23) | 0.27 (0.25, 0.29) | 0.739 | 98.1 | 0.992 (0.941, 1.045) |
| Emergency cesarean section | 50600 | 395162 | 993568 | 9277701 | 0.12 (0.11, 0.13) | 0.11 (0.10, 0.13) | 0.466 | 97.2 | 1.129 (1.048, 1.215) |
| Primary cesarean section | 6279 | 44318 | 539154 | 2788776 | 0.17 (0.15, 0.19) | 0.17 (0.14, 0.20) | 0.755 | 94.1 | 0.915 (0.788, 1.062) |
| Labor induction | 525115 | 291182 | 1335153 | 5634534 | 0.19 (0.18, 0.21) | 0.22 (0.19, 0.25) | 0.484 | 93.7 | 0.837 (0.793, 0.883) |
| Instrumental delivery | 51680 | 456979 | 1124217 | 11320234 | 0.11 (0.10, 0.12) | 0.10 (0.09, 0.12) | 0.575 | 96.7 | 1.027 (0.961, 1.097) |
| Pregnancy induced hypertension | 46096 | 2393549 | 1020186 | 26900498 | 0.03 (0.02, 0.03) | 0.04 (0.03, 0.05) | 0.496 | 98.2 | 0.663 (0.596, 0.738) |
| Preeclampsia | 21055 | 2369038 | 722645 | 27941572 | 0.03 (0.02, 0.03) | 0.04 (0.03, 0.05) | 0.156 | 93.3 | 0.746 (0.692, 0.804) |
| GDM | 87936 | 2571075 | 982427 | 40242084 | 0.06 (0.05, 0.06) | 0.04 (0.04, 0.05) | 0.000* | 99.5 | $1.441 (1.268, 1.636) |
| Adverse neonatal outcome | |||||||||
| Macrosomia | 62872 | 803186 | 1145835 | 13748134 | 0.06 (0.05, 0.07) | 0.08 (0.06, 0.10) | 0.263 | 99.2 | 0.822 (0.721, 0.937) |
| LGA | 51608 | 663665 | 1252440 | 15590983 | 0.07 (0.06, 0.08) | 0.08 (0.06, 0.09) | 0.665 | 98.9 | 0.809 (0.730, 0.898) |
| SGA | 162335 | 2987996 | 2435087 | 36623165 | 0.10 (0.09, 0.10) | 0.07 (0.06, 0.08) | 0.072 | 99.3 | 1.347 (1.243, 1.460) |
| 5-min Apgar score less than 7 | 19500 | 1231886 | 449914 | 32466089 | 0.19 (0.18, 0.21) | 0.02 (0.01, 0.02) | 0.096 | 97.5 | 1.222 (1.096, 1.362) |
| Shoulder dystocia | 4654 | 29309 | 59306 | 472459 | 0.21 (0.09, 0.40) | 0.29 (0.03, 0.52) | 0.250 | 90.3 | 1.160 (1.00, 1.350) |
| Preterm birth | 629485 | 8136358 | 2704204 | 39495424 | 0.07 (0.06, 0.07) | 0.08 (0.07, 0.09) | 0.208 | 93.7 | 0.939 (0.913, 1.966) |
| Birth trauma | 3353 | 456327 | 65637 | 5696997 | 0.01 (0.01, 0.02) | 0.01 (0.00, 0.02) | 0.893 | 66.3 | 0.968 (0.899, 1.043) |
| Oligohydramnios | 825 | 22043 | 4903 | 243412 | 0.05 (0.04, 0.06) | 0.03 (0.02, 0.04) | 0.405 | 97.7 | 1.862 (1.032, 3.360) |
[i] GDM: Gestational diabetes; LGA: Large for gestational age; SGA: Small for gestational age; NICU: Neonatal intensive care Unit; RDS: Respiratory distress syndrome.
Bold values indicate statistical significance.
* Obtained from the trim and fill method of publication bias adjustment.
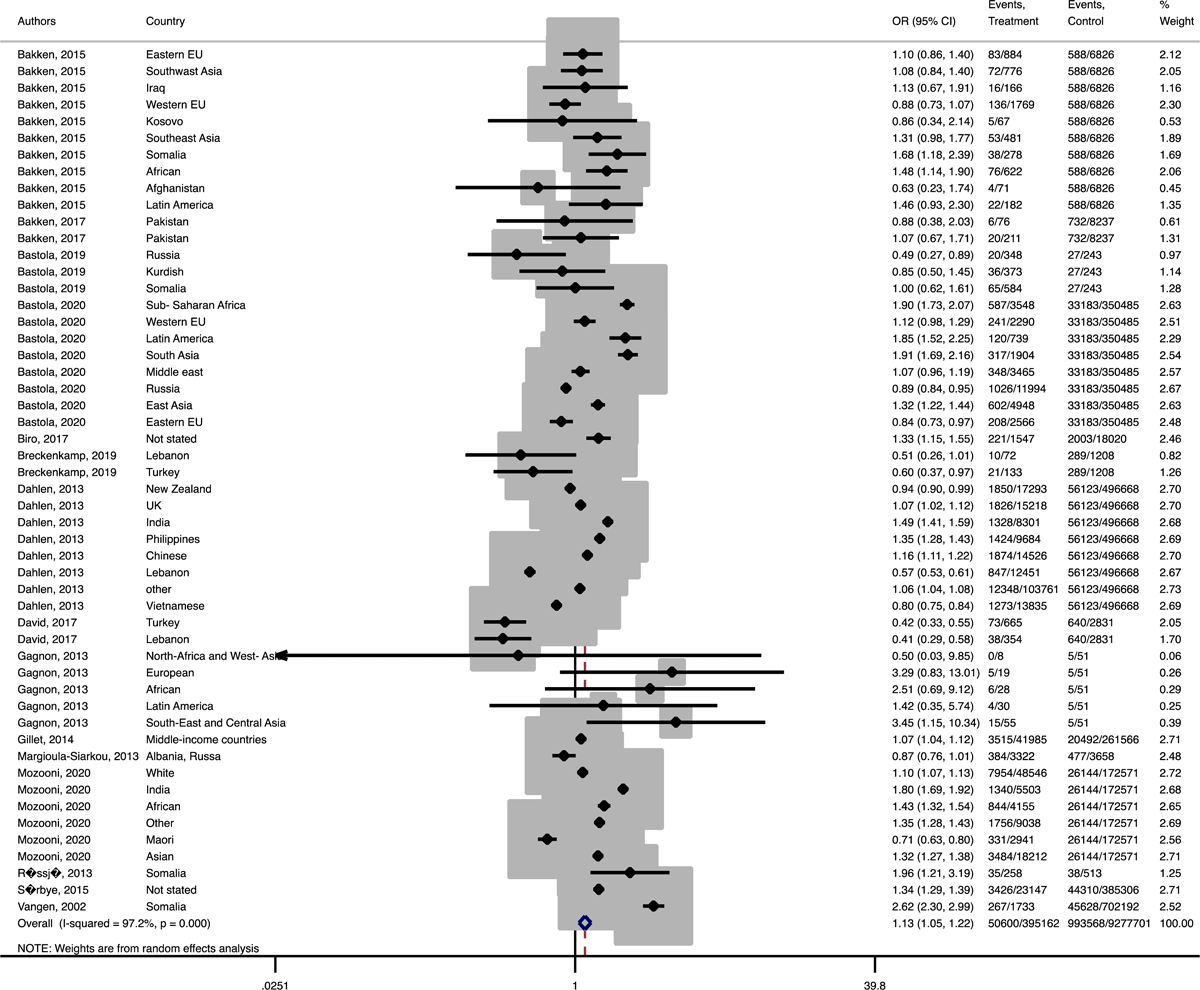
Figure 3
Forest plots of the pooled odds ratio of adverse maternal outcomes comparing immigrant and native origin women. (A) Forest plot of the pooled odds ratio of emergency cesarean section comparing immigrant and native origin women.

Figure 3-B
Forest plot of the pooled odds ratio of shoulder dystocia comparing immigrant and native origin women.
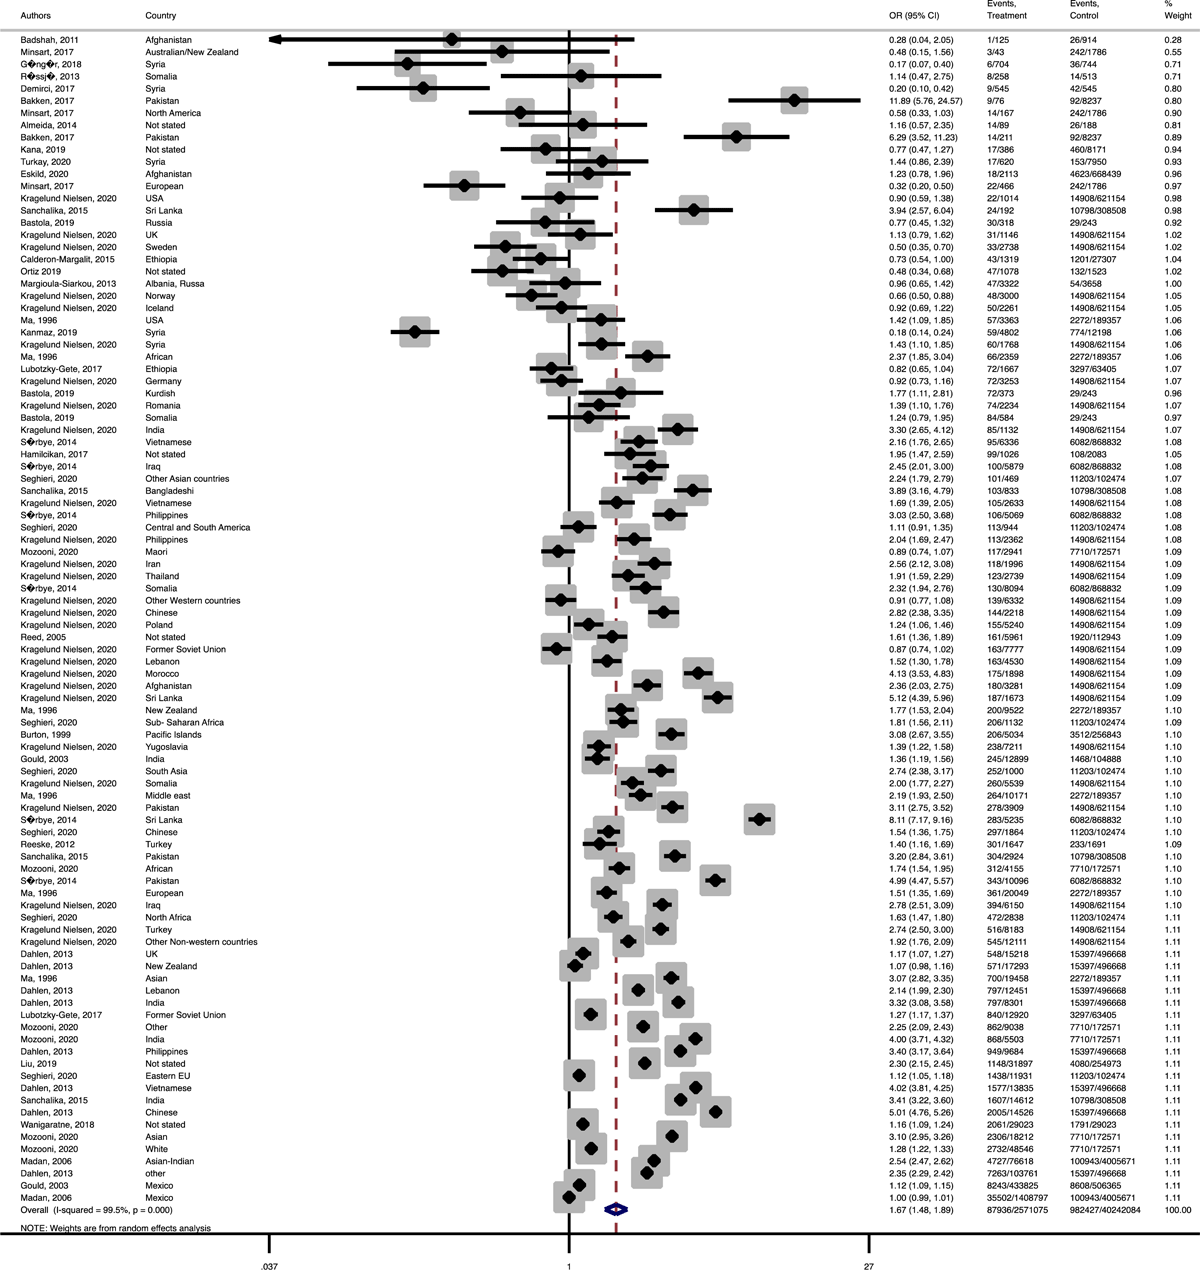
Figure 3-C
Forest plot of the pooled odds ratio of gestational diabetes mellitus comparing immigrant and native origin women.

Figure 3-D
Forest plot of the pooled odds ratio of induction of labor comparing immigrant and native origin women.

Figure 3-E
Forest plot of the pooled odds ratio of pregnancy induced hypertension comparing migrant and native origin population.
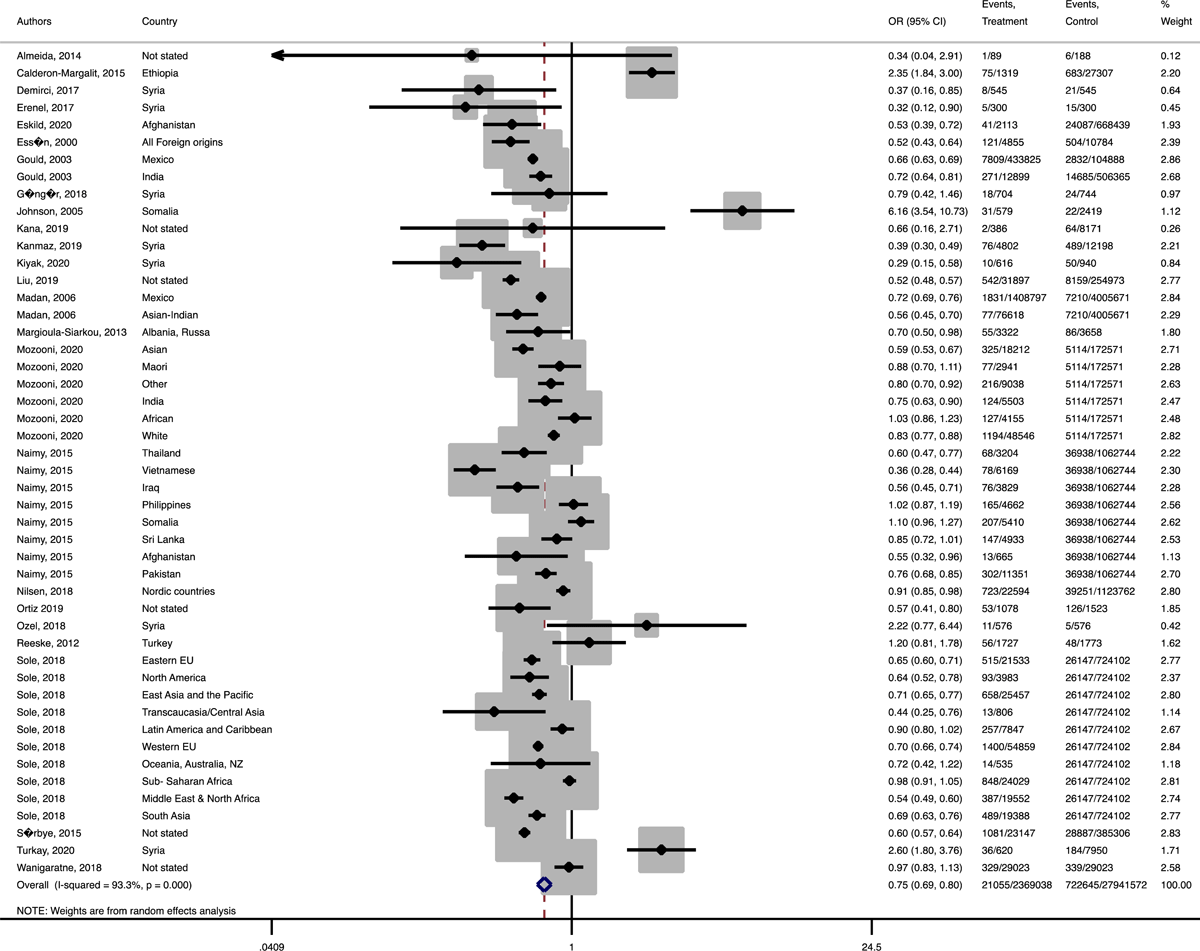
Figure 3-F
Forest plot of the pooled odds ratio of preeclampsia comparing immigrant and native origin women.
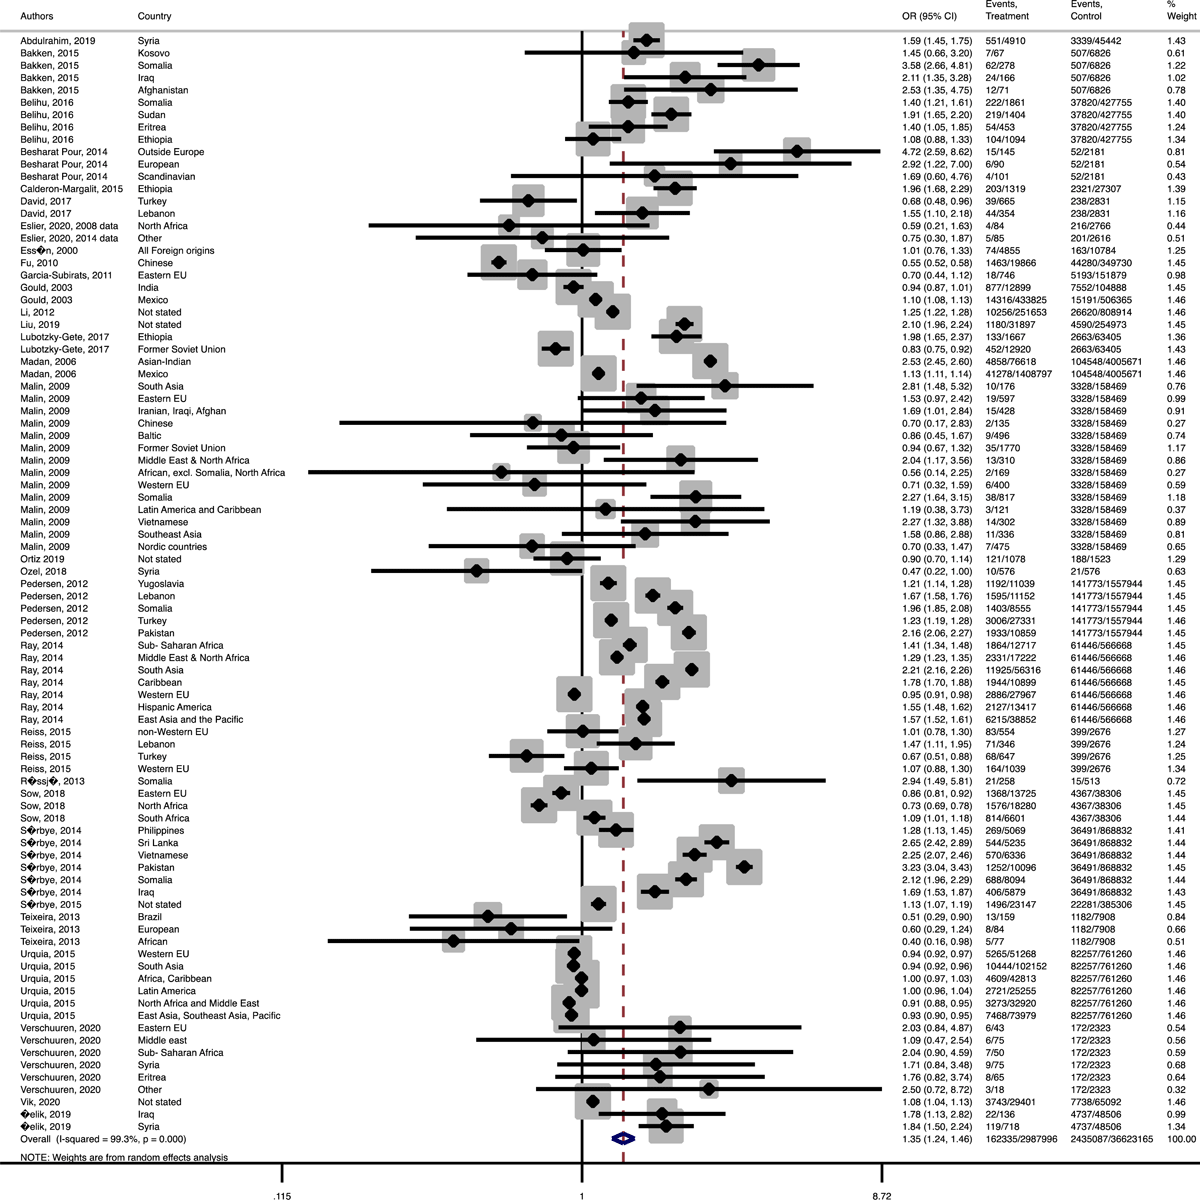
Figure 4
Forest plots of the pooled odds ratio of adverse neonatal outcomes in immigrant and native origin women. (A) Forest plot of the pooled odds ratio of small for gestational age in immigrant and native origin women.
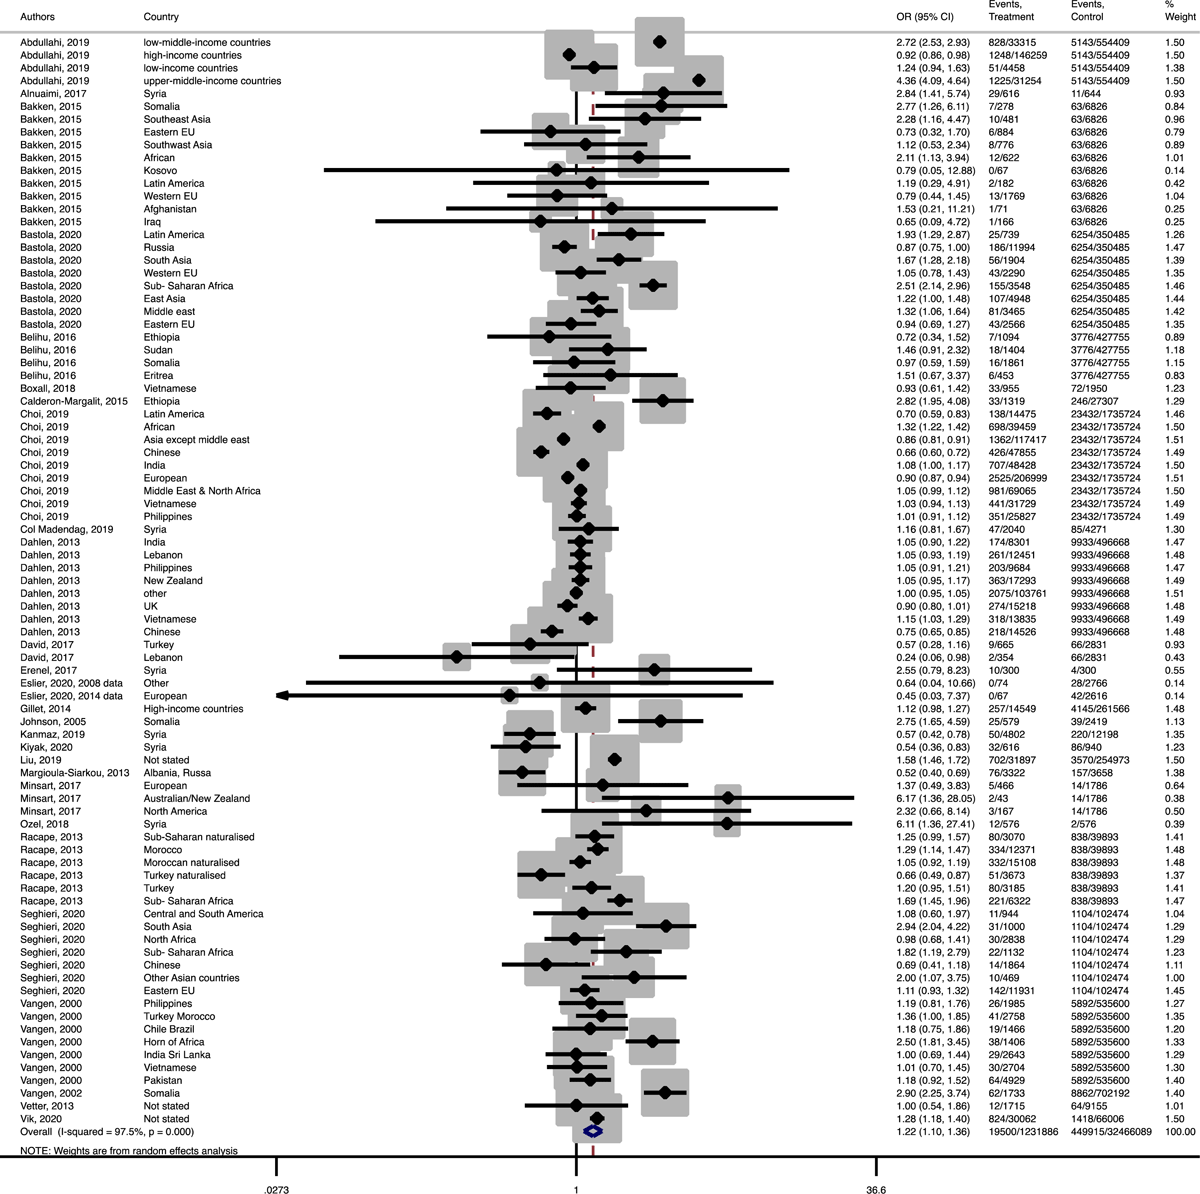
Figure 4-B
Forest plot of the pooled odds ratio of 5 min Apgar less than 7 in immigrant and native origin women.
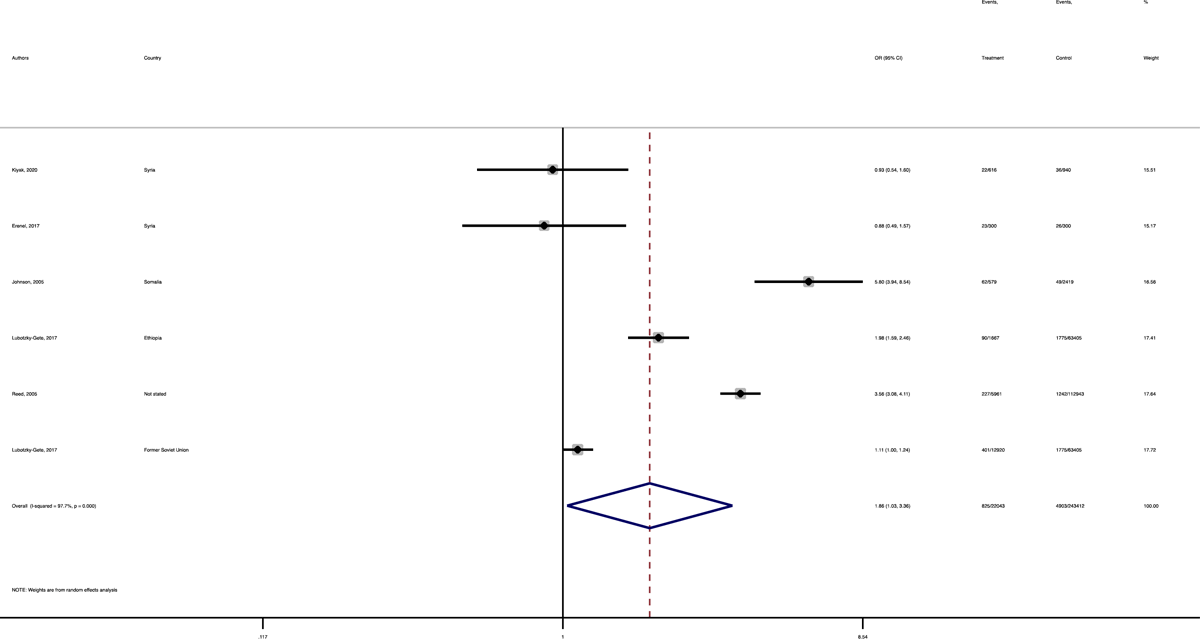
Figure 4-C
Forest plot of the pooled odds ratio of oligohydramnios in immigrant and native origin women.
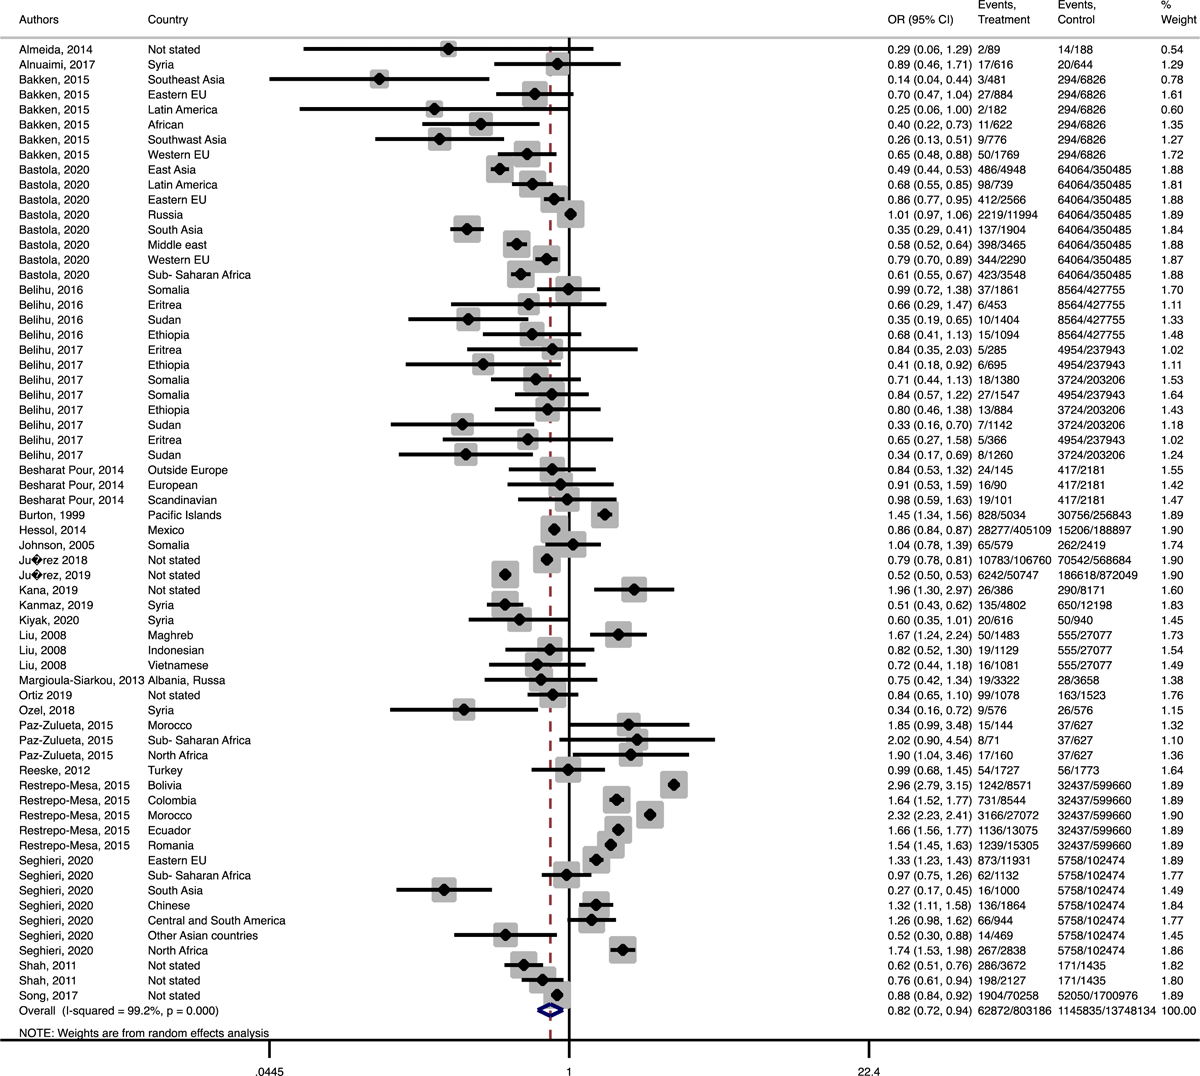
Figure 4-D
Forest plot of the pooled odds ratio of macrosomia in immigrant and native origin women.
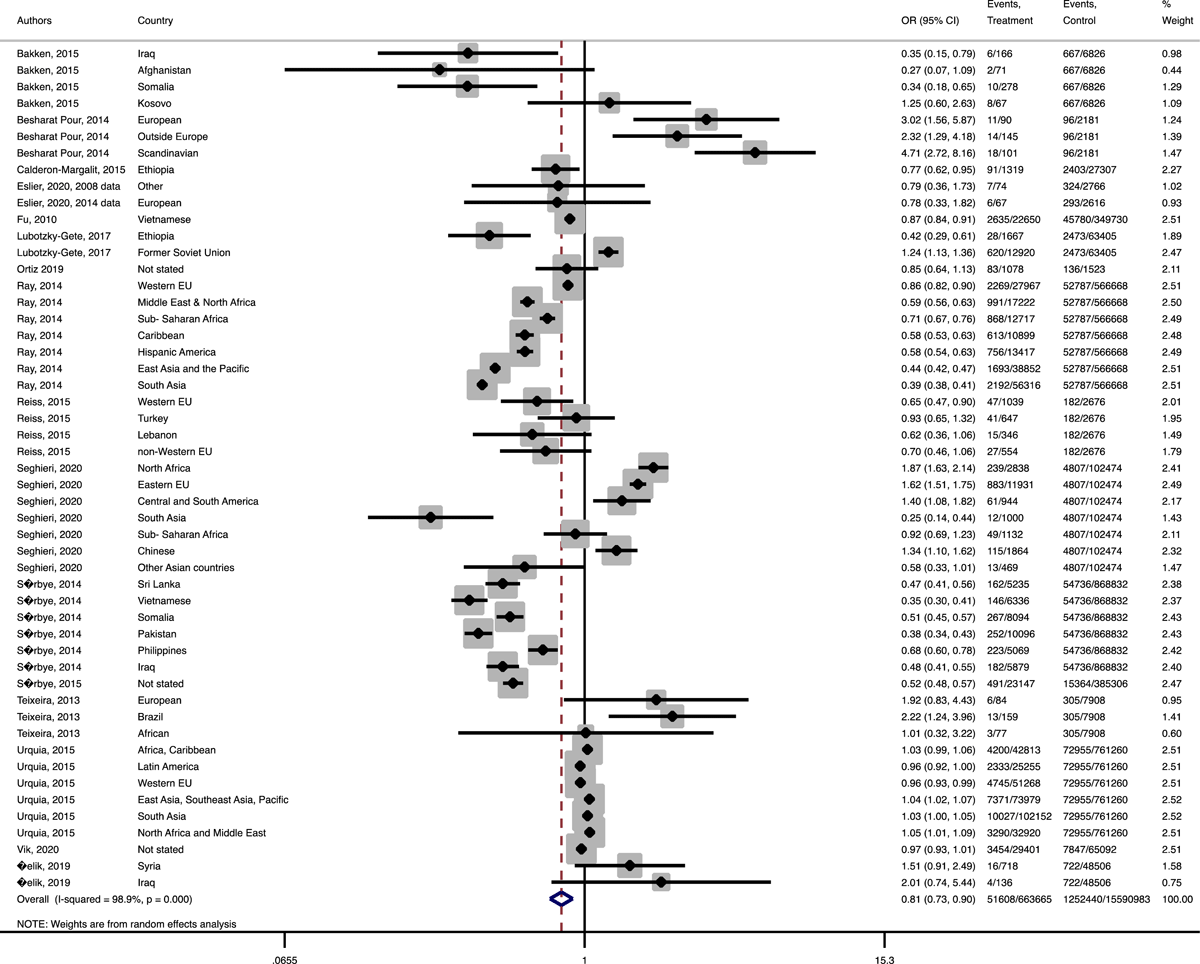
Figure 4-E
Forest plot of the pooled odds ratio of large for gestational age in immigrant and native origin women.