
Table 1
Characteristics of the study population across 17 Sub-Saharan African countries (n = 77183).
| COUNTRY | BENIN | CAR | CAMEROON | CONGO | DRC | GAMBIA | GHANA | GUINEA | GUINEA BISSAU | IVORY COAST | MADAGASCAR | MALAWI | MALI | MAURITANIA | NIGERIA | STP | TOGO |
|---|---|---|---|---|---|---|---|---|---|---|---|---|---|---|---|---|---|
| Survey year | 2014 | 2018–2019 | 2014 | 2014–2015 | 2017–2018 | 2018 | 2017–2018 | 2016 | 2018–2019 | 2016 | 2018 | 2013–2014 | 2015 | 2015 | 2016–2017 | 2019 | 2017 |
| Sample size | 5388 | 3565 | 2977 | 2956 | 7648 | 3472 | 3529 | 3879 | 2860 | 3390 | 4940 | 7490 | 6756 | 4150 | 11547 | 664 | 1971 |
| Age; mean (SD) | 28 (6.7) | 27 (7.0) | 27 (6.7) | 28 (6.1) | 29 (6.6) | 29 (6.2) | 29 (7.1) | 28 (7.0) | 28 (6.8) | 27 (6.3) | 27 (7.1) | 27 (6.7) | 28 (7.0) | 29 (7.1) | 29 (7.1) | 28 (6.8) | 29 (6.7) |
| Marital status; (%) | |||||||||||||||||
| Single | 5.5 | 13.8 | 17.9 | 19.5 | 15.1 | 6.2 | 17 | 5 | 15.6 | 17.5 | 19.3 | 15.4 | 3.7 | 8.1 | 3.9 | 25 | 7.9 |
| Married/cohabitation | 94.5 | 86.2 | 82.1 | 80.5 | 84.9 | 93.8 | 83 | 95 | 84.4 | 82.5 | 80.7 | 84.6 | 96.3 | 91.9 | 96.1 | 75 | 92.1 |
| Missing | 3 | 2 | 10 | 2 | |||||||||||||
| Education; (%) | |||||||||||||||||
| <Secondary education | 86 | 95 | 64.5 | 33.4 | 52 | 66.2 | 43.4 | 84.6 | 91.4 | 83.2 | 69.9 | 82.6 | 94.5 | 82.4 | 64.8 | 43.9 | 69.9 |
| ≥Secondary education | 14 | 5 | 35.5 | 66.6 | 48 | 33.8 | 56.6 | 15.4 | 8.6 | 16.8 | 30.1 | 17.4 | 5.5 | 17.6 | 35.2 | 56.1 | 30.1 |
| Missing | 5 | 1 | 15 | 1 | |||||||||||||
| Household’s wealth; (%) | |||||||||||||||||
| Poorest quintile | 20.3 | 22.2 | 23.6 | 24.3 | 24.3 | 22.8 | 21.6 | 20.7 | 21.2 | 25.2 | 25.2 | 24.7 | 19.7 | 21.1 | 22.4 | 24.6 | 20.9 |
| Poor quintile | 20.9 | 22.4 | 22.1 | 22.4 | 21.6 | 21.8 | 20 | 22.8 | 23.6 | 21.8 | 22.6 | 22.4 | 20.7 | 21 | 22.1 | 20.5 | 21.4 |
| Middle quintile | 20.3 | 21.1 | 21.1 | 20.3 | 19.7 | 20.4 | 19.5 | 20.5 | 22.4 | 20.4 | 19.7 | 20.8 | 20.9 | 19.9 | 19.7 | 18.1 | 19.6 |
| Rich quintile | 21 | 18.6 | 18 | 17.8 | 19.5 | 18.8 | 20.4 | 20 | 18.5 | 18 | 17.2 | 16.6 | 21.2 | 20.1 | 18.3 | 21.3 | 20.6 |
| Richest quintile | 17.4 | 15.7 | 15.2 | 15.2 | 14.9 | 16.2 | 18.5 | 16 | 14.4 | 14.5 | 15.4 | 15.5 | 17.5 | 18 | 17.6 | 15.5 | 17.5 |
| Area of residence; (%) | |||||||||||||||||
| Rural | 56.7 | 69.5 | 59.3 | 38.4 | 61.5 | 37.8 | 57.7 | 66.5 | 73.2 | 60 | 80 | 88.1 | 80.9 | 55 | 70.3 | 34.3 | 60.4 |
| Urban | 43.3 | 30.5 | 40.7 | 61.6 | 38.5 | 62.2 | 42.3 | 33.5 | 26.8 | 40 | 20 | 11.9 | 19.1 | 45 | 29.7 | 65.7 | 39.6 |
| Planned pregnancy status; (%) | |||||||||||||||||
| Planned | 62.7 | 48.7 | 77.1 | 56.7 | 59.8 | 74.7 | 49.4 | 74.9 | 84.1 | 62.4 | 86.3 | 54.8 | 76.1 | 74.3 | 79.1 | 33 | 56.7 |
| Unplanned | 37.3 | 51.3 | 22.9 | 43.3 | 40.2 | 25.3 | 50.6 | 25.1 | 15.9 | 37.6 | 13.7 | 45.2 | 23.9 | 25.7 | 20.9 | 67 | 43.3 |
| Missing | 1 | 27 | 48 | 5 | 10 | 9 | 8 | 1 | 10 | 75 | 44 | 26 | 12 | 4 | |||
| Parity; (%) | |||||||||||||||||
| Primiparous | 18.8 | 17.6 | 21.8 | 22.9 | 17.4 | 20.4 | 22.8 | 19.6 | 22.7 | 24.5 | 28.4 | 22.6 | 17.6 | 18.4 | 16.3 | 24.4 | 20.9 |
| Multiparous | 81.2 | 82.4 | 78.2 | 77.1 | 82.6 | 79.6 | 77.2 | 80.4 | 77.3 | 75.5 | 71.6 | 77.4 | 82.4 | 81.6 | 83.7 | 75.6 | 79.1 |
| Early ANC; (%) | |||||||||||||||||
| No | 48.5 | 65.2 | 65.5 | 50.4 | 83.1 | 54.6 | 38.2 | 55.5 | 56.9 | 65.9 | 72.7 | 79.2 | 67.2 | 35.6 | 81.2 | 10.1 | 66.4 |
| Yes | 51.5 | 34.8 | 34.5 | 49.6 | 16.9 | 45.4 | 61.8 | 44.5 | 43.1 | 34.1 | 27.3 | 20.8 | 32.8 | 64.4 | 18.8 | 89.9 | 33.6 |
| Missing | 31 | 6 | 5 | 1 | 10 | 12 | 7 | 1 | |||||||||
| Access to media; (%) | |||||||||||||||||
| No | 2.1 | 72.2 | 4 | 5.2 | 64 | 7.8 | 15.1 | 1.4 | 3 | 2 | 47.3 | 6.7 | 0.4 | 5.2 | 3 | 4 | 30.4 |
| Yes | 97.9 | 27.8 | 96 | 94.8 | 36 | 92.2 | 84.9 | 98.6 | 97 | 98 | 52.7 | 93.3 | 99.6 | 94.8 | 97 | 96 | 69.6 |
| Missing | 6 | 64 | 3 | 1 | 1 | ||||||||||||
| Perceived domestic violence; (%) | |||||||||||||||||
| No | 59.6 | 31.8 | 59.8 | 42.7 | 34.9 | 41 | 65.9 | 23.1 | 60.4 | 51.9 | 60.2 | 86.1 | 21.8 | 69.4 | 61.6 | 83.5 | 69.4 |
| Yes | 40.4 | 68.2 | 40.2 | 57.3 | 65.1 | 59 | 34.1 | 76.9 | 39.6 | 48.1 | 39.8 | 13.9 | 78.2 | 30.6 | 38.4 | 16.5 | 30.6 |
| Missing | 80 | 38 | 24 | 20 | 20 | 9 | 20 |
[i] CAR: Central African Republic; DRC: Democratic Republic of the Congo; STP: São Tomé and Príncipe; SD: Standard deviation.
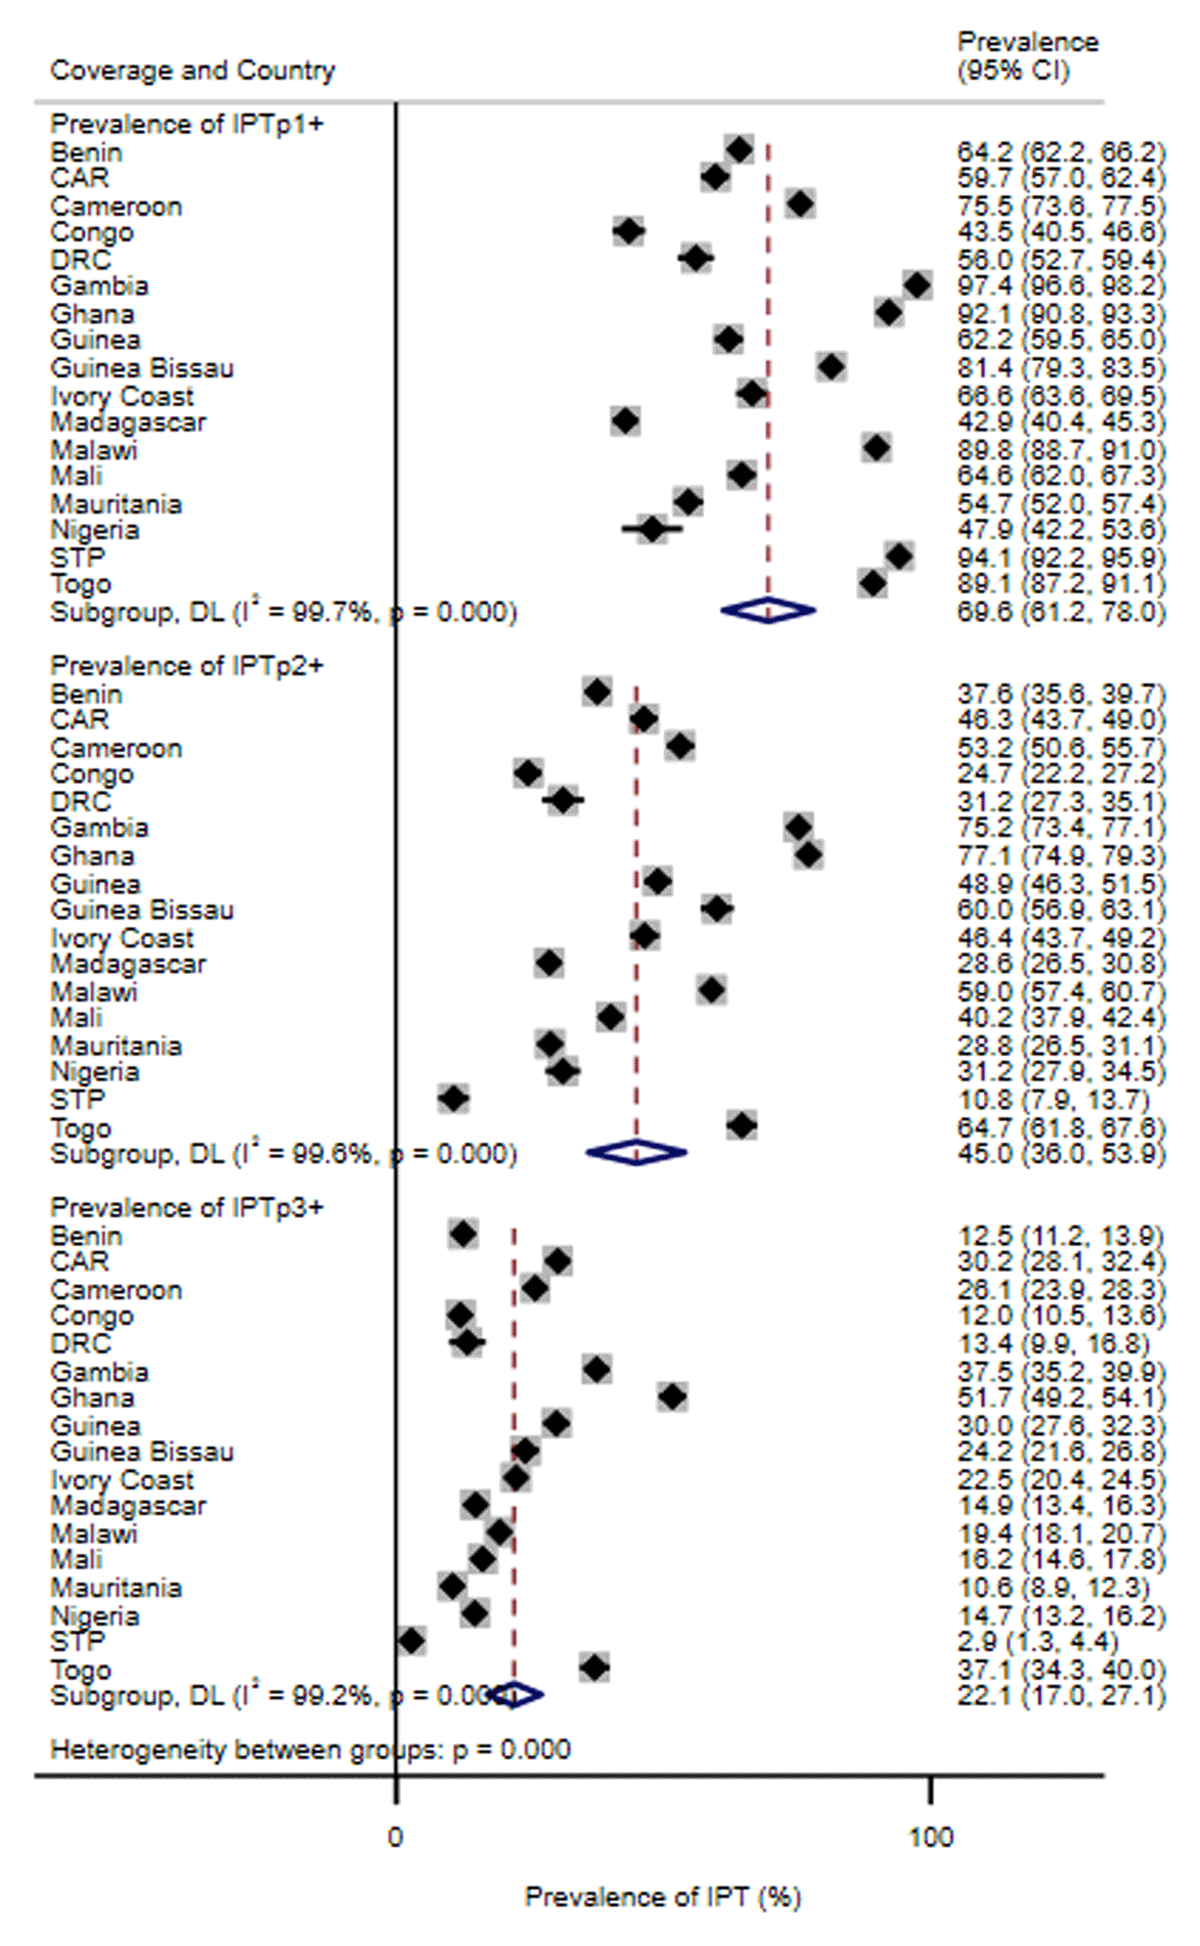
Figure 1
Coverage of intermittent preventive treatment of malaria in pregnancy (IPTp) with sulphadoxine–pyrimethamine (SP) by country stratified by the number of SP doses.
CAR: Central African Republic; DRC: Democratic Republic of the Congo; STP: São Tomé and Príncipe.
IPTp3+: three or more intermittent preventive treatment doses.
IPTp2+: two or more intermittent preventive treatment doses.
IPTp1+: one or more intermittent preventive treatment doses.
Table 2
The association between early ANC and IPTp3+.
| CHARACTERISTICS | ADJUSTED PR (95% CI) |
|---|---|
| Early ANC | |
| No | 1.00 (Reference) |
| Yes | 1.30 (1.23,1.36) |
| Planned pregnancy status | |
| Planned | 1.00 (Reference) |
| Unplanned | 0.92 (0.88,0.96) |
| Age | 1.00 (1.00,1.00) |
| Marital status | |
| Single | 1.00 (Reference) |
| Married/cohabitation | 0.99 (0.93,1.06) |
| Education | |
| <Secondary education | 1.00 (Reference) |
| ≥Secondary education | 0.99 (0.94,1.04) |
| Household’s wealth | |
| Poorest quintile | 1.00 (Reference) |
| Poor quintile | 1.08 (1.02,1.15) |
| Middle quintile | 1.13 (1.04,1.22) |
| Rich quintile | 1.13 (1.04,1.23) |
| Richest quintile | 1.11 (1.01,1.23) |
| Area of residence | |
| Rural | 1.00 (Reference) |
| Urban | 1.04 (0.97,1.11) |
| Parity | |
| Primiparous | 1.00 (Reference) |
| Multiparous | 0.96 (0.91,1.01) |
| Access to media | |
| No | 1.00 (Reference) |
| Yes | 1.25 (1.12,1.39) |
| Perceived domestic violence | |
| No | 1.00 (Reference) |
| Yes | 0.90 (0.84,0.96) |
[i] PR: Prevalence ratio; ANC: antenatal care; IPTp3+: three or more intermittent preventive treatment doses.
Table 3
Effect modification of the association between early antenatal care and IPTp3+ by planned pregnancy status.
| NO EARLY ANC | EARLY ANC | ||||
|---|---|---|---|---|---|
| N with/without outcome | PR (95% CI) | N with/without outcome | PR (95% CI) | PR (95% CI) comparing IPTp3+ coverage with early ANC vs. not within strata of planned pregnancy status | |
| Planned pregnancy | 5093/23746 | 1.00 (Reference) | 4755/14098 | 1.26 (1.18,1.34) p < 0.01 | 1.26 (1.18,1.34)p < 0.01 |
| Unplanned pregnancy | 2467/12231 | 0.88 (0.83,0.94) p < 0.01 | 2108/6374 | 1.22 (1.14,1.30) p < 0.01 | 1.38 (1.29,1.48)p < 0.01 |
[i] Measure of effect modification on additive scale: RERI (95% CI) = 0.08 (0.0002, 0.15); p = 0.04.
Measure of effect modification on multiplicative scale: ratio of PRs (95% CI) = 1.10 (1.01, 1.20); p = 0.04.
Prevalence ratios (PRs) are adjusted for age, marital status, education, household wealth, place of residence, parity, access to media, perceived domestic violence.
IPTp3+: three or more intermittent preventive treatment doses.