
Table 1
The Descriptive Characteristics of the Study Participants.
| VARIABLES | WASTED | NOT WASTED | WASTED | NOT WASTED | |
|---|---|---|---|---|---|
| WEIGHTED FREQUENCY (%) | WEIGHTED FREQUENCY (%) | VARIABLES | WEIGHTED FREQUENCY (%) | WEIGHTED FREQUENCY (%) | |
| Sex of child | Wealth index | ||||
| Male | 223.8 (62.7) | 2293.6 (49.9) | Poorest | 135.5 (37.9) | 1034 (22.5) |
| Female | 132.9 (37.3) | 2305.0 (50.1) | Poorer | 80.0 (22.4) | 1002.4 (21.8) |
| Age of child | Middle | 47.1 (13.2) | 875.7 (19.0) | ||
| 0–5m | 48.6 (13.6) | 467.9 (10.2) | Richer | 55.4 (15.5) | 809.8 (17.6) |
| 6–11m | 29.3 (8.2) | 437.3 (9.5) | Richest | 38.7 (10.9) | 876.4 (19.1) |
| 12–23m | 78.8 (22.1) | 911.3 (19.8) | Child birth order | ||
| 24–35m | 76.3 (21.4) | 897.8 (19.5) | First | 113.6 (31.8) | 1816.6 (39.5) |
| >36m | 123.6 (34.6) | 1884.4 (41) | Second | 80.2 (22.5) | 1216.2 (26.5) |
| ANC visit | Third | 162.9 (45.7) | 1565.9 (34.1) | ||
| Yes | 161.2 (65.1) | 2524.7 (75.8) | Mother educational level | ||
| No | 86.3 (34.9) | 803.8 (24.2) | No education | 247.7 (69.5) | 2426 (52.8) |
| Under-five children in house | Primary | 86.0 (24.1) | 1655 (36.0) | ||
| 1 child | 103.8 (29.2) | 1836.4 (40.1) | Secondary& above | 122.9 (6.4) | 516.5 (11.2) |
| 2 child | 180.0 (50.6) | 2124.7 (46.4) | Household size | ||
| 3 child | 72.2 (20.3) | 621.7 (13.6) | 1–4 | 70.7 (19.8) | 1333.4 (29.0) |
| Source of drinking water | 5–9 | 248.6 (69.7) | 2951.5 (64.2) | ||
| unimproved | 129.9 (36.4) | 1626.1 (35.4) | 10 and more | 37.4 (10.5) | 313.7 (6.8) |
| Improved | 226.8 (63.6) | 2969.4 (64.6) | Residence | ||
| Vaccination status | urban | 70.4 (19.7) | 1161.9 (25.3) | ||
| Yes | 63.4 (17.5) | 825.7 (17.9) | Rural | 286.3 (80.3) | 3436.7 (74.7) |
| No | 294.4 (82.5) | 3772.8 (82.0) | |||
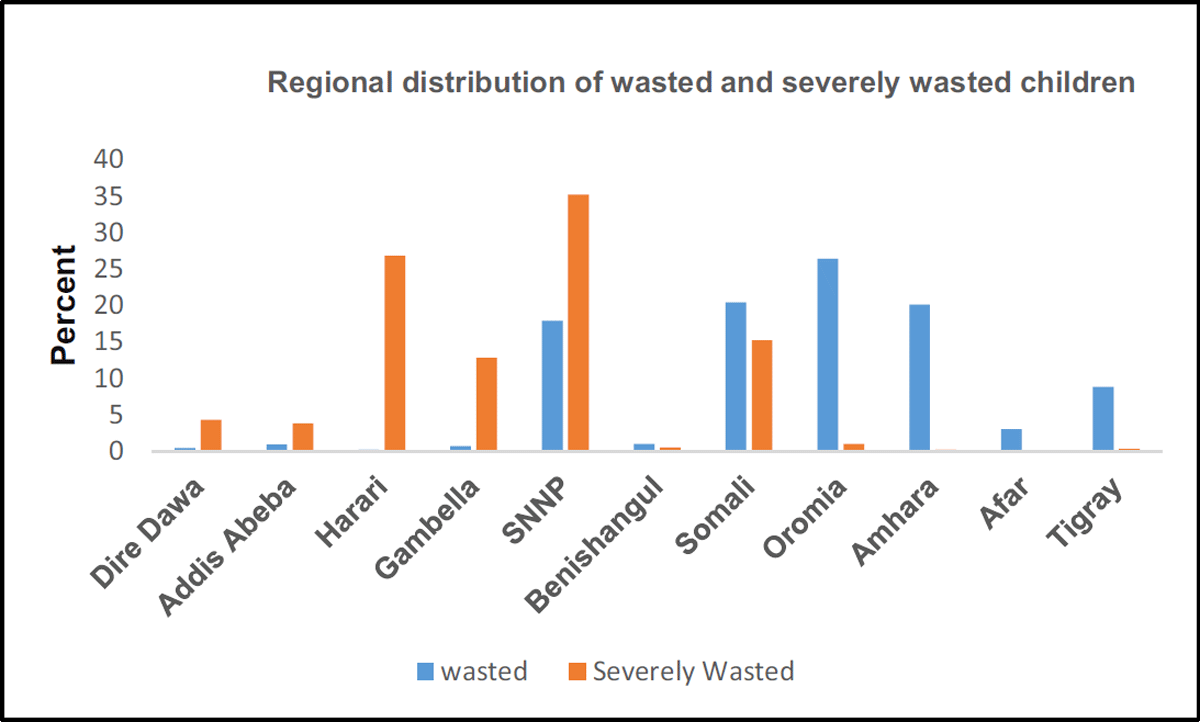
Figure 1
Acute and severe malnutrition among children aged 6–59 months in Ethiopia, 2019 EDHS.
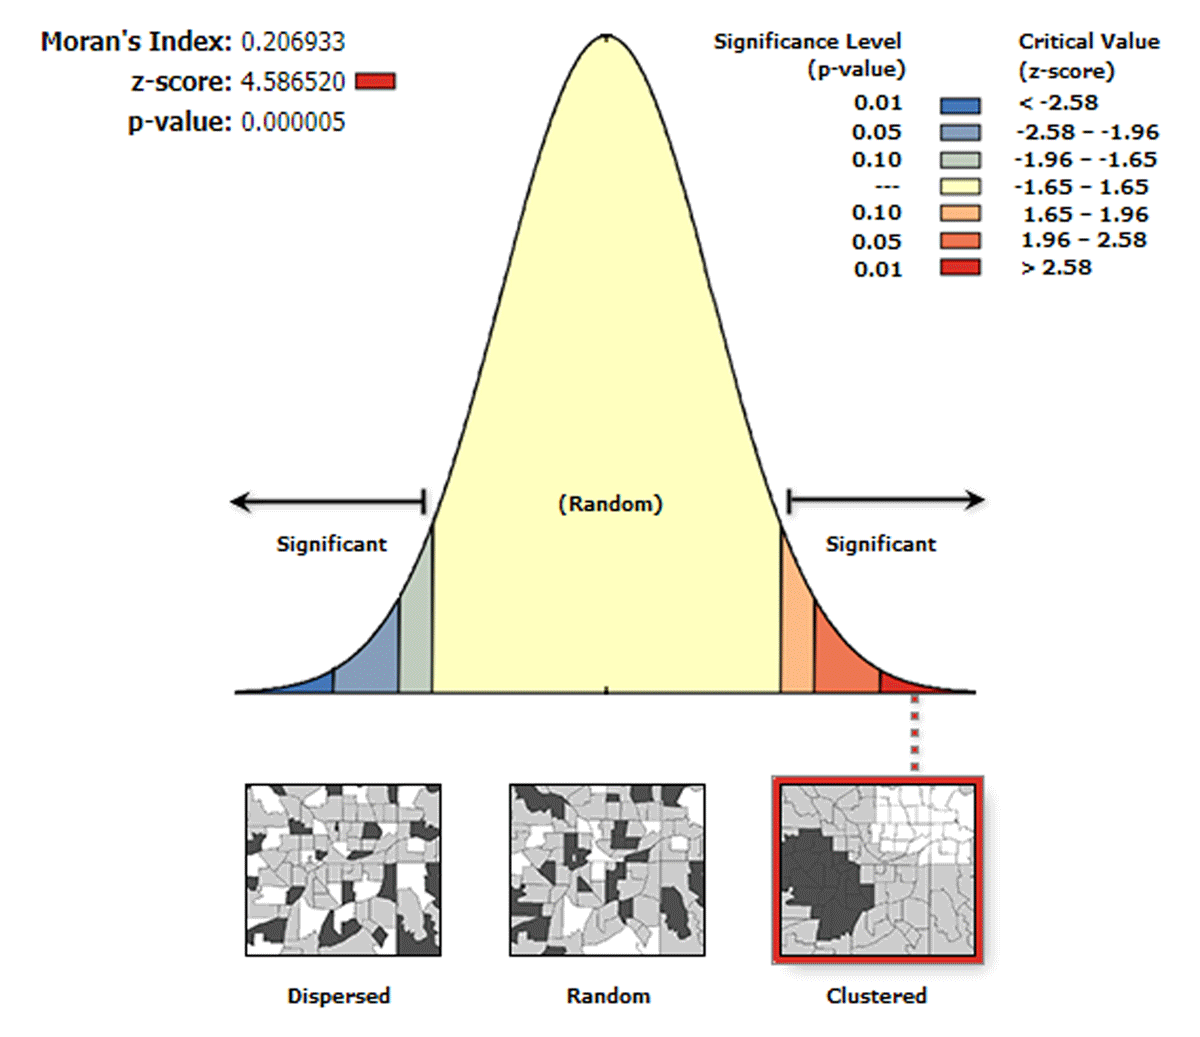
Figure 2
The global spatial autocorrelation of wasted children in Ethiopia, 2019 EDHS.
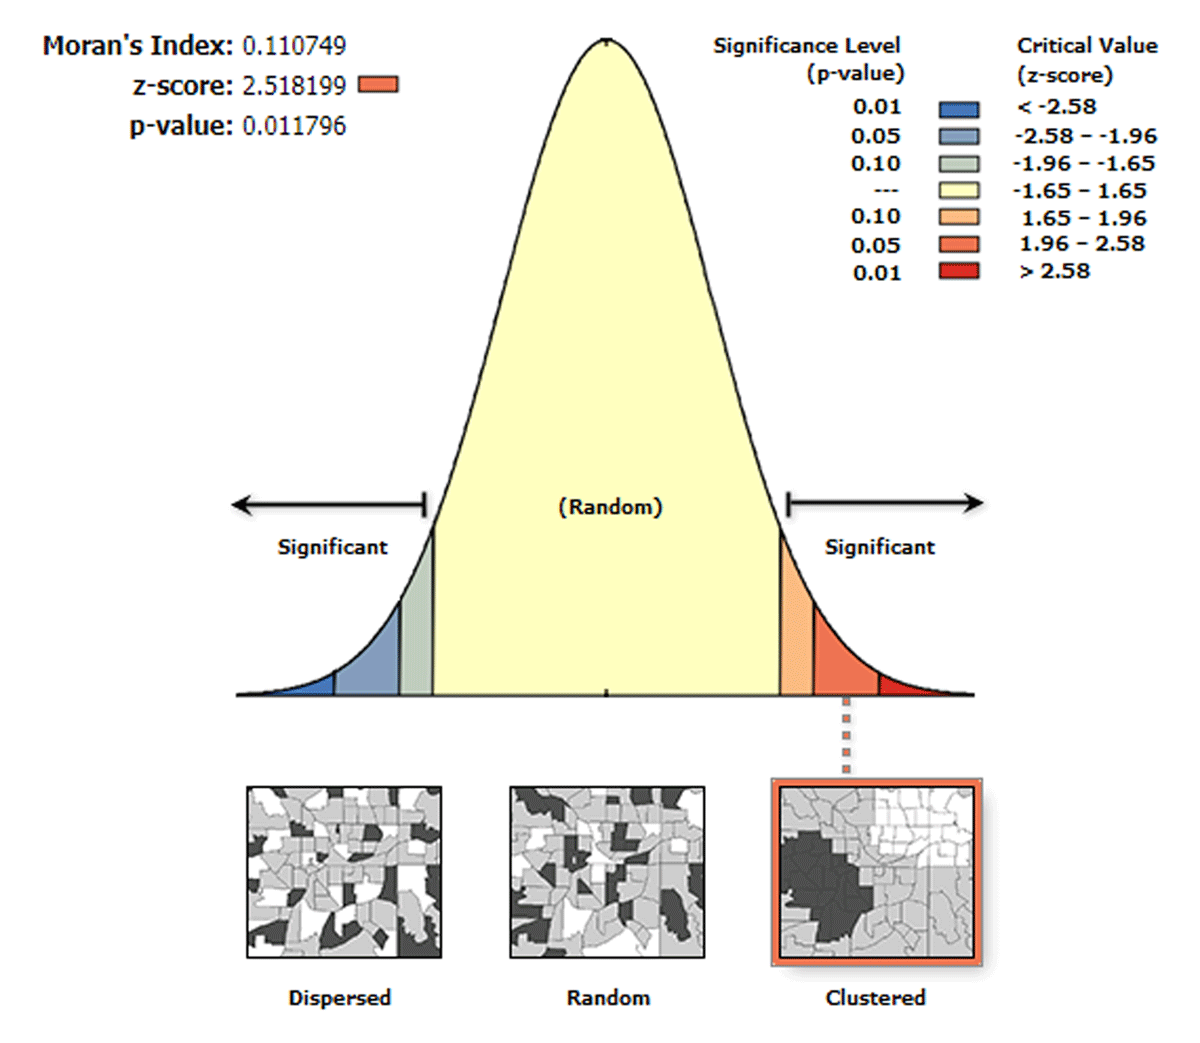
Figure 3
The global spatial autocorrelation of severely wasted children in Ethiopia, 2019 EDHS.
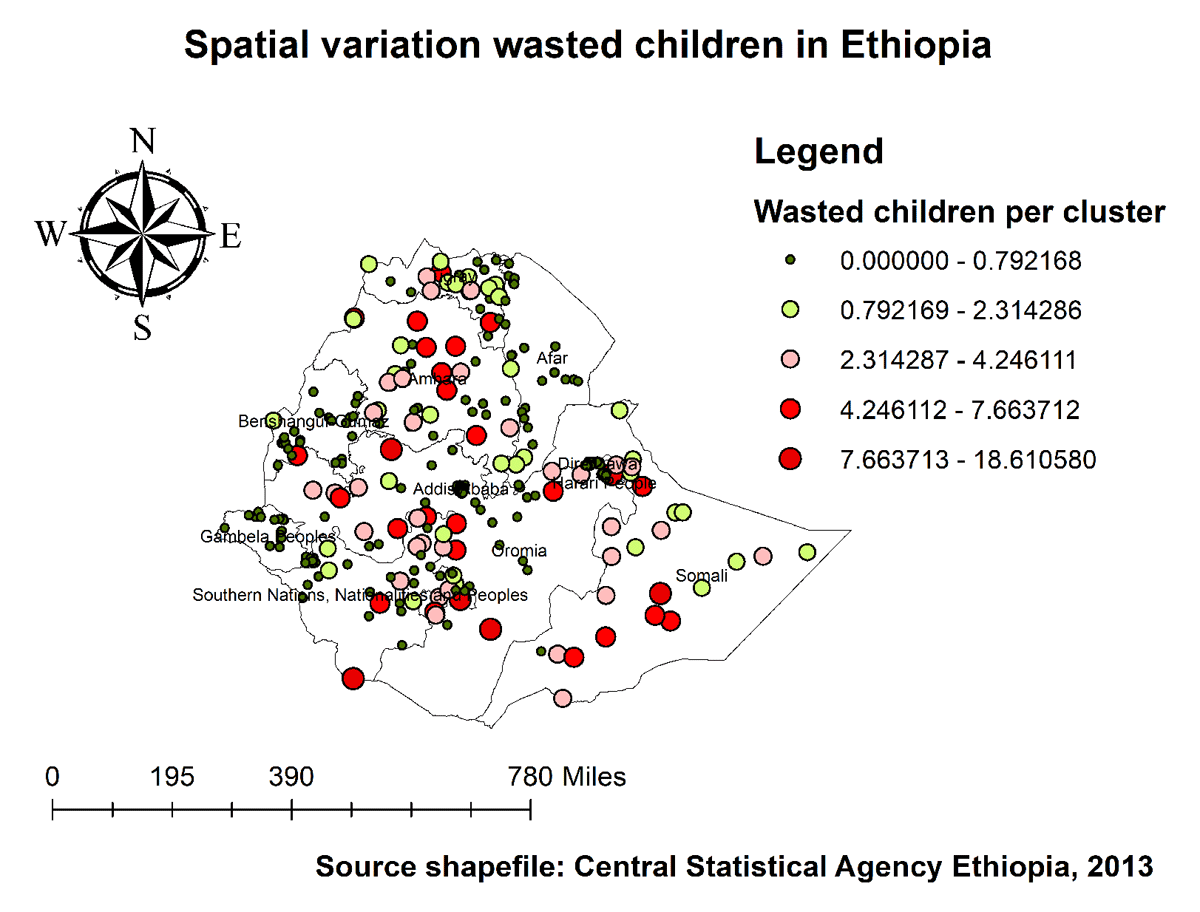
Figure 4
Spatial distribution of wasting among under-five children in Ethiopia, 2019 EDHS.
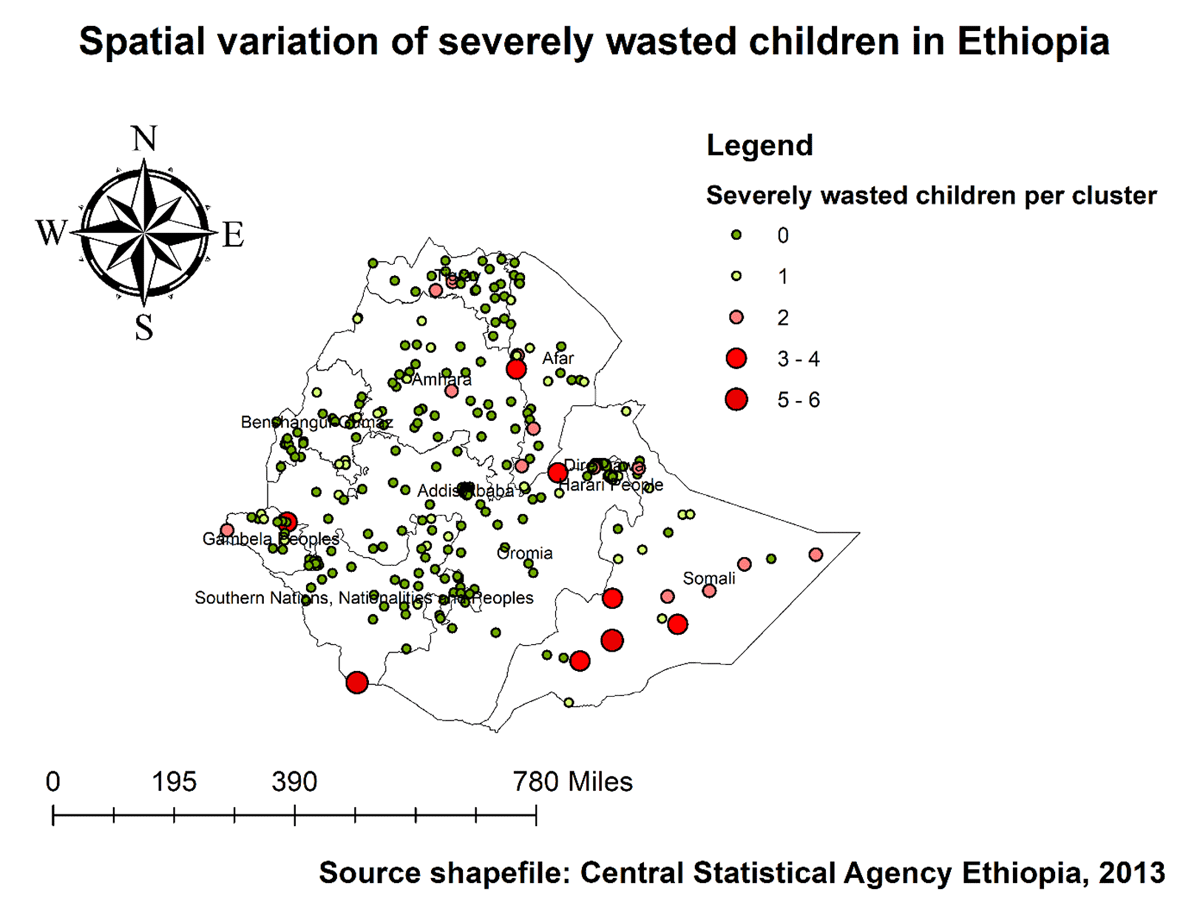
Figure 5
Spatial distribution of severely wasted under-five children in Ethiopia, 2019 EDHS.
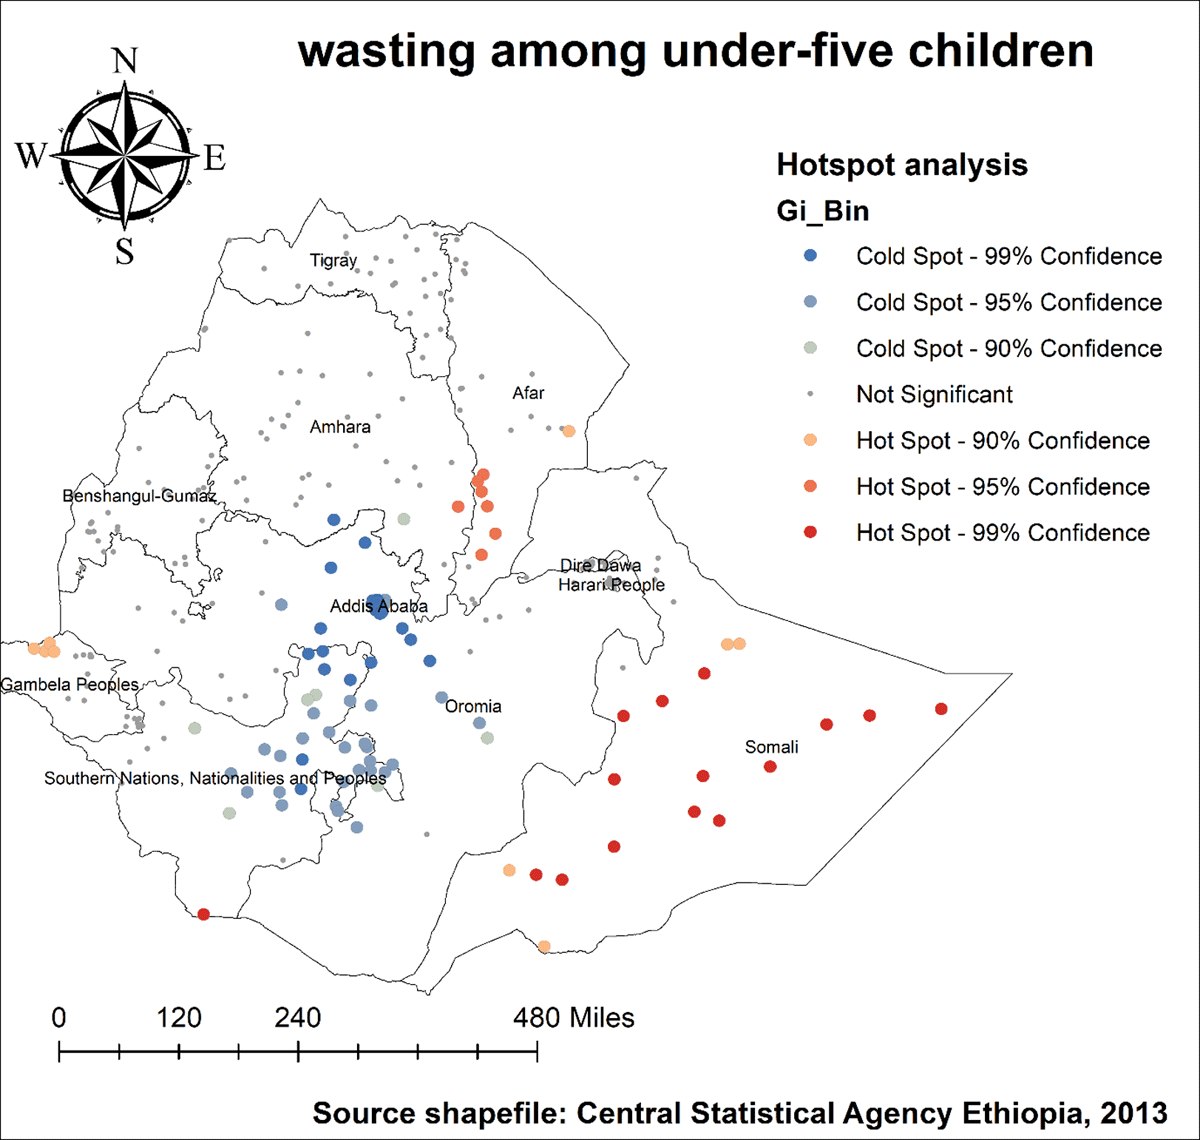
Figure 6
Hotspot analysis of wasting among under-five children in Ethiopia, 2019 EDHS.
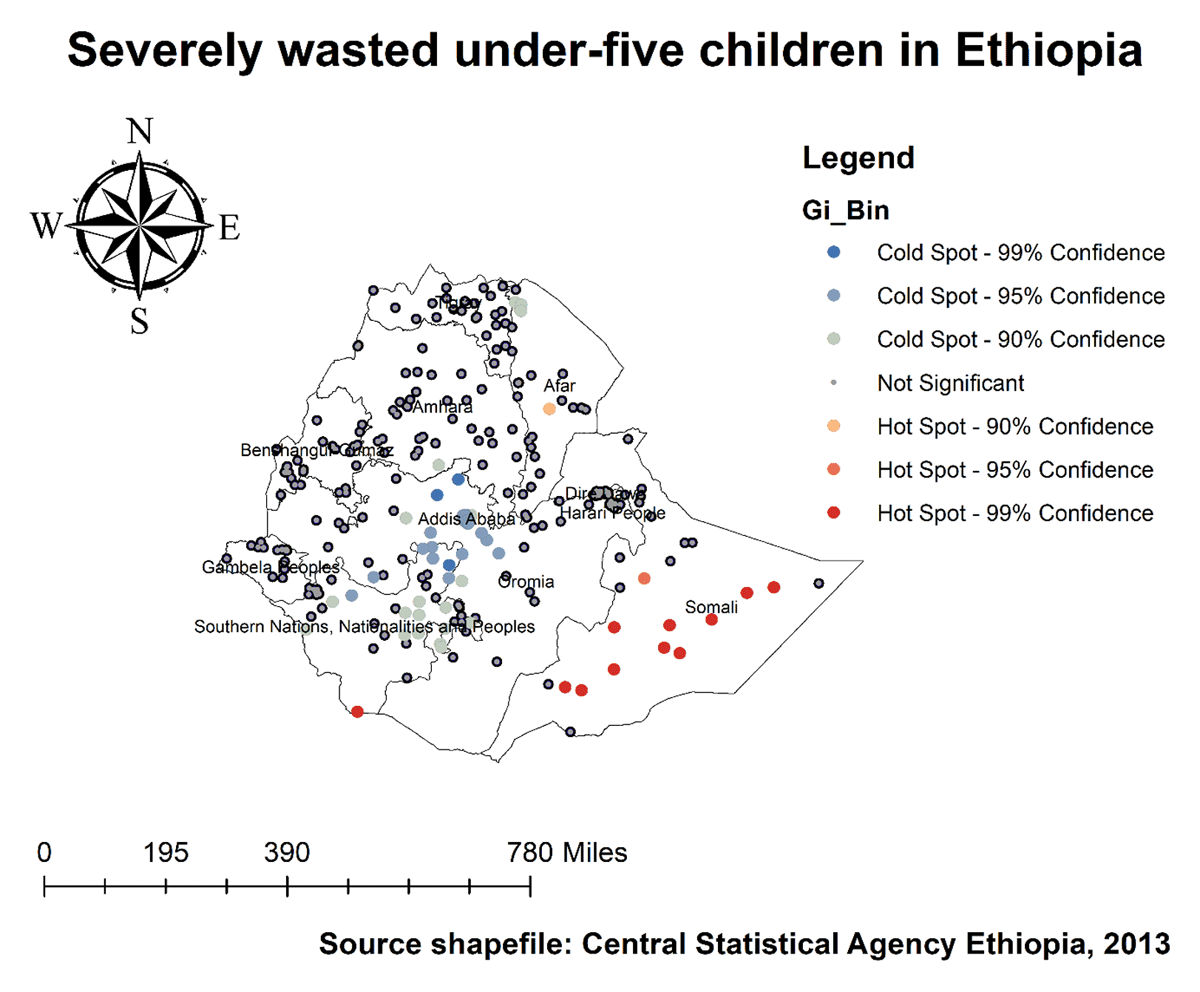
Figure 7
Hotspot analysis of severely wasted under-five children in Ethiopia, 2019 EDHS.
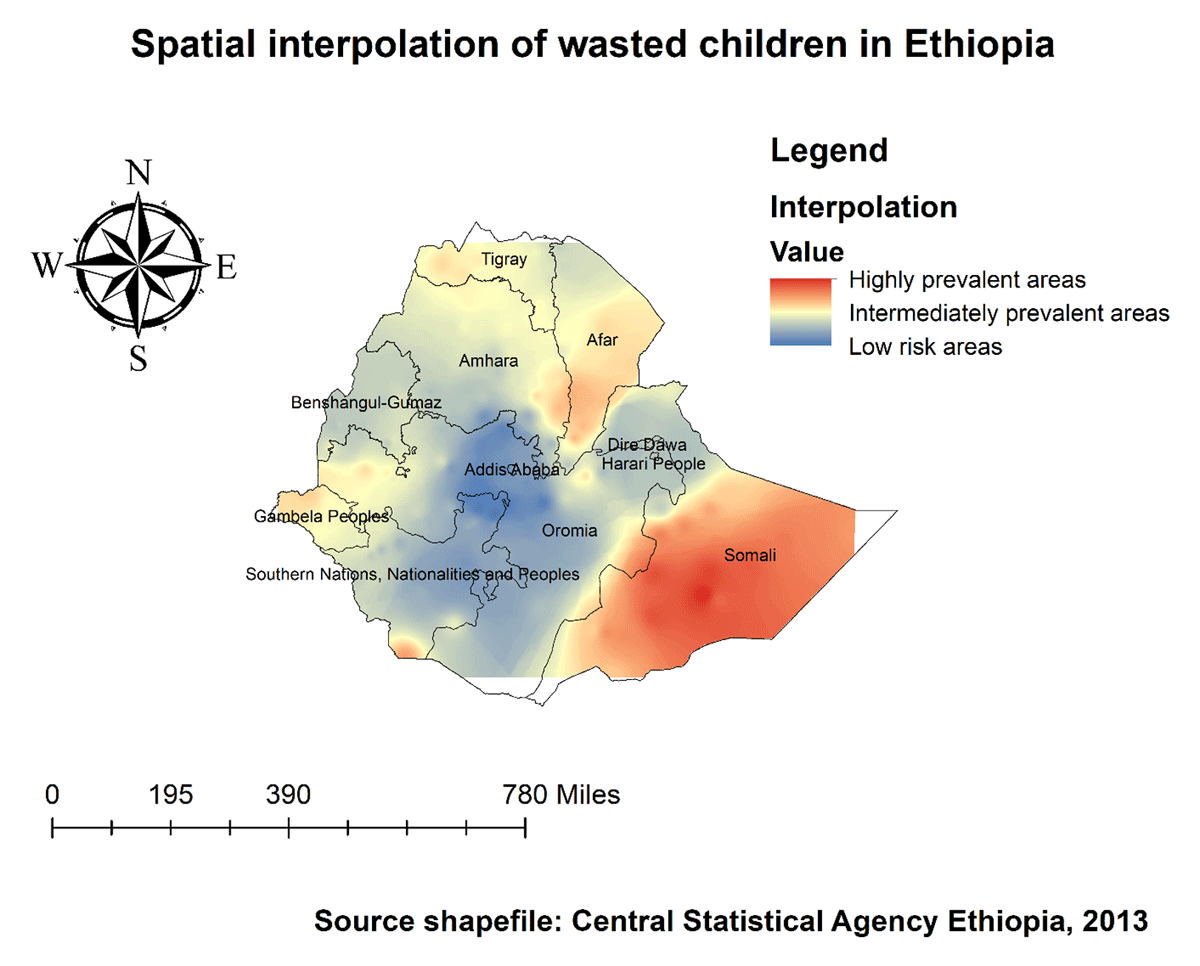
Figure 8
Spatial Interpolation of wasting among under-five children in Ethiopia, EDHS 2019.
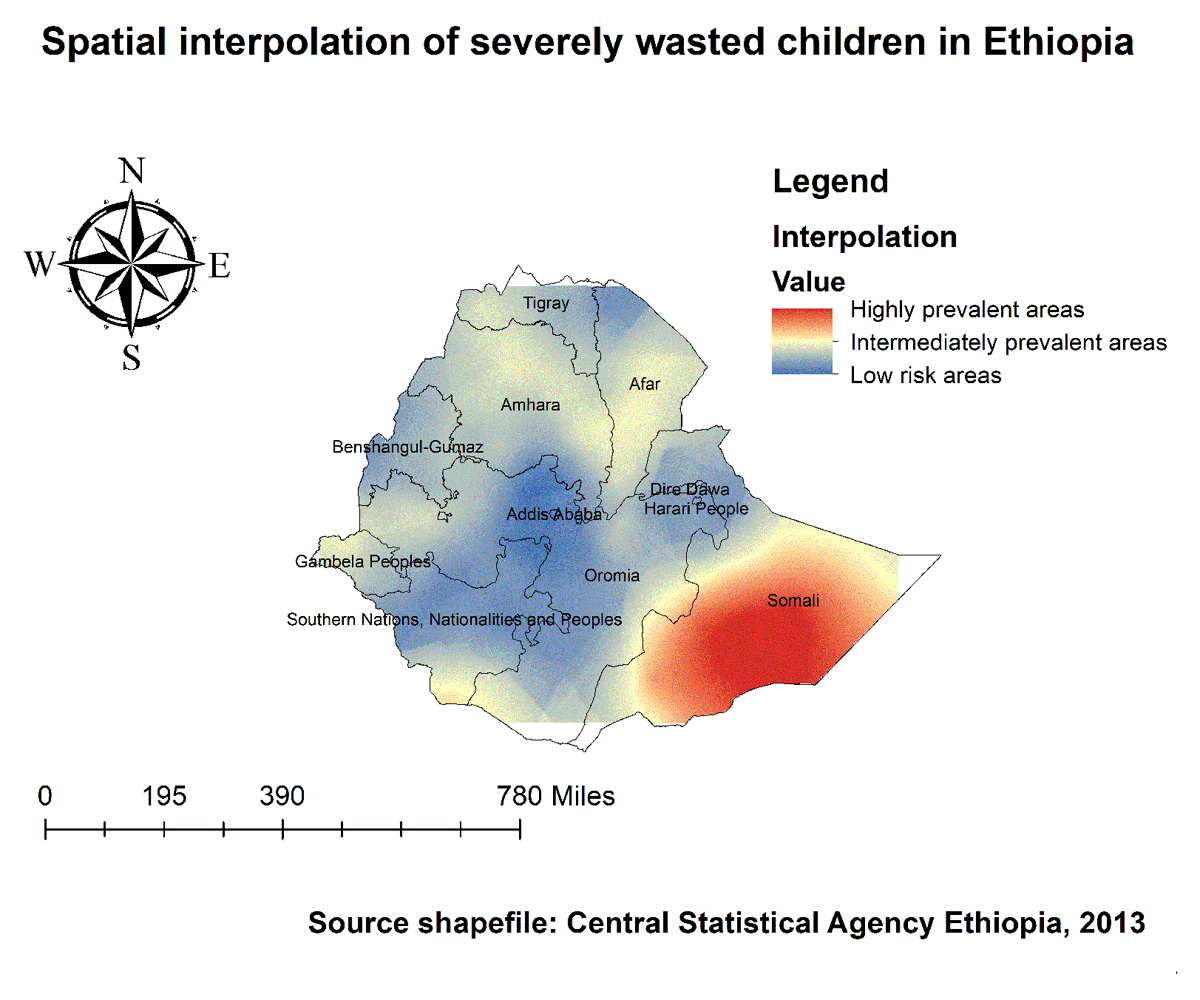
Figure 9
Spatial Interpolation of severely wasted children in Ethiopia, EDHS 2019.
Table 2
Significant Spatial Clusters of Wasting Among Under-Five Children in Ethiopia, 2019.
| YEAR | CLUSTER | ENUMERATION AREAS (CLUSTERS DETECTED) | COORDINATES/RADIUS | POPULATION | CASES | RR | LLR | P-VALUE |
|---|---|---|---|---|---|---|---|---|
| 2019 | 1 | 135, 123, 140, 137, 138, 124, 131, 145, 132, 122, 134, 136, 142, 133, 139, 129, 121, 130, 107, 250, 141 | 6.639662 N, 44.465853 E/381.04 km | 515 | 116 | 2.90 | 46.96 | <0.000 |
| 2 | 193 | 4.495034 N, 36.230625 E/0 km | 36 | 20 | 6.25 | 24.95 | <0.000 | |
| 3 | 42, 40, 69 | 9.548779 N, 40.084216 E/39.15 km | 60 | 20 | 3.75 | 13.72 | <0.000 |
[i] ** N.B LLR, log-likelihood ratio; RR, relative risk.
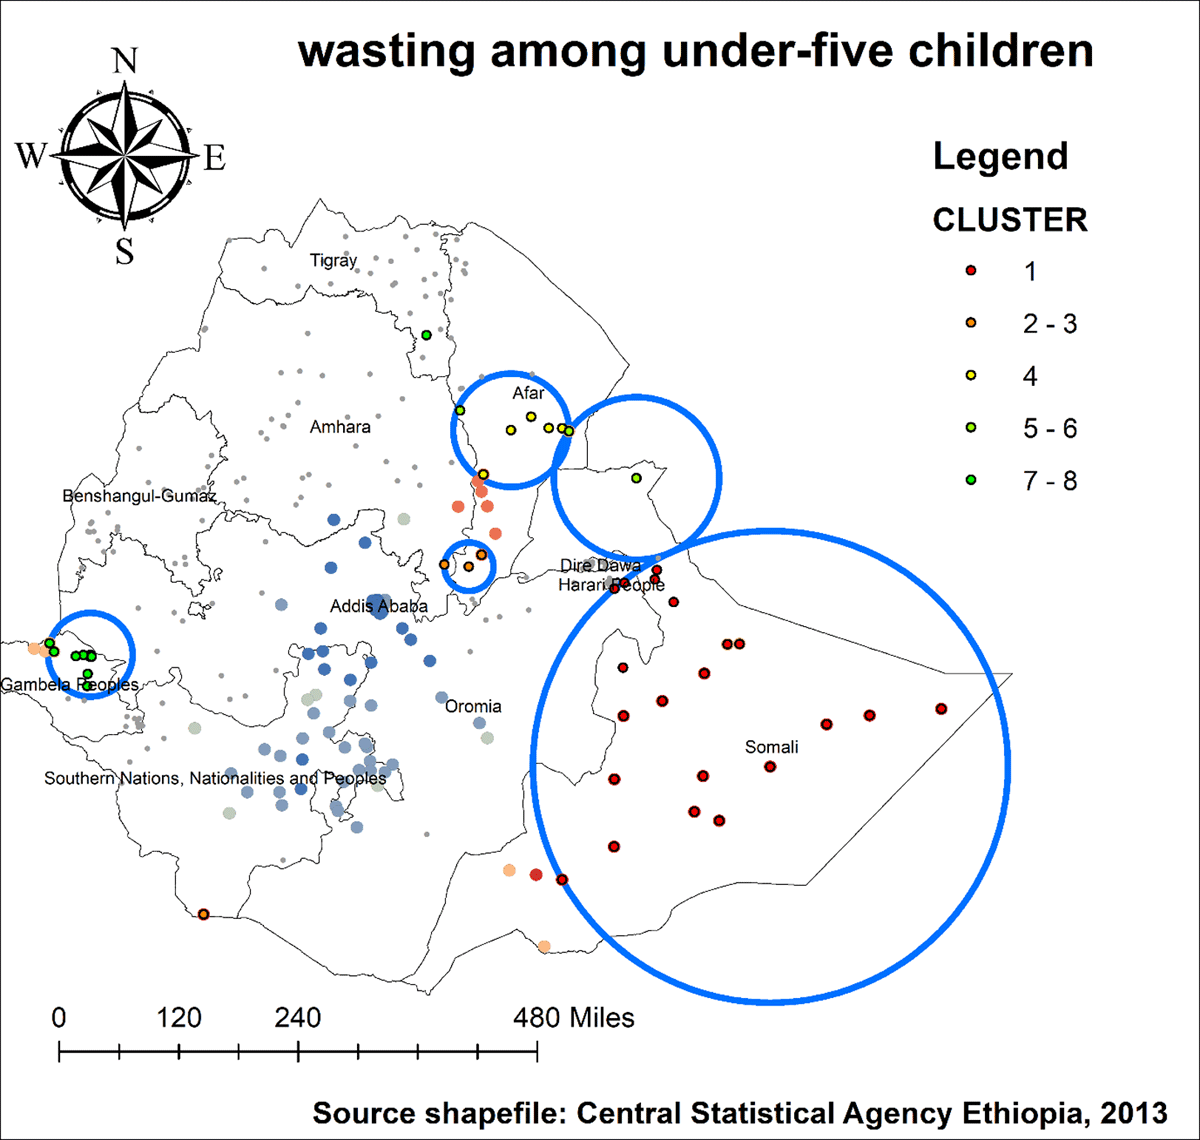
Figure 10
SaTScan scan analysis of wasting among under-five children in Ethiopia, 2019 EDHS.
Table 3
Significant Spatial Clusters Severely Wasted Children in Ethiopia, 2019.
| YEAR | CLUSTER | ENUMERATION AREAS (CLUSTERS DETECTED) | COORDINATES/RADIUS | POPULATION | CASES | RR | LLR | P-VALUE |
|---|---|---|---|---|---|---|---|---|
| 2019 | 1 | 137, 138, 123, 135, 142, 136, 145, 134, 140, 131, 141, 122 | 5.856584 N, 43.726016 E/284.96 km | 291 | 26 | 6.4 | 24.2 | <0.001 |
| 2 | 193 | 4.495034 N, 36.230625 E/0 km | 36 | 6 | 9.8 | 8.56 | <0.030 |
[i] ** N.B LLR, log-likelihood ratio; RR, relative risk.
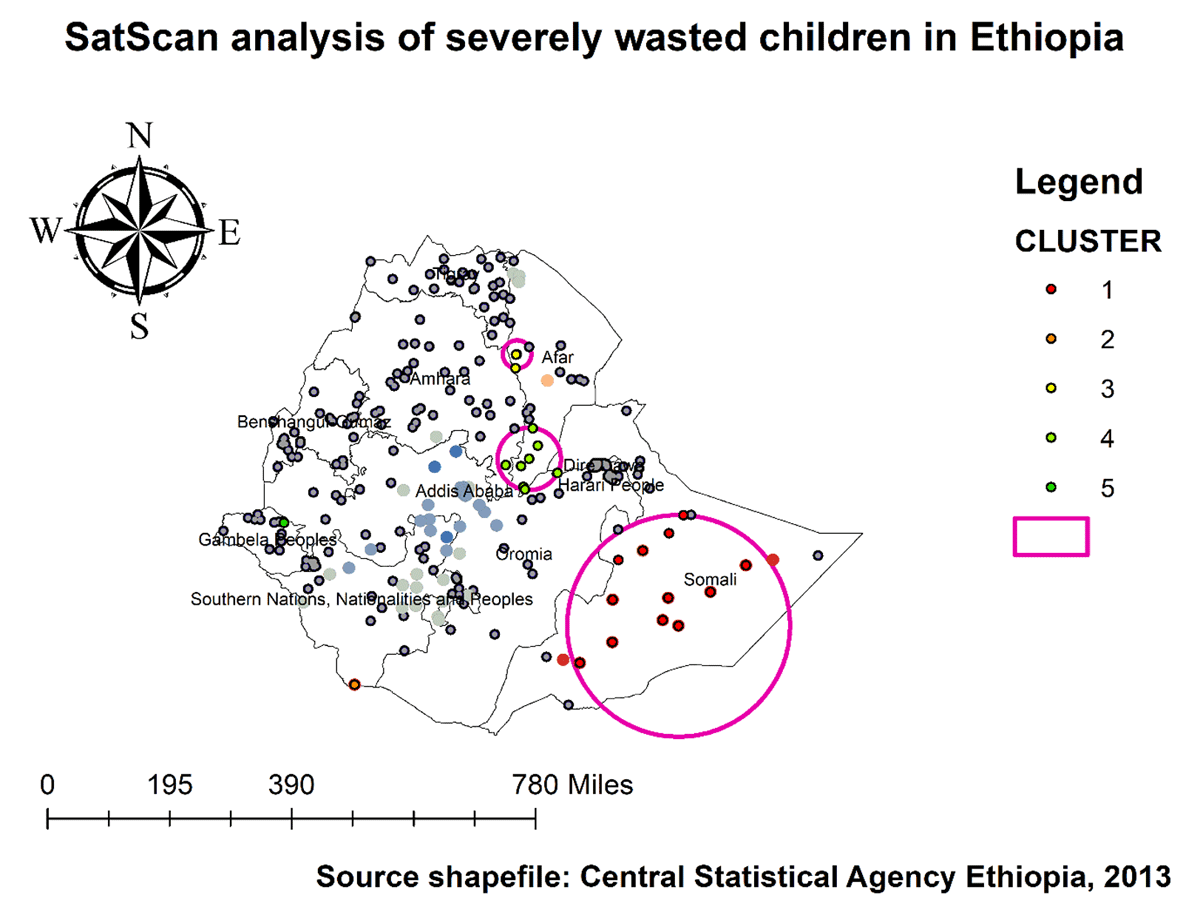
Figure 11
SaTScan scan analysis of severely wasted children in Ethiopia, 2019 EDHS.
Table 4
Model estimates for factors associated with acute malnutrition in 2019.
| 2019 EDHS | MODEL 0 | MODEL 1 | MODEL 2 | MODEL 3 |
|---|---|---|---|---|
| Inter-cluster correlation (ICC) | 0.61 | 0.22 | 0.11 | 0.04 |
| Log-likelihood ratio (LLR) | –1580.1 | –1014.7 | –1480.7 | –984.0 |
| Proportional change in variance (PCV) | Reference | 0.61 | 0.71 | 0.72 |
Table 5
Factors Associated with Wasting Among Children in Ethiopia by Multilevel Logistic Regression Analysis, EDHS 2019.
| VARIABLES | MODEL I | MODEL II | MODEL III |
|---|---|---|---|
| Sex of child | |||
| Male | 1.8 (1.3–2.7)*** | — | 1.9 (1.3–2.7)*** |
| Female | 1.00 | — | 1.00 |
| Child’s age(months) | |||
| 0–5m | 1.00 | — | 1.00 |
| 6–11 m | 0.7 (0.4–1.3) | — | 0.6 (0.3–1.2) |
| 12–23 m | 0.9 (0.6–1.7) | — | 1.0 (0.5–1.8) |
| 24–35m | 0.8 (0.5–1.6) | — | 0.9 (0.5–1.7) |
| >36m | 0.5 (0.3–0.9)* | — | 0.5 (0.2–0.9)* |
| Wealth index | |||
| Poorest | 1.00 | 1.00 | |
| Poorer | 0.8 (0.5–1.2) | — | 1.1 (0.6–1.8) |
| Middle | 0.6 (0.3–1.1) | — | 0.8 (0.4–1.5) |
| Richer | 0.6 (0.4–1.1) | — | 0.9 (0.5–1.7) |
| Richest | 0.5 (0.2–0.8)* | — | 0.6 (0.3–1.4) |
| Source of drinking water | |||
| unimproved | 1.4 (0.9–2.2) | 1.5 (1.0–2.3)* | |
| improved | 1.00 | 1.00 | |
| Region | |||
| Tigray | — | 1.00 | 1.00 |
| Afar | — | 1.6 (0.9–2.8) | 1.1 (0.5–2.1) |
| Amhara | — | 0.8 (0.5–1.4) | 0.7 (0.4–1.3) |
| Oromiya | — | 0.5 (0.3–0.8)* | 0.3 (0.1–0.6)*** |
| Somali | — | 2.7 (1.7–4.3)*** | 1.5 (0.7–2.9) |
| Benishangul Gumz | — | 0.7 (0.3–1.3) | 0.3 (0.2–0.7)*** |
| SNNP | — | 0.6 (0.4–1.3) | 0.4 (0.2–0.7)*** |
| Gambella | — | 1.5 (0.9–2.7) | 1.4 (0.7–2.9) |
| Harari | — | 0.4 (0.2–0.8)* | 0.3 (0.2–0.8)* |
| Addis Abeba | — | 0.3 (0.1–0.7)* | 0.2 (0.1–0.8)* |
| Dire Dawa | — | 0.7 (0.3–1.2) | 0.4 (0.2–0.9)* |