
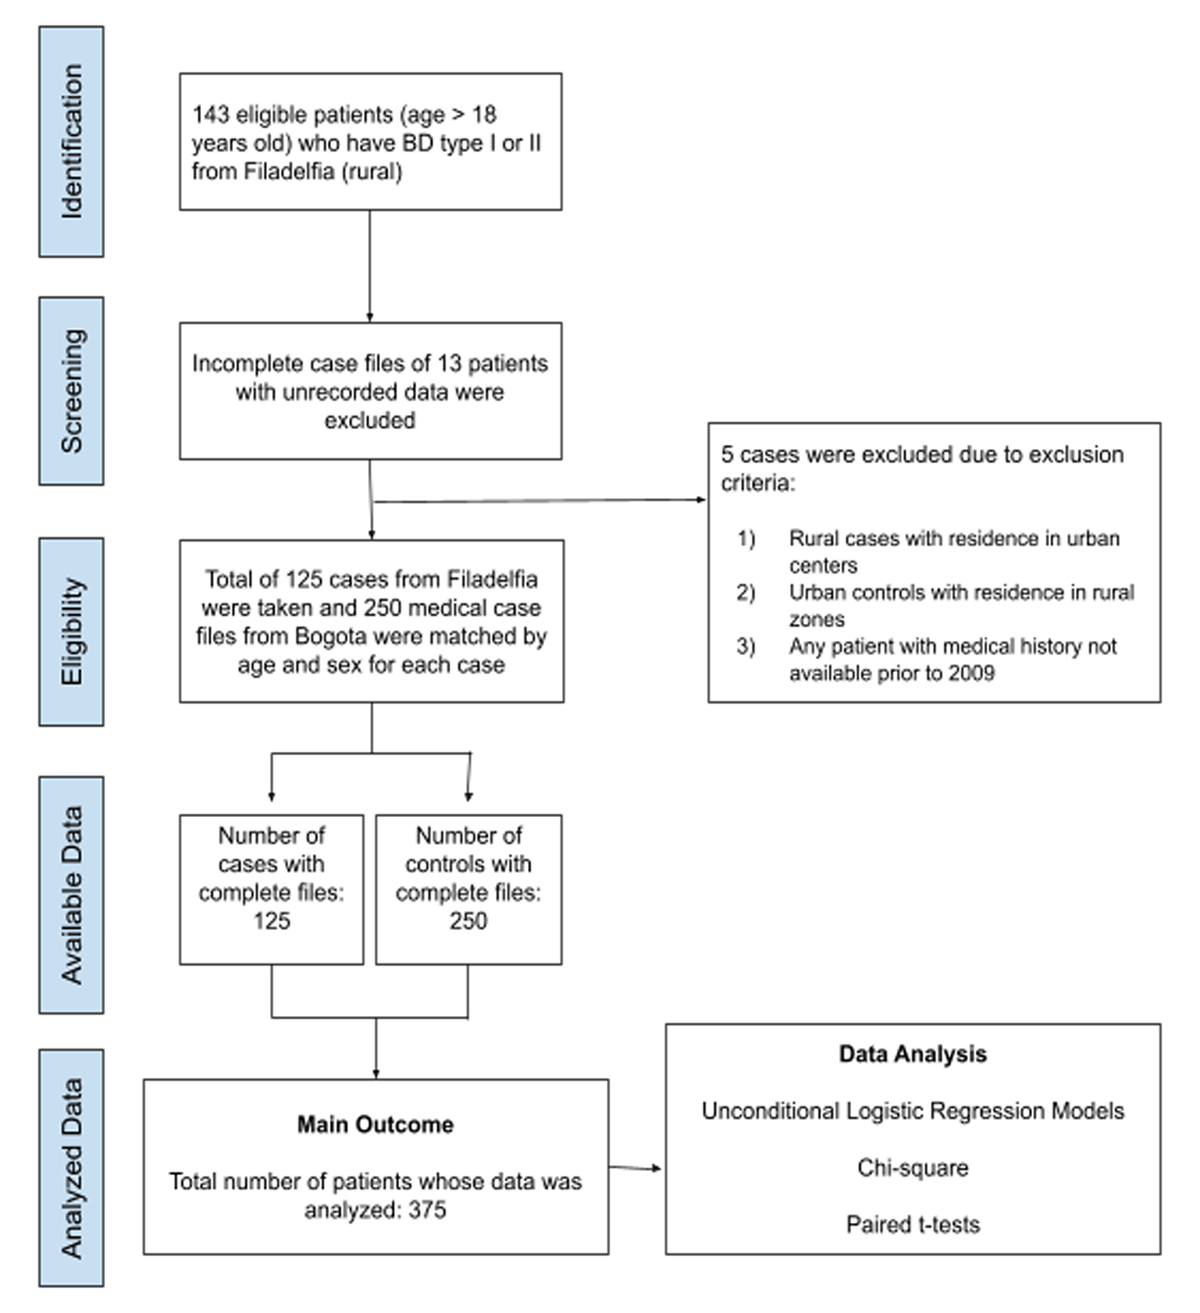
Figure 1a
Diagram of case-control research methodology.
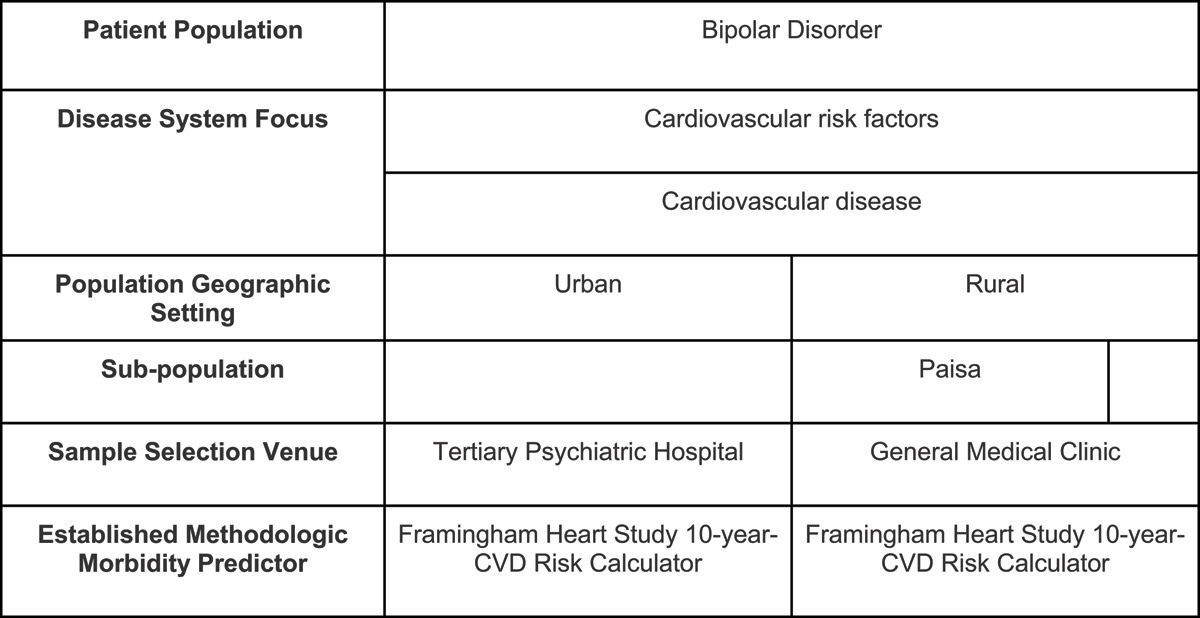
Figure 1b
Table delineating differences in geographic setting, subpopulations, and selection venue between urban and rural cohorts studied with Bipolar Disorder.
Table 1
Demographic information comparing Rural Filadelfia Bipolar Disorder population with urban Bogota Bipolar Disorder Population. Comparison of age, sex, BMI, education, alcohol use, current tobacco use, family history, and non-psychiatric comorbid conditions.
| DEMOGRAPHIC CHARACTERISTICS | RURAL | URBAN | TOTAL | p-VALUE | |||
|---|---|---|---|---|---|---|---|
| n | % OR AVG | n | % OR AVG | n | % OR AVG | ||
| Male | 46 | 36.8 | 92 | 36.8 | 138 | 36.8 | 1.0 |
| Age | 125 | 53.2 | 250 | 54.1 | 375 | 53.8 | 1.0 |
| BMI | 123 | 25.9 | 218 | 26.1 | 341 | 26.0 | 0.73 |
| Completed Education | 19 | 22.1 | 218 | 90.5 | 237 | 72.5 | 1.0 × 10⁻⁴ |
| Alcohol | 7 | 5.98 | 49 | 20.9 | 56 | 15.9 | 3.0 × 10⁻⁴ |
| Smoking | 24 | 20.5 | 84 | 33.6 | 108 | 29.4 | 0.015 |
| Psychiatric Family History | 27 | 24.6 | 156 | 43.5 | 183 | 50.8 | 1.0 × 10⁻⁴ |
| CVD Family History | 30 | 28.3 | 108 | 44.6 | 138 | 39.7 | 0.0042 |
| Pulmonary Conditions | 6 | 4.80 | 26 | 10.4 | 32 | 8.53 | 0.067 |
| GI Conditions | 34 | 27.2 | 36 | 9.60 | 70 | 18.7 | 0.0027 |
| Hypothyroidism | 8 | 6.40 | 55 | 22.0 | 63 | 16.8 | 1.0 × 10⁻⁴ |
Table 2
Differences in psychiatric and non-psychiatric pharmacological treatment between rural (Filadelfia) and urban (Bogota) Bipolar Disorder populations in Colombia.
| PHARMACOLOGICAL TREATMENT | RURAL | URBAN | TOTAL | p-VALUE | |||
|---|---|---|---|---|---|---|---|
| n | % | n | % | n | % | ||
| Valproic Acid | 84 | 67.2 | 115 | 46.0 | 199 | 53.1 | 1.0 × 10⁻⁴ |
| Lithium | 17 | 13.6 | 79 | 31.6 | 96 | 25.6 | 2.0 × 10⁻⁴ |
| Lamotrigine | 1 | 0.8 | 37 | 14.8 | 38 | 10.1 | 1.0 × 10⁻⁴ |
| Anticonvulsants | 13 | 10.4 | 22 | 8.80 | 35 | 9.33 | 0.62 |
| 1st Generation Anti-Psychotics | 17 | 13.6 | 116 | 46.4 | 133 | 35.5 | 1.0 × 10⁻⁴ |
| SSRIs | 52 | 41.6 | 71 | 28.4 | 123 | 32.8 | 1.0 × 10⁻² |
| Atypical Antidepressants | 25 | 20.0 | 34 | 13.6 | 59 | 15.7 | 0.11 |
| 2nd Generation Anti-Psychotics | 47 | 37.6 | 224 | 89.6 | 271 | 72.3 | 1.0 × 10⁻⁴ |
| Lipid Drugs | 24 | 19.2 | 42 | 16.8 | 66 | 17.6 | 0.57 |
| Diabetes | 9 | 7.20 | 19 | 7.60 | 29 | 7.47 | 0.89 |
| Anti-Coagulants/Platelets | 8 | 6.40 | 8 | 3.20 | 16 | 4.27 | 0.15 |
| NSAIDs | 40 | 32.0 | 114 | 45.6 | 154 | 41.1 | 1.0 × 10⁻² |
Table 3
Comparison of overall Cardiovascular Disease morbidity, risk factors and profiles between rural (Filadelfia) and urban (Bogota) patients with Bipolar Disorder in Colombia.
| CVD MORBIDITY | RURAL | URBAN | TOTAL | p-VALUE | |||
|---|---|---|---|---|---|---|---|
| n | % | n | % | n | % | ||
| Overall | 21 | 16.8 | 20 | 8.00 | 41 | 10.9 | 1.0 × 10⁻² |
| CAD | 10 | 8.00 | 9 | 3.60 | 19 | 5.07 | 0.067 |
| PAD | 15 | 12 | 3 | 1.20 | 18 | 4.80 | 1.0 × 10⁻⁴ |
| CHF | 0 | 0 | 4 | 1.60 | 4 | 1.07 | 0.16 |
| Arrhythmia | 2 | 1.60 | 3 | 1.20 | 5 | 1.33 | 0.75 |
| Valvular | 0 | 0 | 1 | 0.40 | 1 | 0.26 | 0.48 |
| Stroke/TIA | 1 | 0.80 | 2 | 0.80 | 3 | 0.80 | 1.0 |
| CVD Risk Factors for FHS | |||||||
| SBP | 119 | 118 | 244 | 123 | 363 | 121 | 3.0 × 10⁻⁴ |
| Treatment for HTN | 39 | 31.2 | 58 | 23.2 | 97 | 25.9 | 0.095 |
| HTN | 38 | 30.4 | 45 | 18.0 | 83 | 22.1 | 0.0064 |
| Diabetes | 12 | 9.60 | 18 | 7.20 | 30 | 8.00 | 0.42 |
| Smoking | 24 | 20.5 | 84 | 33.6 | 108 | 29.4 | 0.015 |
| BMI >30 | 20 | 16.7 | 45 | 20.6 | 65 | 19.2 | 0.37 |
| Dyslipidemia | 55 | 44.0 | 30 | 12.0 | 85 | 22.7 | 1.0 × 10⁻⁴ |
| Estimated CV Risk Prediction | 95 | 9.72 | 206 | 11.3 | 301 | 10.8 | 0.15 |
| >20% 10 yr Risk of CVD | 13 | 13.7 | 42 | 20.4 | 55 | 18.3 | 0.16 |
Table 4
Cardiovascular Disease (CVD) risk profile (>10% risk of CVD in 10 years), education, alcohol consumption, and psychiatric treatment for the rural (Filadelfia) Bipolar Disorder (BD) population when compared with an urban (Bogota) Bipolar Disorder population in Colombia.
| ODDS RATIO | 95% CONFIDENCE INTERVAL | |
|---|---|---|
| CVD Risk | 0.192 | 0.059–0.623 |
| Completed Education | 0.0120 | 0.003–0.045 |
| Alcohol Consumption | 0.191 | 0.032–1.135 |
| 1st Generation Anti-psychotics | 0.115 | 0.029–0.462 |
| 2nd Generation Anti-psychotics | 0.0460 | 0.013–0.156 |
| Valproic Acid | 1.957 | 0.611–6.274 |
| Lithium | 1.74 | 0.472–6.435 |
| Atypical Antidepressants | 1.21 | 0.272–5.382 |
| SSRI | 1.53 | 0.485–4.847 |
Table 5
Risk profiles associated with <10% risk of Cardiovascular Disease (CVD) in 10 years compared to those with >10% risk of CVD in ten years, among Bipolar Disorder patients in Colombia. Lamotrigine was excluded in the rural population due to small sample size.
| BOGOTA (URBAN) | FILADELFIA (RURAL) | |||
|---|---|---|---|---|
| ODDS RATIO | 95% CONFIDENCE INTERVAL | ODDS RATIO | 95% CONFIDENCE INTERVAL | |
| Alcohol | 0.803 | 0.359–1.793 | 0.692 | 0.054–8.825 |
| 1st Generation Anti-psychotics | 1.43 | 0.729–2.794 | 0.638 | 0.121–3.369 |
| 2nd Generation Anti-psychotics | 1.64 | 0.542–4.957 | 1.07 | 0.371–3.081 |
| Lithium | 1.22 | 0.58–2.583 | 1.35 | 0.3086.315 |
| Valproic Acid | 0.521 | 0.264–1.03 | 0.820 | 0.244–2.763 |
| TCA | 1.76 | 0.132–23.518 | 1.57 | 0.191–12.901 |
| SSRI | 1.05 | 0.493–2.228 | 2.19 | 0.711–6.728 |
| Atypical Antidepressants | 3.09 | 0.967–9.886 | 0.605 | 0.154–2.38 |
| Lamotrigine | 1.81 | 0.699–4.7 | ||
| Anticonvulsants | 1.08 | 0.358–3.236 | 1.39 | 0.226–8.563 |
| Lipids Medications | 0.275 | 0.103–0.734 | 1.19 | 0.248–5.69 |
| Anticoagulants | 0.295 | 0.038–2.303 | 2.42 | 0.196–29.871 |
| NSAIDs | 0.707 | 0.63–1.39 | 0.248 | 0.077–0.798 |
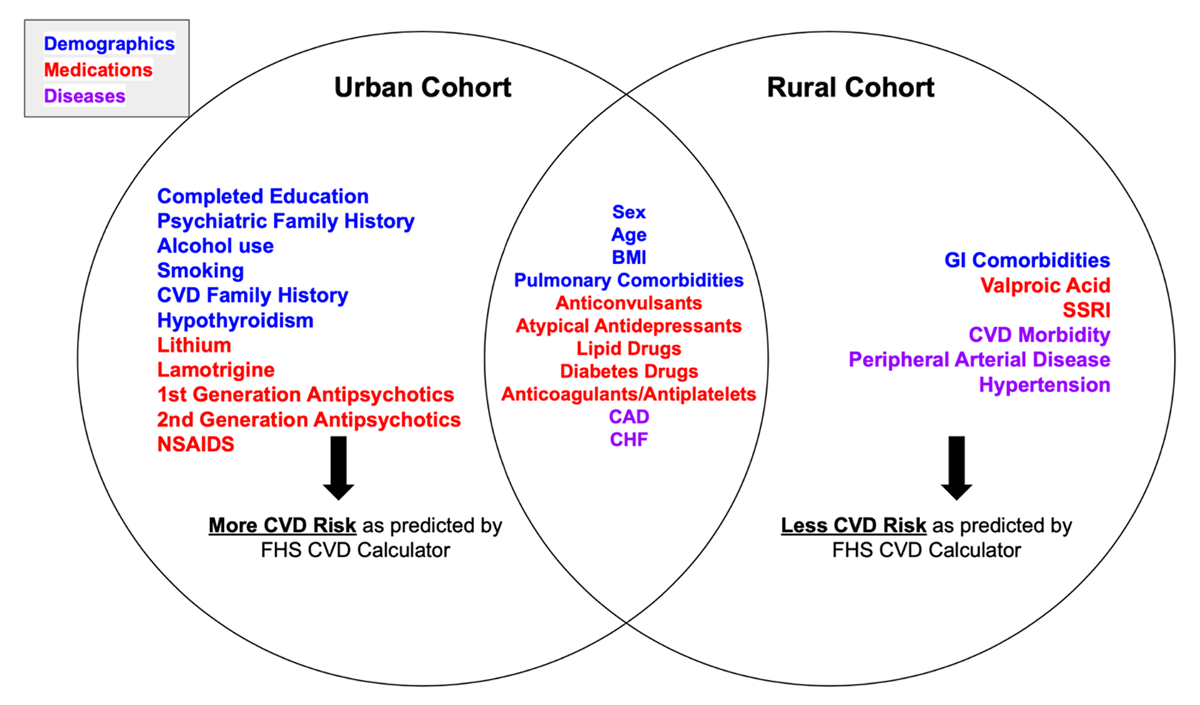
Figure 2
Graphic comparing statistically significant differences and similarities in demographic, pharmacotherapeutic, cardiac comorbid variables, as well as predicted Cardiovascular disease (CVD) risk, between the urban and rural bipolar disorder (BD) cohorts.
Supplementary Table 1
Comparison of unconditional regression models from Bipolar Disorder patients from rural Colombia (Filadelfia) and urban Colombia (Bogota). Modeling is based on patients with low risk profiles (<10% Cardiovascular disease risk in 10 years) when compared to patients with high risk profiles (>10% Cardiovascular disease risk in 10 years). Lamotrigine, TCA, Anticoagulant, and Diabetic Medications were excluded since these variables did not have sufficient variation in the data.
| MODELING PROBABILITY FOR PATIENTS WITH BETTER RISK PROFILES | BOGOTA (URBAN) | FILADELFIA (RURAL) | ||
|---|---|---|---|---|
| ODDS RATIO | 95% CONFIDENCE INTERVAL | ODDS RATIO | 95% CONFIDENCE INTERVAL | |
| Alcohol Consumption | 0.742 | 0.274–2.007 | 0.44 | 0.031–6.218 |
| 1st Generation Anti-psychotics | 1.14 | 0.487–2.66 | 0.715 | 0.117–4.361 |
| 2nd Generation Anti-psychotics | 0.558 | 0.118–2.635 | 1.14 | 0.299–4.352 |
| Lithium | 0.857 | 0.333–2.201 | 3.14 | 0.299–4.352 |
| Valproic Acid | 0.721 | 0.307–1.691 | 1.08 | 0.246–4.746 |
| TCA | 0.753 | 0.038–15.047 | ||
| SSRI | 0.902 | 0.352–2.308 | 1.20 | 0.306–4.678 |
| Atypical Antidepressants | 4.47 | 0.76726.048 | 1.78 | 0.308–10.288 |
| Lamotrigine | 1.17 | 0.366–3.713 | ||
| Anticonvulsants | 1.45 | 0.33–6.397 | 0.689 | 0.107–4.443 |
| Lipid Meds | 0.409 | 0.153–1.093 | 0.597 | 0.114–3.131 |
| Diabetic Meds | 0.0370 | 0.008–0.167 | ||
| Anticoagulant | 0.422 | 0.052–3.429 | ||
| NSAIDs | 0.779 | 0.333–1.822 | 0.471 | 0.122–1.819 |