
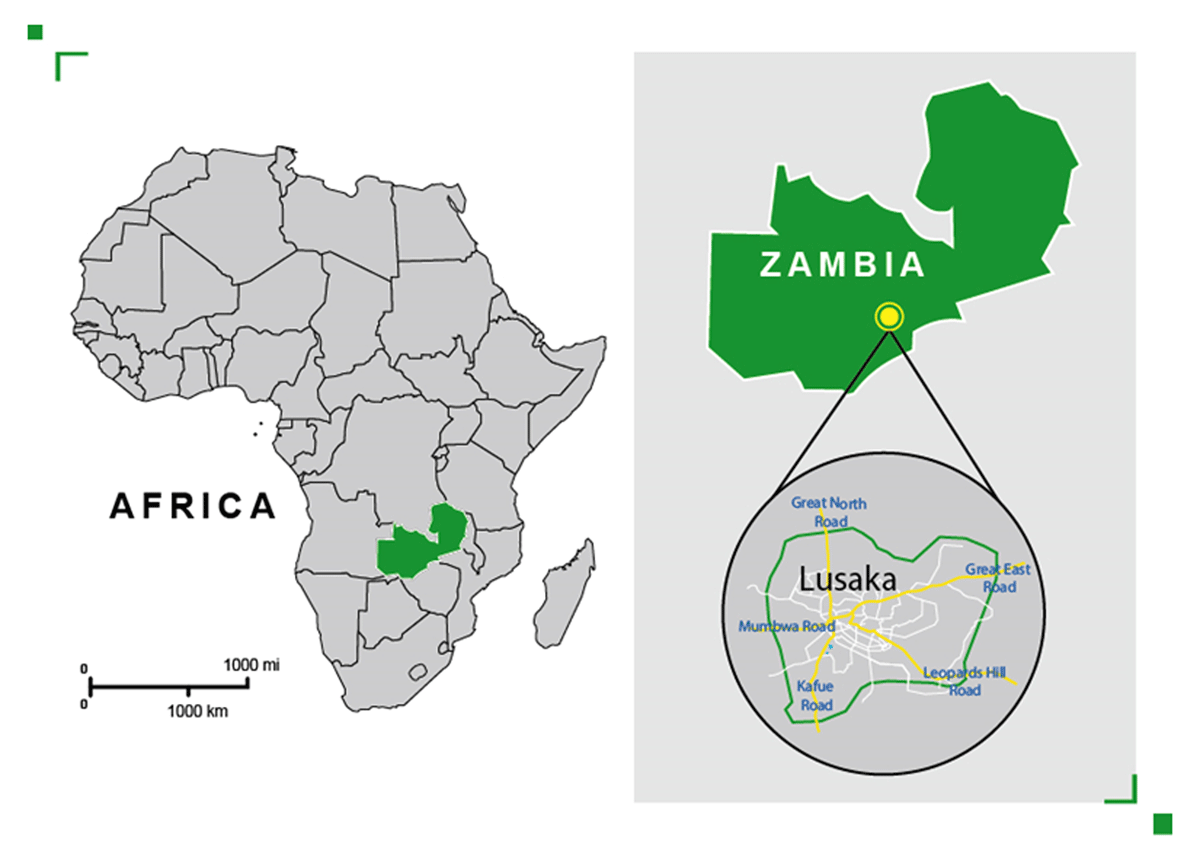
Figure 1
Map of Africa showing Zambia and Lusaka.
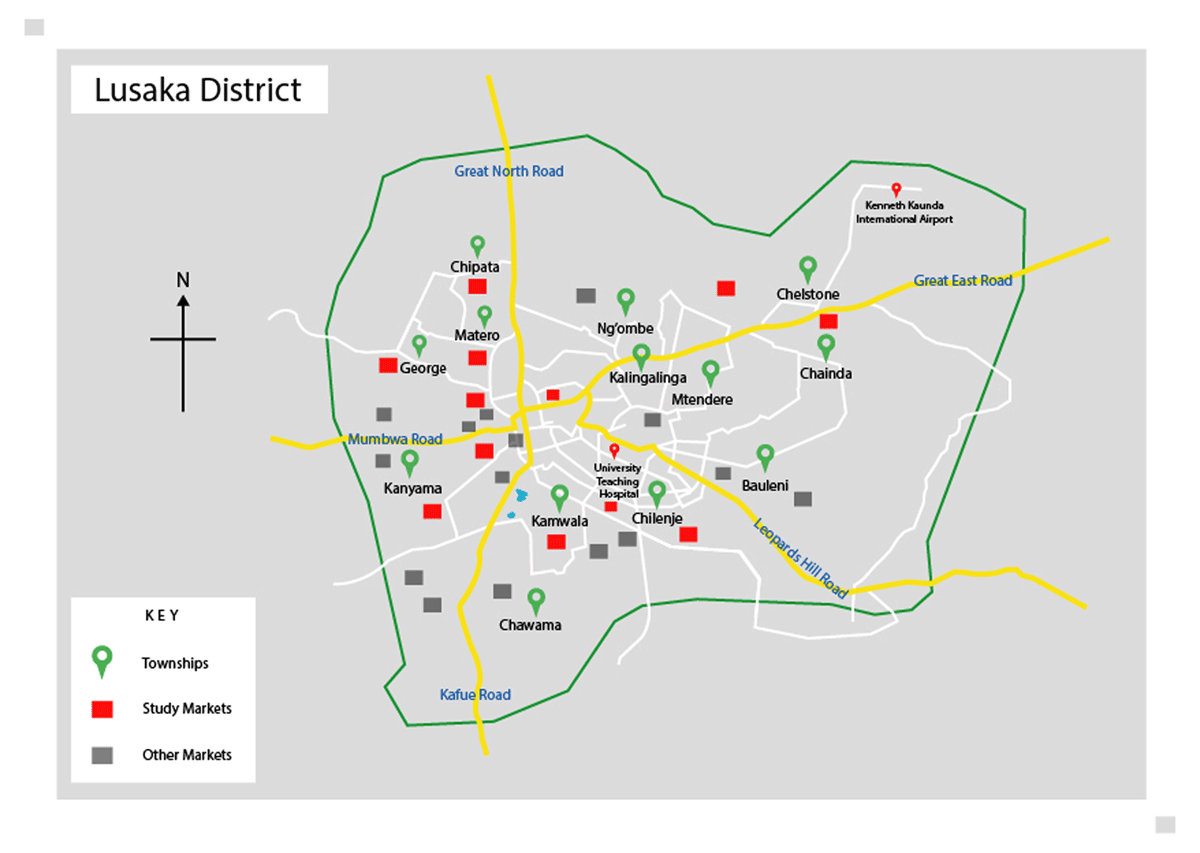
Figure 2
Map of Lusaka District showing the townships and markets.
Table 1
Categorization of observed variables.
| VARIABLE | INFORMATION FOR OBSERVATIONS | BASED ON |
|---|---|---|
| Availability | Availability of the following: Toilets, hand washing facilities, washing facilities, hand drying facilities, source of water, urinals, sanitary bins, and tissue | Public Health Act Cap 295 and Literature |
| Privacy | Private: All the
toilets’ cubicles had lockable doors Not - private: Some or all toilets’ cubicles with non-lockable doors or Some or all toilet cubicle without doors | These checkpoints are the researcher’s interpretation of the acts since they do not specify of privacy and cleanliness |
| Cleanliness | Not clean(poor): Presence of
water, urine or faecal matter on floor and/or wall, plus offensive
smells and flies. Clean(good): No water, urine or faecal matter on floor and/wall, plus absence of offensive smells and flies. | |
| Requirements for toilets and wash hand basins PHA | Adequate: Number of toilets
and hand washing basins: 1–25 workers should be provided with
one (1) latrine (water closet) up to a maximum of the first 100 and
then greater than (>) 100 workers one (1) added latrine for every
40 workers. In addition, hand wash basins and urinals must be
provided for each water closet
provided. Inadequate: Number of toilets and hand washing basins: more than 25 workers using 1 single latrine (water closet) up to a maximum of the first 100 and then greater than (>) 100 workers no added latrine for every 40 workers. With no additional hand wash basins and urinals provided for each water closet provided. | The Public Health Act Cap 295 |
[i] Note: Provision of facilities was measured as yes(available) and no (not available).
PHA: Public Health Act.
Table 2
Provided sanitary facilities in markets of Lusaka district.
| MARKET CATEGORY AND NUMBER | FACILITY | |||||||||
|---|---|---|---|---|---|---|---|---|---|---|
| TOILET | HAND WASHING | WASHING | HAND DRYING | WATER SOURCE | TYPE OF WATER SOURCE | URINAL | SANITARY BIN | SOAP | TISSUE | |
| Township | ||||||||||
| 1 | Yes | Yes | Yes | Yes | Yes | Council | Yes | Yes | No | Yes |
| 2 | Yes | Yes | Yes | Yes | Yes | Council | Yes | Yes | No | Yes |
| 3 | Yes | Yes | Yes | Yes | Yes | Council | Yes | No | No | Yes |
| 4 | Yes | Yes | Yes | No | Yes | Council | Yes | No | No | Yes |
| Peri-Urban | ||||||||||
| 1 | Yes | Yes | Yes | No | Yes | Council | Yes | No | No | Yes |
| 2 | Yes | Yes | Yes | No | Yes | Council | Yes | No | No | Yes |
| 3 | Yes | Yes | No | No | Yes | Borehole | Yes | No | No | Yes |
| 4 | Yes | Yes | Yes | No | Yes | Council | Yes | No | No | Yes |
| Central Business | ||||||||||
| 1 | Yes | Yes | Yes | Yes | Yes | Borehole | Yes | Yes | No | Yes |
| 2 | Yes | Yes | Yes | No | Yes | Council | Yes | Yes | No | Yes |
| 3 | Yes | Yes | Yes | No | Yes | Council | Yes | No | No | Yes |
| 4 | No | No | No | No | No | No | No | No | No | No |
[i] Note: Council water refers to water that is provided by the local authority directly from a centralised water treatment plant.
Source: Field observations.
Table 3
Number of facilities available and required for each market and the state of privacy and cleanliness of the provided facilities.
| MARKET CATEGORY AND NUMBER | NUMBER OF STALLS | SANITARY FACILITIES | STATE | ||||||
|---|---|---|---|---|---|---|---|---|---|
| TOILETS | HAND WASHING | ||||||||
| AVA | REQ | CM | AVA | REQ | CM | PRIVACY | CLEANLINESS | ||
| Township | |||||||||
| 1 | 602 | 9 | 17 | Inad. | 1 | 14 | Inad. | No | Not clean |
| 2 | 442 | 8 | 13 | Inad. | 6 | 12 | Inad. | No | Clean |
| 3 | 224 | 2 | 8 | Inad. | 1 | 9 | Inad. | No | Clean |
| 4 | 392 | 4 | 11 | Inad. | 2 | 10 | Inad. | No | Not clean |
| Peri-Urban | |||||||||
| 1 | 490 | 8 | 14 | Inad. | 1 | 17 | Inad. | No | Not clean |
| 2 | 296 | 16 | 9 | Adeq. | 16 | 7 | Adeq. | No | Clean |
| 3 | 421 | 12 | 13 | Inad. | 12 | 13 | Inad. | No | Not clean |
| 4 | 350 | 4 | 11 | Inad. | 2 | 11 | Inad. | No | Not clean |
| Central Business | |||||||||
| 1 | 1970 | 36 | 51 | Inad. | 63 | 51 | Adeq. | No | Clean |
| 2 | 727 | 22 | 20 | Inad. | 10 | 20 | Inad. | No | Not clean |
| 3 | 647 | 10 | 18 | Inad. | 2 | 18 | Inad. | No | Clean |
| 4 | 500 | 0 | 14 | NP | 0 | 14 | NP | N/A | N/A |
| Total | 7061 | 131 | 196 | Adeq.: 1 Inad.: 10 NP: 1 | 116 | 196 | Adeq.: 2 Inad.: 9 NP: 1 | Private: 0 Not Private: 11 NP: 1 | Clean: 5 Not clean: 6 |
[i] KEY: NP; Not provided, Ava.; Available, Req.; Required, Adeq.; Adequate, Inad.; Inadequate: Cm.; Comment.
Source: Field observations.
Table 4
Perception of traders of the provided sanitary facilities (n = 386).
| FACILITY | FREQUENCY(n) | PROPORTION (%) |
|---|---|---|
| Number of Toilets | ||
| Adequate | 104 | 27 |
| Not adequate | 282 | 73 |
| Number of Hand Washing Facilities | ||
| Adequate | 96 | 25 |
| Inadequate | 226 | 58 |
| Not provided | 64 | 17 |
| Privacy of Facilities | ||
| Private | 108 | 28 |
| Not private | 278 | 72 |
| Siting of Facilities | ||
| Far | 148 | 38 |
| Near | 237 | 61 |
| Missing | 1 | 0.3 |
| Cleanliness of Facilities | ||
| Good | 84 | 22 |
| Poor | 302 | 78 |
| Use of Facilities | ||
| Always | 96 | 25 |
| Sometimes | 267 | 69 |
| Do not use | 23 | 6 |
[i] Source: Field interviews.