
Table 1
Demographic features of JE cases in Gansu, 2005–2011.
| DEMOGRAPHIC CHARACTERISTICS | NO. (%) OF FOLLOW UP | NO. (%) OF LOST | NO. (%) OF TOTAL | ||||
|---|---|---|---|---|---|---|---|
| EXAMINATIONS | REFUSED | DIED | |||||
| DIED OF JE | NOT DIED OF JE | TOTAL DIED | |||||
| Ages(years) | |||||||
| 0- | 25(86.2) | 2(6.9) | 0(0.0) | 0(0.0) | 0(0.0) | 2(6.9) | 29(100.0) |
| 6– | 25(73.5) | 5(14.7) | 2(5.9) | 1(2.9) | 3(8.8) | 1(3.0) | 34(100.0) |
| 15– | 18(52.9) | 7(20.6) | 5(14.7) | 0(0.0) | 5(14.7) | 4(11.8) | 34(100.0) |
| 45–76 | 17(33.3) | 5(9.8) | 18(35.3) | 7(13.7) | 25(49.0) | 4(7.9) | 51(100.0) |
| Sex | |||||||
| F | 39(52.7) | 10(13.5) | 16(21.6) | 4(5.4) | 20(27.0) | 5(6.8) | 74(100.0) |
| M | 46(62.1) | 9(12.2) | 9(12.2) | 4(5.4) | 13(17.6) | 6(8.1) | 74(100.0) |
| Career | |||||||
| Toddlers | 25(80.6) | 3(9.7) | 0(0.0) | 0(0.0) | 0(0.0) | 3(9.7) | 31(100.0) |
| Students | 28(75.7) | 5(13.5) | 2(5.4) | 1(2.7) | 3(8.1) | 1(2.7) | 37(100.0) |
| Farmers | 25(39.7) | 9(14.3) | 20(31.8) | 5(7.9) | 25(39.7) | 4(6.3) | 63(100.0) |
| Others | 7(41.2) | 2(11.8) | 3(17.6) | 2(11.8) | 5(29.4) | 3(17.6) | 17(100.0) |
| Prefectures | |||||||
| Pingliang | 25(56.8) | 1(2.3) | 12(27.3) | 3(6.8) | 15(34.1) | 3(6.8) | 44(100.0) |
| Tianshui | 17(46.0) | 7(18.9) | 9(24.3) | 1(2.7) | 10(27.0) | 3(8.1) | 37(100.0) |
| Longnan | 43(64.2) | 11(16.4) | 4(6.0) | 4(6.0) | 8(12.0) | 5(7.4) | 67(100.0) |
| Year of discharge | |||||||
| 2005–2006 | 66(65.3) | 7(6.9) | 18(17.8) | 5(5.0) | 23(22.8) | 5(5.0) | 101(100.0) |
| 2007–2011 | 19(40.4) | 12(25.5) | 7(14.9) | 3(6.4) | 10(21.3) | 6(12.8) | 47(100.0) |
| Total | 85(57.4) | 19(12.9) | 25(16.9) | 8(5.4) | 33(22.3) | 11(7.4) | 148(100.0) |
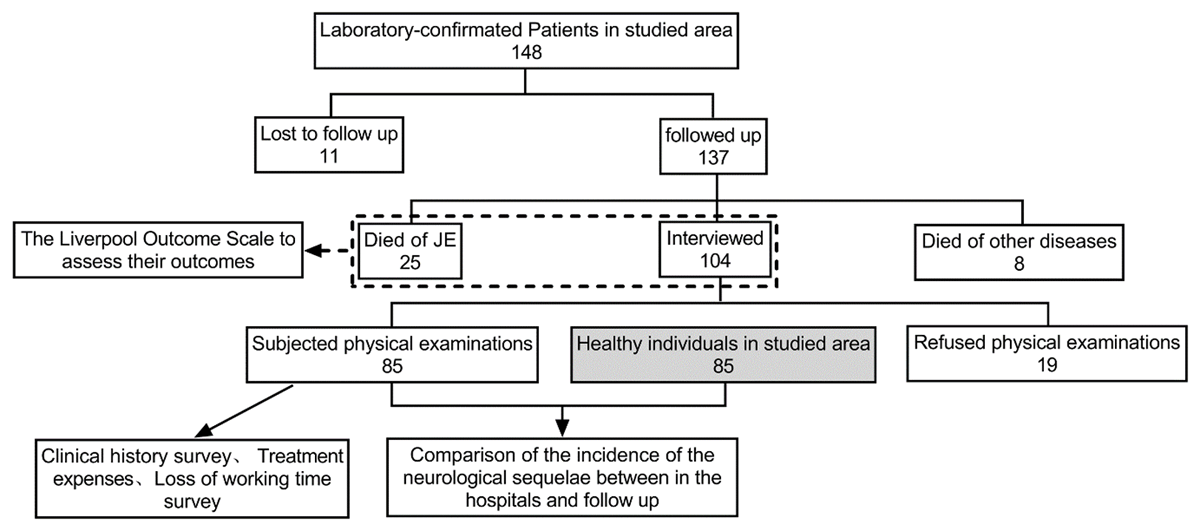
Figure 1
Summary findings and assessment for 148 JE patients followed up 8 years after hospital discharge.
Table 2
Comparisons of Neurological symptoms by age group.
| AGE GROUP | NEUROLOGICAL SYMPTOMS (%) | MENTAL DISORDERS (%) | WITH ANY OF SYMPTOMS (%) | |||||
|---|---|---|---|---|---|---|---|---|
| CRANIAL NERVES SYMPTOMS | MOTOR NEURON SYMPTOMS | APHASIA | EPILEPSY OR TIC | SENSORY NEURON SYMPTOMS | WITH ANY OF NEUROLOGICAL SYMPTOMS | |||
| 2–14 years (N = 50) | ||||||||
| JE group | 2(4.0) | 11(22.0) | 2(4.0) | 6(12.0) | 2(4.0) | 17(34.0) | 5(10.0) | 17(34.0) |
| Healthy group | 0(0.0) | 0(0.0) | 0(0.0) | 0(0.0) | 0(0.0) | 0(0.0) | 0(0.0) | 0(0.0) |
| McNemar or Corrected χ2 | 0.5 | 25.0 | 0.5 | 4.2 | 0.5 | 15.1 | 3.2 | 15.1 |
| P value | 0.50 | 0.00 | 0.50 | 0.03 | 0.50 | 0.00 | 0.06 | 0.00 |
| ≥15 years (N = 35) | ||||||||
| JE group | 2(5.7) | 18(51.4) | 5(14.3) | 2(5.7) | 21(60.0)) | 21(60.0) | 9(25.7) | 21(60.0) |
| Healthy group | 0(0.0) | 2(4.0) | 0(0.0) | 0(0.0) | 0(0.0) | 2(0.0) | 0(0.0) | 2(4.0) |
| McNemar or Corrected χ2 | 0.5 | 11.3 | 3.2 | 0.5 | 19.1 | 14.1 | 7.1 | 14.1 |
| P value | 0.50 | 0.00 | 0.06 | 0.50 | 0.00 | 0.00 | 0.00 | 0.00 |
| Total (N = 85) | ||||||||
| JE group | 4(4.7) | 29(34.1) | 7(8.2) | 8(9.4) | 23(27.1) | 38(44.7) | 14(16.5) | 38(44.7) |
| Healthy group | 0(0.0) | 2(2.4) | 0(0.0) | 0(0.0) | 0(0.0) | 2(2.4) | 0(0.0) | 2(2.4) |
| McNemar or Corrected χ2 | 2.3 | 21.8 | 5.1 | 6.1 | 21.0 | 30.6 | 11.3 | 30.6 |
| P value | 0.13 | 0.00 | 0.02 | 0.02 | 0.00 | 0.00 | 0.00 | 0.00 |

Figure 2
Quantitative analysis of results of intelligence and memory by age group.
Table 3
Comparisons of intelligence and memory by age group.
| AGE GROUP | INTELLIGENCE EXAMINATION (%) | DEMENTIA | TOTAL LOWER INTELLIGENCE (%) | LOWER MEMORY | ||
|---|---|---|---|---|---|---|
| IQ < 70 | VIQ < 70 | PIQ < 70 | MQ < 70(%) | |||
| 2–14 years | N = 45 | N = 45 | N = 45 | N = 5 | N = 50 | N = 42 |
| JE group | 1(2.2) | 0(0.0) | 1(2.2) | 4(80.0) | 5(10.0) | 19(45.2) |
| Healthy group | 0(0.0) | 0(0.0) | 0(0.0) | 0(0.0) | 0(0.0) | 2(4.8) |
| McNemar or Corrected χ2 | 0.0 | N/A | 0.0 | 2.3 | 3.2 | 15.1 |
| P value | 1.00 | N/A | 1.00 | 0.13 | 0.06 | 0.00 |
| ≥15 years | N = 29 | N = 29 | N = 29 | N = 6 | N = 35 | N = 29 |
| JE group | 7(24.1) | 7(24.1) | 8(27.6) | 6(100.0) | 13(37.1) | 21(72.4) |
| Healthy group | 1(3.4) | 1(3.4) | 1(3.4) | 0(0.0) | 1(2.9) | 7(24.1) |
| McNemar or Corrected χ2 | 4.2 | 4.2 | 5.1 | 4.2 | 10.1 | 10.6 |
| P value | 0.03 | 0.03 | 0.02 | 0.03 | 0.00 | 0.00 |
| Total | N = 74 | N = 74 | N = 74 | N = 11 | N = 85 | N = 71 |
| JE group | 8(10.8) | 7(9.5) | 9(12.2) | 10(90.9) | 18(21.2) | 40(56.3) |
| Healthy group | 1(1.4) | 1(1.4) | 1(1.4) | 0(0.0) | 1(1.2) | 9(12.7) |
| McNemar or Corrected χ2 | 5.1 | 4.2 | 6.1 | 8.1 | 15.1 | 27.3 |
| P value | 0.02 | 0.03 | 0.01 | 0.00 | 0.00 | 0.00 |

Figure 3
Comparisons of influence of functional impairment by age group for surviving cases.
Table 4
Median DALY (P25, P75) lost per patient.
| GENDER GROUP | DEATH | SURVIVAL | TOTAL | |||
|---|---|---|---|---|---|---|
| N | YLL | N | YLD | N | DALY | |
| Male | ||||||
| 2–14 years | 1 | 37.2(37.2, 37.2) | 30 | 6.7(0.0, 15.4) | 31 | 13.5(0.0, 16.5) |
| ≥15 years | 8 | 11.3(8.5, 24.5) | 27 | 6.5(0.0, 11.1) | 35 | 8.6(0.0, 11.5) |
| Sub-total | 9 | 11.5(8.6, 28.4) | 57 | 6.5(0.0, 14.2) | 66 | 8.7(0.0, 14.2) |
| Female | ||||||
| 2–14 years | 1 | 37.6(37.6, 37.6) | 27 | 13.1(0.0, 16.7) | 28 | 13.4(0.0, 17.0) |
| ≥15 years | 15 | 11.0(9.3, 19.3) | 20 | 6.5(0.0, 9.8) | 35 | 9.2(5.5, 12.2) |
| Sub-total | 16 | 11.3(9.3, 21.9) | 47 | 7.7(0.0, 16.3) | 63 | 9.3(0.0, 16.7) |
| Total | ||||||
| 2–14 years | 2 | 37.4(37.2, 37.6) | 57 | 13.1(0.0, 16.6) | 59 | 13.5(0.0, 16.7) |
| ≥15 years | 23 | 11.2(8.8, 19.3) | 47 | 6.5(0.0, 10.8) | 70 | 8.7 (4.9, 11.8) |
| Sub-total | 25 | 11.5(9.0, 22.8) | 104 | 7.2(0.0, 14.6) | 129 | 9.2(0.0, 15.1) |
Table 5
Comparison of direct and indirect medical expenses in the same age group ($).
| EXPENSE | AGE | TOTAL | |
|---|---|---|---|
| 2–14 YEARS | ≥15 YEARS | ||
| Direct expense in acute phase (N = 60) | 1137.4 (827.4, 2600.6) | 2029.0 (1264.1, 4239.2) | 1644.0 (913.1, 2883.3) |
| Outpatient cost before hospitalization (N = 60) | 35.6 (1.7, 57.0) | 26.7 (0.0, 72.1) | 26.7 (0.4, 56.4) |
| Hospital costs (n = 85) | 888.0 (534.0, 1748.8) | 1779.8 (1022.7, 3559.6) | 1263.7 (637.7, 2435.2) |
| Transportation fee (n = 85) | 51.4 (27.0, 138.6) | 53.4 (7.1, 251.7) | 53.4 (18.9, 179.5) |
| Health-food costs (n = 60) | 109.6 (31.9, 253.0) | 154.8 (0.0, 178.0) | 144.2 (8.0, 178.0) |
| Indirect expense in acute phase (n = 60) | 346.5 (77.1, 800.9) | 533.9 (0.0, 913.9) | 371.4 (19.3, 832.8) |
| Treatment costs during rehabilitation (n = 60) | 145.9 (87.7, 478.2) | 889.9 (430.9, 1423.8) | 246.2 (102.6, 978.9) |
| Total costs (n = 60) | 1908.1 (1147.7, 4236.1) | 3986.8 (2357.1, 5988.2) | 2776.6 (1363.5, 5598.9) |
[i] Median cost (P25, P75).