
Table 1
Characteristics of the study population overall and by hepatitis B status.
| VARIABLE | ALL (n = 245) | HEPATITIS B NEGATIVE (n = 230) | HEPATITIS B POSITIVE (n = 15) | P-VALUE |
|---|---|---|---|---|
| Age | 0.971 | |||
| Mean (STD) | 37.90 (8.42) | 37.88 (8.40) | 38.23 (9.09) | |
| Median (IQR) | 37.00 (31.00, 43.00) | 37.00 (31.00, 43.00) | 37.00 (33.00, 39.00) | |
| Min and Max | 19.00, 60.00 | 19.00, 60.00 | 27.00, 58.00 | |
| Missing N (%) | 27 (11.02%) | 25 (10.87%) | 2 (13.33%) | |
| Sex N (%) | 0.137 | |||
| Female | 172 (70.20%) | 164 (71.30%) | 8 (53.33%) | |
| Male | 68 (27.76%) | 61 (26.52%) | 7 (46.67%) | |
| Missing | 5 (2.04%) | 5 (2.17%) | 0 (0.00%) | |
| Healthcare Role N (%) | 0.201 | |||
| Clinical | 189 (77.14%) | 179 (77.83%) | 10 (66.67%) | |
| Non-Clinical | 49 (20.00%) | 44 (19.13%) | 5 (33.33%) | |
| Missing | 7 (2.86%) | 7 (3.04%) | 0 (0.00%) | |
| Department N (%) | ||||
| Emergency Department | 2 (0.82%) | 2 (0.87%) | 0 (0.00%) | |
| General Staff | 90 (36.73%) | 81 (35.22%) | 9 (60.00%) | |
| Medicine | 34 (15.10%) | 35 (15.21%) | 2 (13.33%) | |
| OBGYN/Maternity | 49 (20.00%) | 48 (20.87%) | 1 (6.67%) | |
| Pediatrics | 32 (13.06%) | 31 (13.48%) | 1 (6.67%) | |
| Surgery | 26 (10.61%) | 26 (11.30%) | 0 (0.00%) | |
| Missing | 9 (3.67%) | 7 (3.04%) | 2 (13.33%) | |
| Specific Healthcare Role N (%) | ||||
| Clinical Staff | 17 (6.94%) | 17 (7.39%) | 0 (0.00%) | |
| Housekeeping | 1 (0.41%) | 1 (0.43%) | 0 (0.00%) | |
| Intern | 1 (0.41%) | 1 (0.43%) | 0 (0.00%) | |
| Medical Student | 43 (17.55%) | 38 (16.52%) | 5 (33.33%) | |
| Midwife | 17 (6.94%) | 16 (6.96%) | 1 (6.67%) | |
| Non-Clinical Staff | 48 (19.59%) | 43 (18.70%) | 5 (33.33%) | |
| Nurse | 71 (28.98%) | 68 (29.57%) | 3 (20.00%) | |
| Physician | 40 (16.33%) | 39 (16.96%) | 1 (6.67%) | |
| Missing | 7 (2.86%) | 7 (3.04%) | 0 (0.00%) |
[i] P-values do not include missing values. Fisher’s exact tests were used for categorical variables and Wilcoxon two-sample tests for the continuous variable.
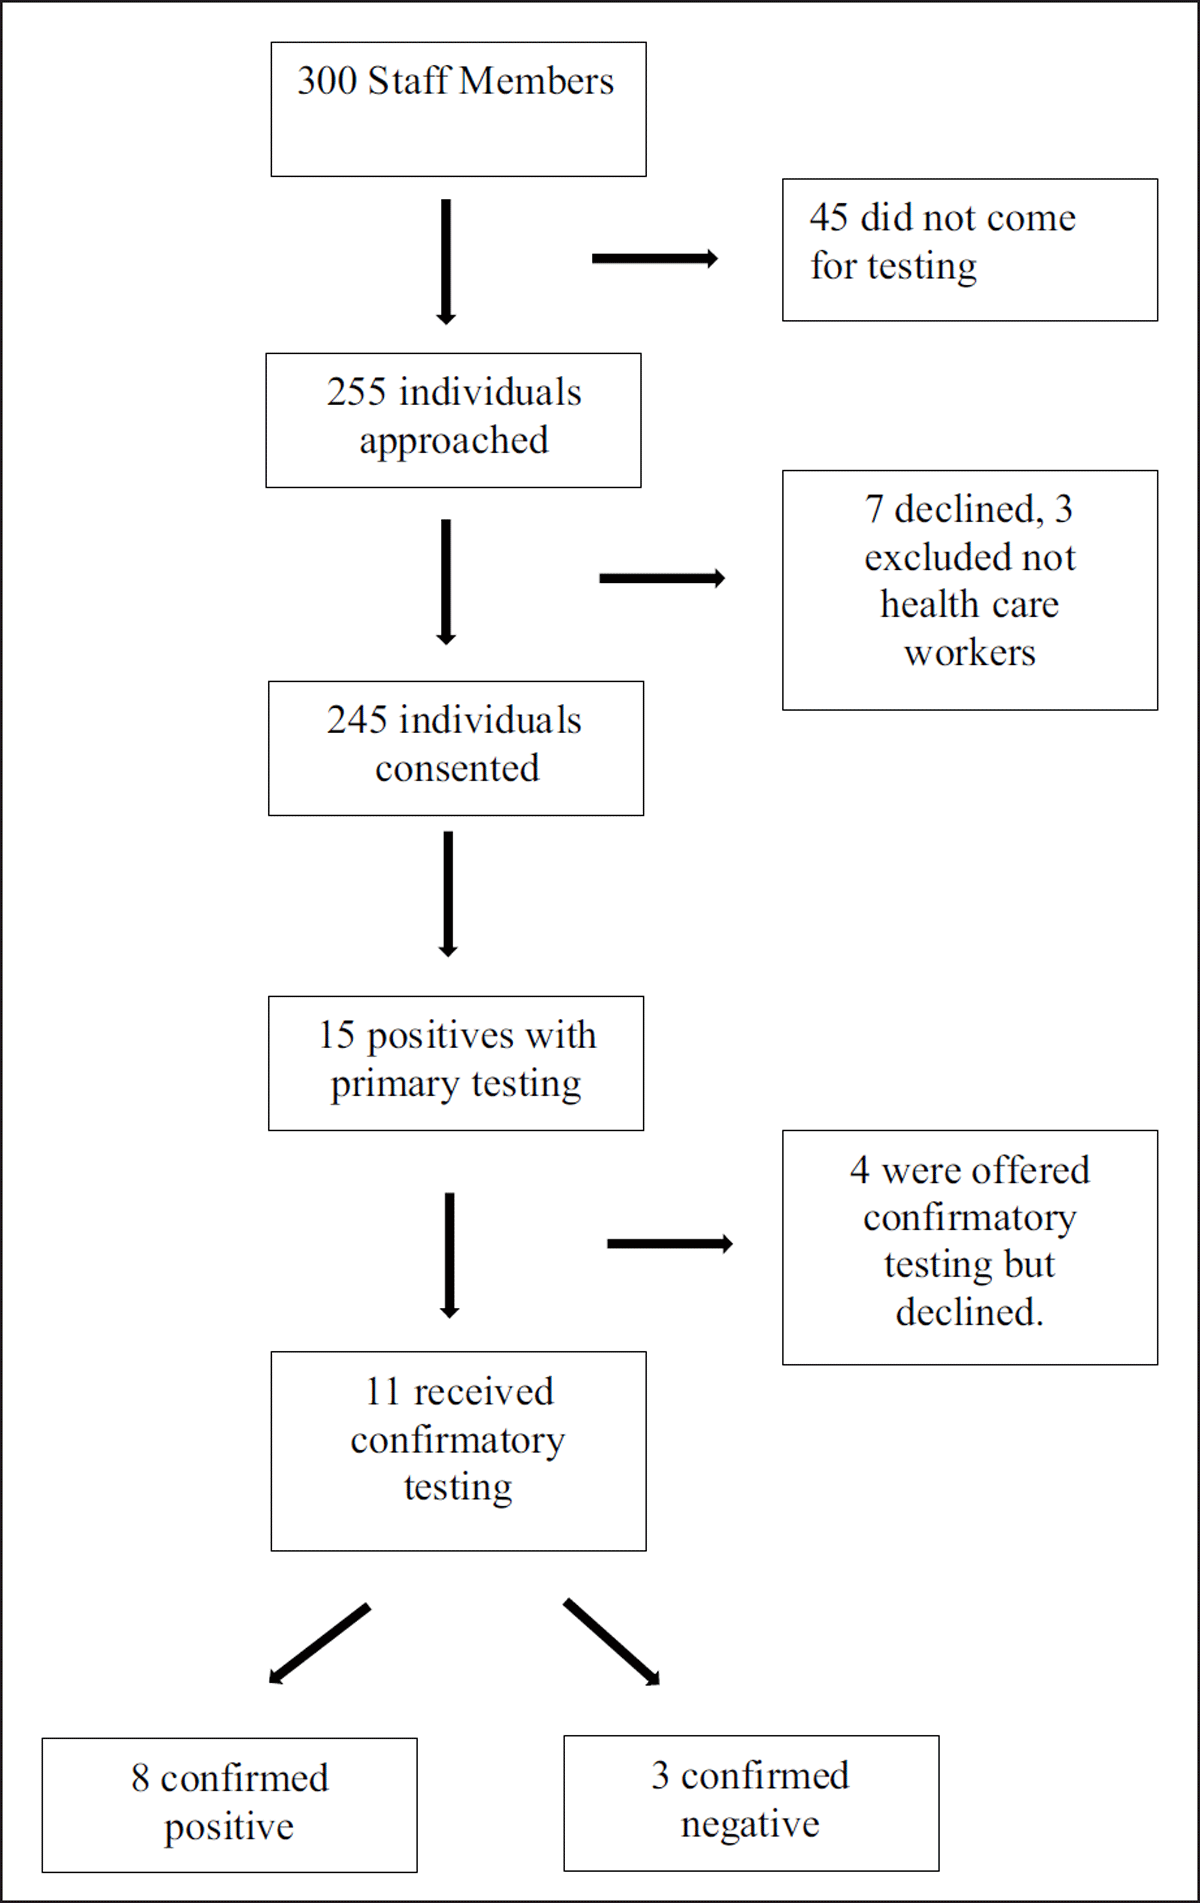
Figure 1
Flow Diagram.
Table 2
Characteristics of the hepatitis B positive population.
| VARIABLE | ALL (n = 12) |
|---|---|
| County of Residence | |
| Bong | 2 (16.67%) |
| Montserrado | 9 (75.00%) |
| Grand Kru | 1 (8.33%) |
| Religion | |
| Christian | 11 (91.67%) |
| Muslim | 1 (8.33%) |
| Type of Current Work | |
| Hospital Laundry | 1 (8.33%) |
| Hospital Transport | 1 (8.33%) |
| Medical Records Clerk | 1 (8.33%) |
| Medical Student | 4 (33.33%) |
| Nurse | 2 (16.67%) |
| Sell Groceries | 1 (8.33%) |
| Missing | 2 (16.67%) |
| Education | |
| High School | 2 (16.67%) |
| Higher Education | 9 (75.00%) |
| None | 1 (8.33%) |
| Stuck with Needle or Sharp | |
| No | 8 (66.67%) |
| Yes | 3 (25.00%) |
| Missing | 1 (8.33%) |
| Blood in Eyes, Nose, or Mouth | |
| No | 10 (83.33%) |
| Missing | 2 (16.67%) |
| Ever Received Blood | |
| No | 11 (91.67%) |
| Yes | 1 (8.33%) |
| Ever Had Surgery | |
| No | 9 (75.00%) |
| Yes | 3 (25.00%) |
| Ever Had Dental Work | |
| No | 9 (75.00%) |
| Yes | 3 (25.00%) |
| Liver Problems | |
| No | 7 (58.33%) |
| Yes | 5 (41.67%) |
| Family History of Liver Disease | |
| No | 8 (66.67%) |
| Yes | 4 (33.33%) |
| Ebola Survivor | |
| No | 12 (100.00%) |
| Alcohol Use | |
| No | 8 (66.67%) |
| Yes | 4 (33.33%) |
| Any Piercings | |
| No | 8 (66.67%) |
| Yes | 4 (33.33%) |
| Any Tattoos | |
| No | 9 (75.00%) |
| Yes | 3 (25.00%) |
| Circumcised | |
| No | 2 (16.67%) |
| Yes | 10 (83.33%) |
| Ever Shared Toothbrush or Razor | |
| No | 9 (75.00%) |
| Yes | 3 (25.00%) |
| Age First Had Sex | |
| ≤18 | 7 (58.33%) |
| >18 Missing | 3 (25.00%) 16.67%) |
| Number of Lifetime Sex Partners | |
| 1–5 | 6 (50.00%) |
| 6–10 | 1 (8.33%) |
| 11–15 | 1 (8.33%) |
| > 15 | 3 (25.00%) |
| Missing | 1 (8.33%) |
| Sex with >1 Person in Last 6 Months | |
| No | 8 (66.67%) |
| Yes | 4 (33.33%) |
| Ever Had Anal Sex | |
| No | 11 (91.67%) |
| Missing | 1 (8.33%) |
| Ever Had Sex with Ill Person | |
| No | 10 (83.33%) |
| Yes | 1 (8.33%) |
| Missing | 1 (8.33%) |
| Ever Had STI | |
| No | 4 (33.33%) |
| Yes | 8 (66.67%) |
| Ever Tested for HIV | |
| No | 4 (33.33%) |
| Yes | 8 (66.67%) |
| Tested HIV Positive | |
| No | 8 (66.67%) |
| Missing | 4 (33.33%) |
| Ever Used Drugs | |
| No | 11 (91.67%) |
| Missing | 1 (8.33%) |
| Any Sexual Partners Used Drugs | |
| No | 11 (91.67%) |
| Yes | 1 (8.33%) |
| Ever Injected Unprescribed Drugs | |
| No | 11 (91.67%) |
| Yes | 1 (8.33%) |
| Even Been in Jail | |
| No | 10 (83.33%) |
| Yes | 1 (8.33%) |
| Missing | 1 (8.33%) |