
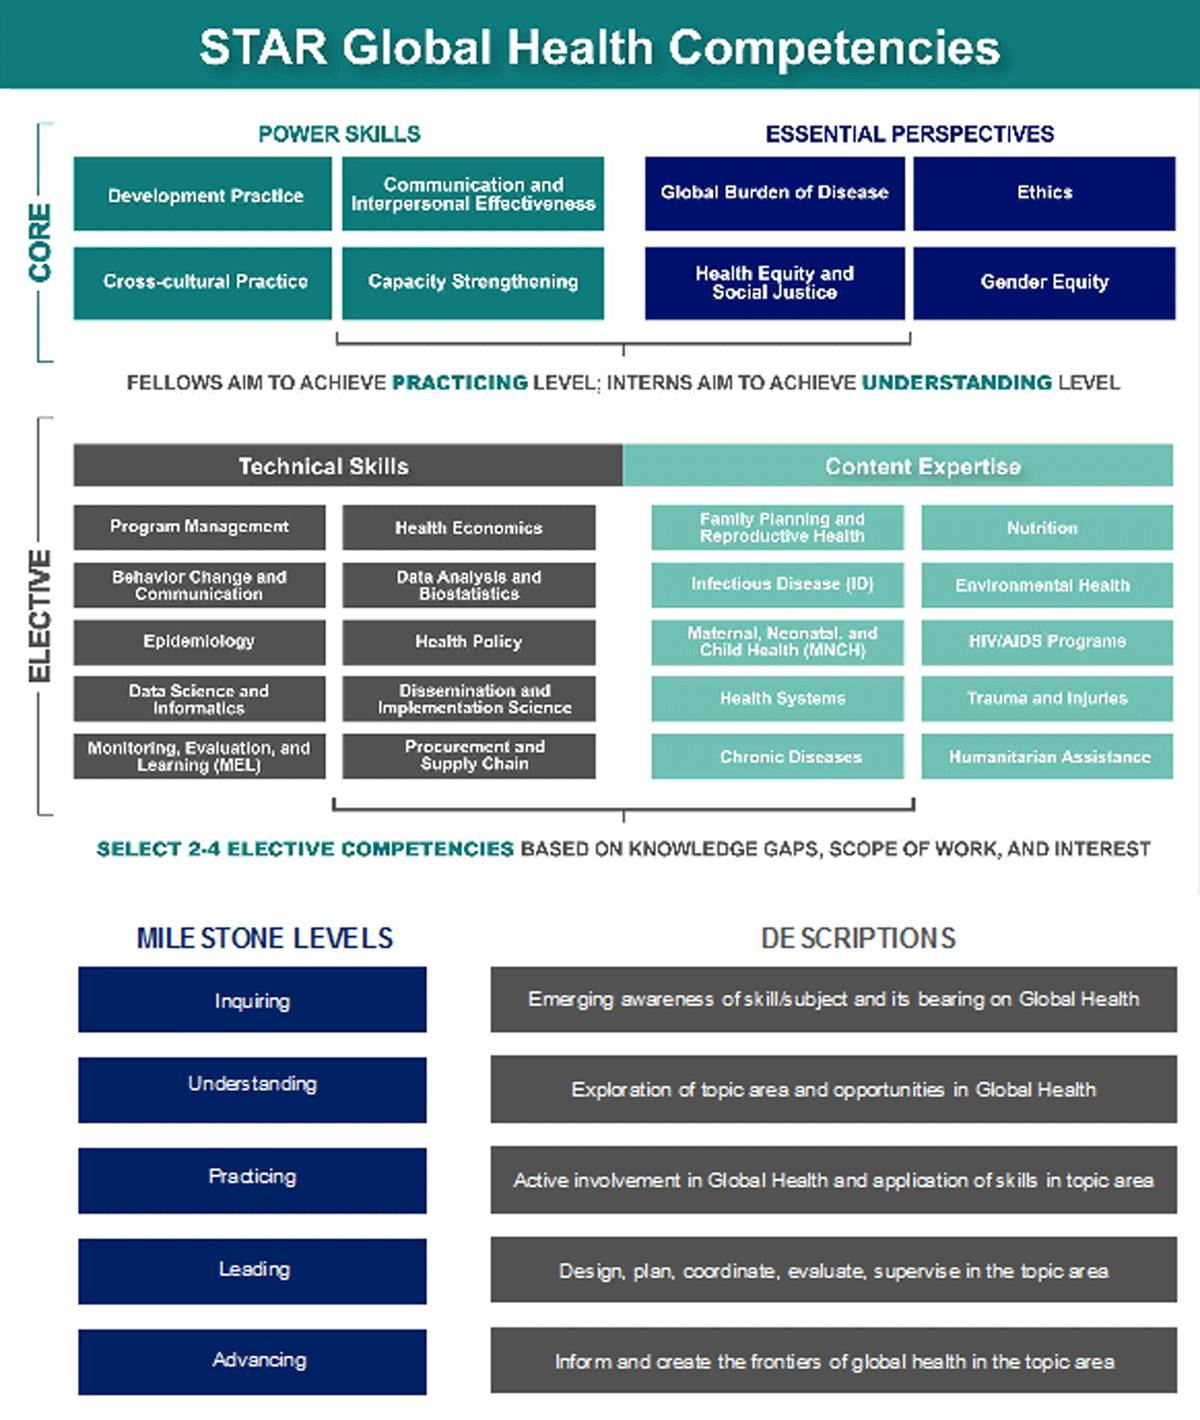
Figure 1
STAR Global Health Competencies and milestones.
Table 1
STAR participant characteristics & demographic information by participant category.
| INTERNS (n = 38) | US-BASED FELLOWS (n = 17) | LMIC-BASED FELLOWS (n = 19) | TOTAL (N = 74) | |
|---|---|---|---|---|
| Gender | ||||
| Male | 6 (15.8%) | 7 (41.2%) | 15 (79.0%) | 28 (37.8%) |
| Female | 32 (84.2%) | 10 (58.8%) | 4 (21.0%) | 46 (62.2%) |
| Degree Categories | ||||
| Bachelor | 6 (15.8%) | 1 (5.9%) | 2 (10.5%) | 9 (12.2%) |
| Master of Public/Global Health | 28 (73.7%) | 3 (17.6%) | 3 (15.8%) | 34 (45.9%) |
| Master of Education | 0 (0.0%) | 1 (5.9%) | 0 (0.0%) | 1 (1.3%) |
| PhD | 0 (0.0%) | 4 (23.5%) | 0 (0.0%) | 4 (5.4%) |
| Medical Degree | 1 (2.6%) | 5 (29.4%) | 7 (36.8%) | 13 (17.6%) |
| Miscellaneous | 3 (7.9%) | 3 (17.6%) | 6 (31.6%) | 12 (16.2%) |
| Unknown | 0 (0.0%) | 0 (0.0%) | 1 (5.3%) | 1 (1.3%) |
| Professional Experience | ||||
| <10 years | 37 (97.4%) | 4 (23.5%) | 3 (15.8%) | 44 (59.5%) |
| ≥10 years | 1 (2.6%) | 13 (76.5%) | 16 (84.2%) | 30 (40.5%) |
| Previous Development or Aid Experience | ||||
| None | 21 (55.3%) | 1 (5.9%) | 2 (10.5%) | 24 (32.4%) |
| <5 years | 14 (36.8%) | 3 (17.6%) | 3 (15.8%) | 20 (27.0%) |
| ≥5 years | 3 (7.9%) | 13 (76.5%) | 12 (63.2%) | 28 (37.8%) |
| Unknown | 0 (0.0%) | 0 (0.0%) | 2 (10.5%) | 2 (2.7%) |
| Optional Skill Competencies* | ||||
| Project Management | 3 (7.9%) | 6 (35.3%) | 6 (31.6%) | 15 (20.3%) |
| Health Economics | 1 (2.6%) | 0 (0.0%) | 2 (10.5%) | 3 (4.0%) |
| BCC^ | 7 (18.4%) | 2 (11.8%) | 2 (10.5%) | 11 (14.9%) |
| Data Anal. & Biostat. | 10 (26.3%) | 4 (23.5%) | 2 (10.5%) | 16 (21.6%) |
| Epidemiology | 7 (18.4%) | 0 (0.0%) | 2 (10.5%) | 9 (12.2%) |
| Health Policy | 6 (15.8%) | 2 (11.8%) | 2 (10.5%) | 10 (13.5%) |
| Data Sci. & Inform. | 3 (7.9%) | 1 (5.9%) | 3 (15.8%) | 7 (9.5%) |
| Diss. & Implement. Sci. | 3 (7.9%) | 4 (23.5%) | 4 (21.0%) | 11 (14.9%) |
[i] * STAR participants were able to select more than one competency.
^ BCC = Behavior Change & Communication. Data Anal. & Biostat. = Data Analysis & Biostatistics. Data Sci & Inform. = Data Science & Informatics. Diss. & Implement. Sci. = Dissemination & Implementation Science.
Table 2
STAR participant milestones level, across the eight core competency levels by participant category.
| LEARNER CLASSIFICATION | INQUIRING | UNDERSTANDING | PRACTICING | LEADING | ADVANCING | CHI SQUARED (p-VALUE) |
|---|---|---|---|---|---|---|
| DEVELOPMENT PRACTICE | ||||||
| Intern | 3 (7.9%) | 28 (73.7%) | 7 (18.4%) | 0 (0.0%) | 0 (0.0%) | <0.001* |
| US-F | 0 (0.0%) | 4 (23.5%) | 6 (35.3%) | 6 (35.3%) | 1 (5.9%) | |
| LMIC-F | 2 (10.5%) | 10 (52.6%) | 6 (31.6%) | 0 (0.0%) | 1 (5.3%) | |
| Total | 5 (6.8%) | 42 (56.8%) | 19 (25.7%) | 6 (8.1%) | 2 (2.7%) | |
| COMMUNICATION & INTERPERSONAL EFFECTIVENESS | ||||||
| Intern | 2 (5.3%) | 22 (57.9%) | 14 (36.8%) | 0 (0.0%) | 0 (0.0%) | <0.001* |
| US-F | 0 (0.0%) | 0 (0.0%) | 6 (35.3%) | 10 (58.8%) | 1 (5.9%) | |
| LMIC-F | 0 (0.0%) | 0 (0.0%) | 16 (84.2%) | 2 (10.5%) | 1 (5.3%) | |
| Total | 2 (2.7%) | 22 (29.7%) | 36 (48.7%) | 12 (16.2%) | 2 (2.7%) | |
| CROSS-CULTURAL PRACTICE | ||||||
| Intern | 6 (15.8%) | 24 (63.2%) | 8 (21.0%) | 0 (0.0%) | 0 (0.0%) | <0.001* |
| US-F | 0 (0.0%) | 1 (5.9%) | 4 (23.5%) | 10 (58.8%) | 2 (11.8%) | |
| LMIC-F | 0 (0.0%) | 4 (21.0%) | 12 (63.2%) | 3 (15.8%) | 0 (0.0%) | |
| Total | 6 (8.1%) | 29 (39.2%) | 24 (32.4%) | 13 (17.6%) | 2 (2.7%) | |
| CAPACITY STRENGTHENING | ||||||
| Intern | 9 (23.7%) | 23 (60.5%) | 6 (15.8%) | 0 (0.0%) | 0 (0.0%) | <0.001* |
| US-F | 0 (0.0%) | 1 (5.9%) | 11 (64.7%) | 4 (23.5%) | 1 (5.9%) | |
| LMIC-F | 0 (0.0%) | 0 (0.0%) | 7 (36.8%) | 12 (63.2%) | 0 (0.0%) | |
| Total | 9 (12.2%) | 24 (32.4%) | 24 (32.4%) | 16 (21.6%) | 1 (1.4%) | |
| GLOBAL BURDEN OF DISEASE | ||||||
| Intern | 5 (13.2%) | 27 (71.0%) | 6 (15.8%) | 0 (0.0%) | 0 (0.0%) | <0.001* |
| US-F | 0 (0.0%) | 1 (5.9%) | 6 (35.3%) | 8 (47.1%) | 2 (11.8%) | |
| LMIC-F | 0 (0.0%) | 2 (10.5%) | 11 (57.9%) | 5 (26.3%) | 1 (5.3%) | |
| Total | 5 (6.8%) | 30 (40.5%) | 23 (31.1%) | 13 (17.6%) | 3 (4.0%) | |
| ETHICS | ||||||
| Intern | 8 (21.1%) | 29 (76.3%) | 1 (2.6%) | 0 (0.0%) | 0 (0.0%) | <0.001* |
| US-F | 0 (0.0%) | 6 (35.3%) | 7 (41.2%) | 4 (23.5%) | 0 (0.0%) | |
| LMIC-F | 3 (15.8%) | 8 (42.1%) | 8 (42.1%) | 0 (0.0%) | 0 (0.0%) | |
| Total | 11 (14.9%) | 43 (58.1%) | 16 (21.6%) | 4 (5.4%) | 0 (0.0%) | |
| HEALTH EQUALITY & SOCIAL JUSTICE | ||||||
| Intern | 7 (18.4%) | 23 (60.5%) | 8 (21.1%) | 0 (0.0%) | 0 (0.0%) | 0.001** |
| US-F | 1 (5.9%) | 3 (17.7%) | 9 (52.9%) | 4 (23.5%) | 0 (0.0%) | |
| LMIC-F | 1 (5.3%) | 6 (31.6%) | 11 (57.9%) | 1 (5.3%) | 0 (0.0%) | |
| Total | 9 (12.2%) | 32 (43.2%) | 28 (37.8%) | 5 (6.8%) | 0 (0.0%) | |
| GENDER EQUITY | ||||||
| Intern | 3 (7.9%) | 28 (73.7%) | 7 (18.4%) | 0 (0.0%) | 0 (0.0%) | <0.001* |
| US-F | 0 (0.0%) | 4 (23.5%) | 6 (35.3%) | 6 (35.3%) | 1 (5.9%) | |
| LMIC-F | 2 (10.5%) | 10 (52.6%) | 6 (31.6%) | 0 (0.0%) | 1 (5.3%) | |
| Total | 5 (6.8%) | 42 (56.8%) | 19 (25.7%) | 6 (8.1%) | 2 (2.7%) | |
[i] Cells in italic signify the highest value.
Cells in bold signify the lowest value.
* Designates significance at the p < 0.001 level.
** Designates significance at the p < 0.05 level.
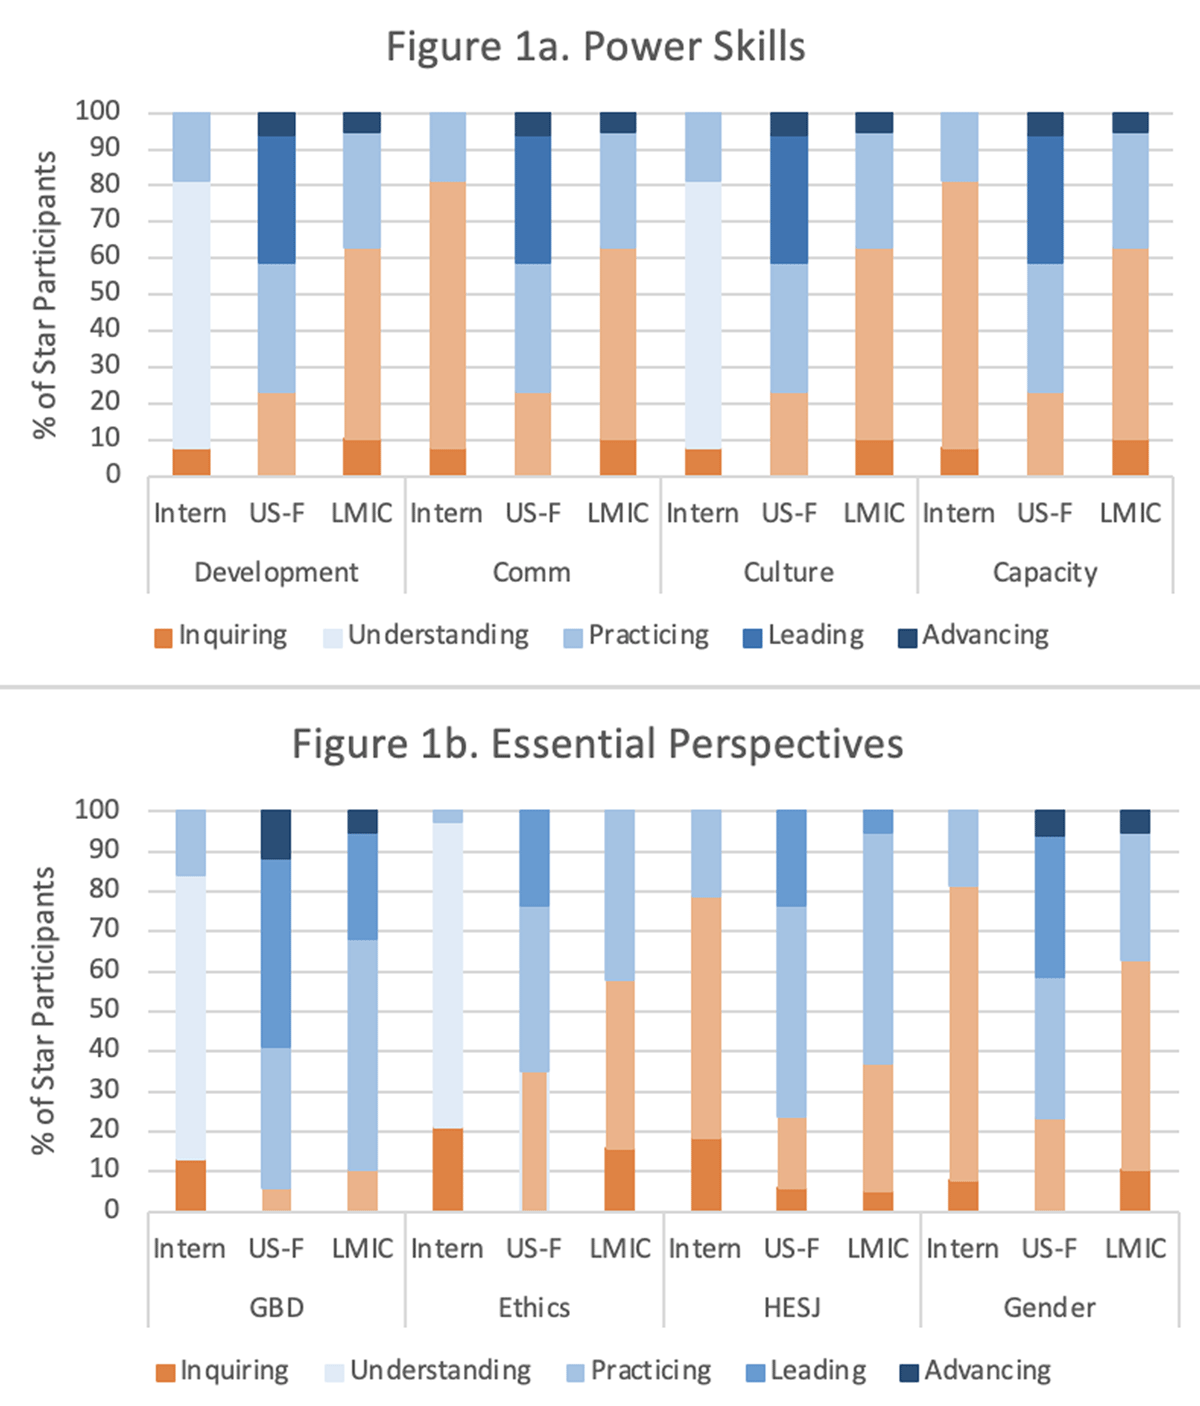
Figure 2
STAR participant milestones level, across the eight core competency levels by participant category*.
*Shades of orange indicate proportions of STAR participants that had deficits (as defined by the program—minimum of “understanding” level for interns and minimum of “practicing” for fellow) at baseline. Shades of blue indicate adequate skill levels as defined for each type of participant; darker blue indicates higher skill levels, with the darkest blue indicating “advancing” level.