
Table 1
Qualitative demographic data of the subjects (n = 47).
| VARIABLES | FREQUENCY | PERCENT | |
|---|---|---|---|
| Sex | Female | 14 | 30 |
| 33 | 70 | ||
| Marital Status | Single | 16 | 34 |
| Married | 31 | 66 | |
| Education | Diploma | 6 | 69.6 |
| Associate Degree | 8 | 17.4 | |
| Bachelor’s Degree and higher | 33 | 13 | |
| Number of Children | 0 | 29 | 61 |
| 1 | 12 | 26 | |
| 2 and more | 16 | 13 | |
| Employment Status | Official | 0 | 0 |
| Contractual | 0 | 0 | |
| Company | 47 | 100 | |
| Gender of employees in the shift system | female | 33 | 100 |
| 13 | 93 | ||
| Symptoms of Musculoskeletal Disorders | Daily | 10 | 21.7 |
| Weekly | 14 | 30.4 | |
| Monthly | 12 | 39.1 | |
| Annually | 11 | 7.8 | |
| Duration of Musculoskeletal Disorders | No day | 0 | 0 |
| One to seven days | 30 | 65 | |
| Eight to thirty days | 0 | 0 | |
| More than thirty days | 6 | 13 | |
| Everyday | 11 | 22 | |
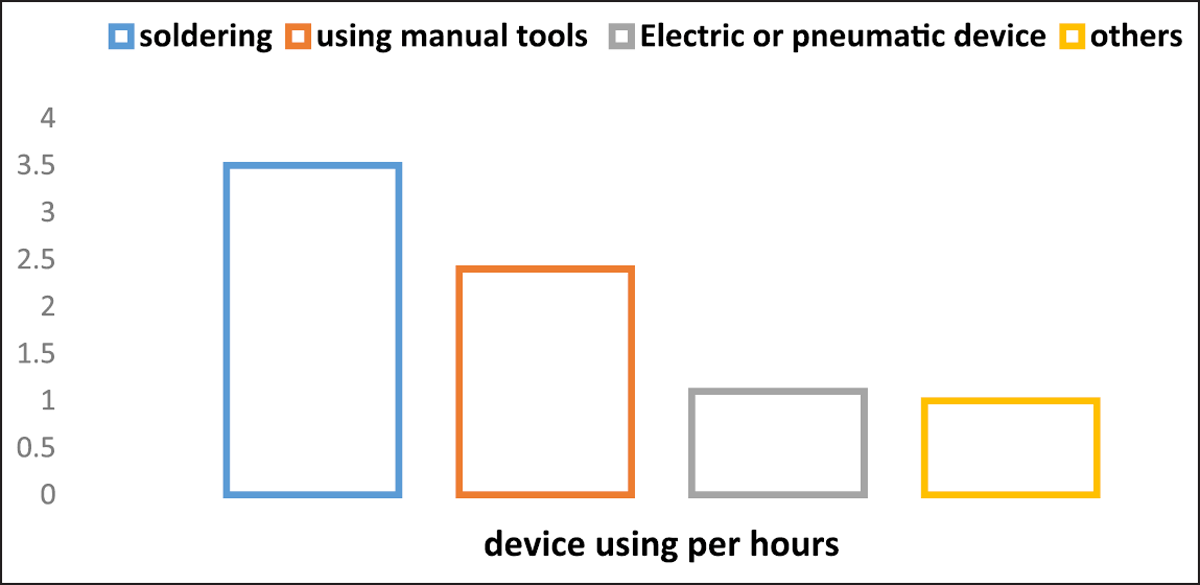
Figure 1
Time analysis of assembly job.
Table 2
Comments received from the groups in order of priority.
| ROW | COMMENTS |
|---|---|
| 1 | Desk design tailored to people’s jobs. |
| 2 | Ergonomic chair design. |
| 3 | Reduce work stress and organizational pressures from managers. |
| 4 | Embedding space on the desk for personal items. |
| 5 | Provide adequate lighting. |
| 6 | Install high-efficiency and silent ventilation. |
| 7 | Proper footrest design. |
| 8 | Design of colored and standard tools. |
| 9 | Providing personal wardrobes for bags and personal items. |
[i] * Note: The sentences are summarized and standardized as much as possible.
Table 3
Variables required for workstation Design.
| DIMENSIONS | VARIABLE SIZE (cm) |
|---|---|
| Sitting depth | 33.24 |
| Sitting width | 42.00 |
| Height of forearm support | 28.49 |
| Lateral space of the foot | 64.00 |
| Foot vertical space | 69.99 |
| Front foot space | 68.02 |
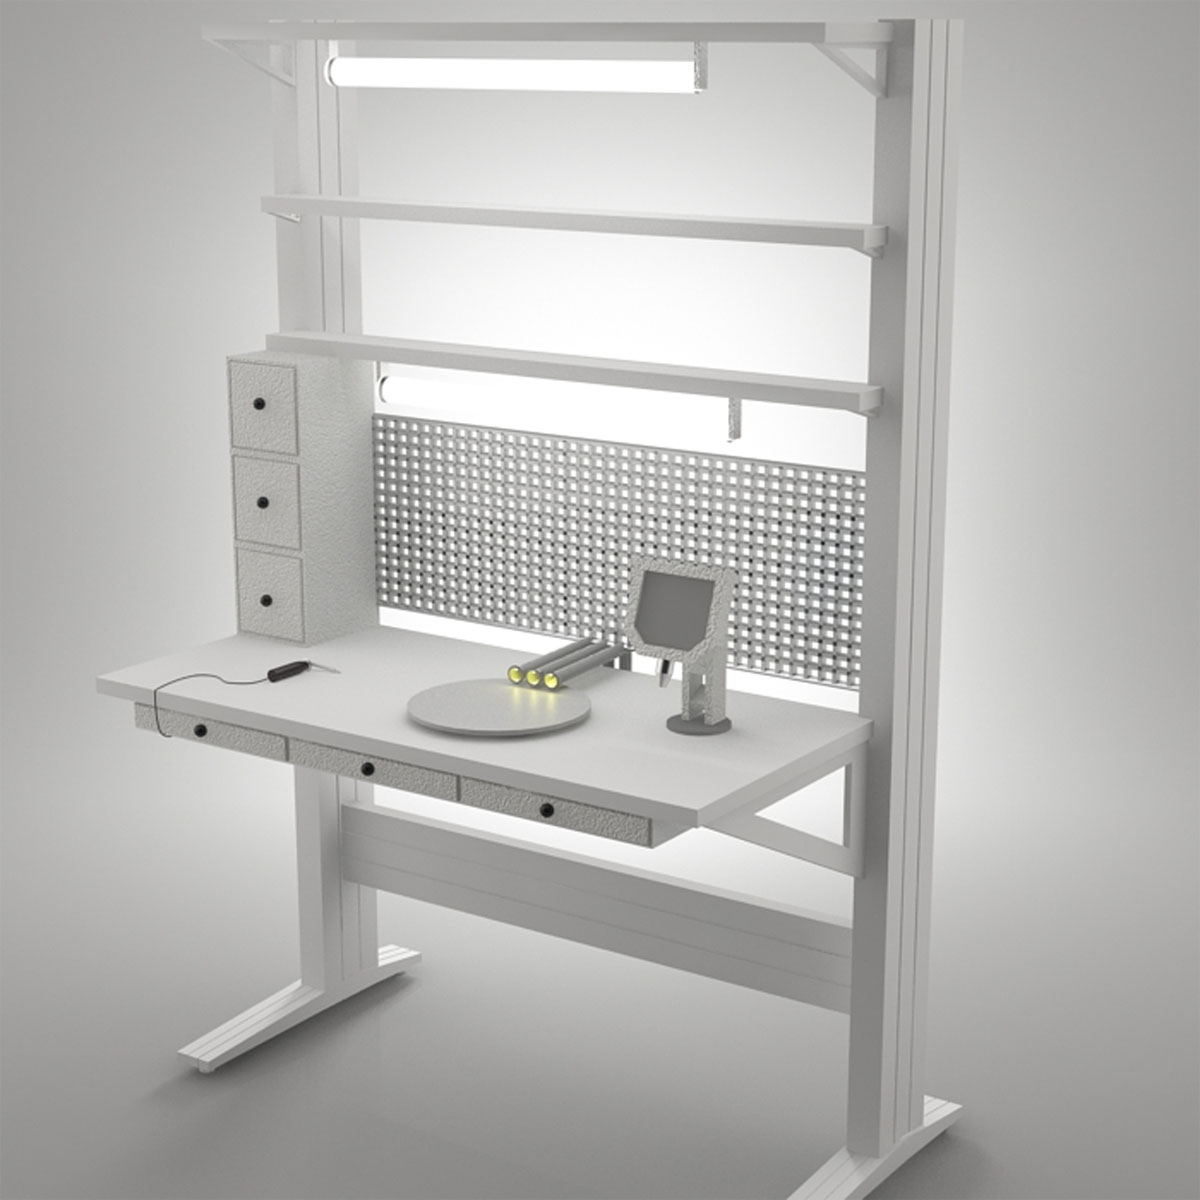
Figure 2
Full view of the proposed workbench for assemblers (in this image, a sample of ventilation along with lighting is also suggested and designed).
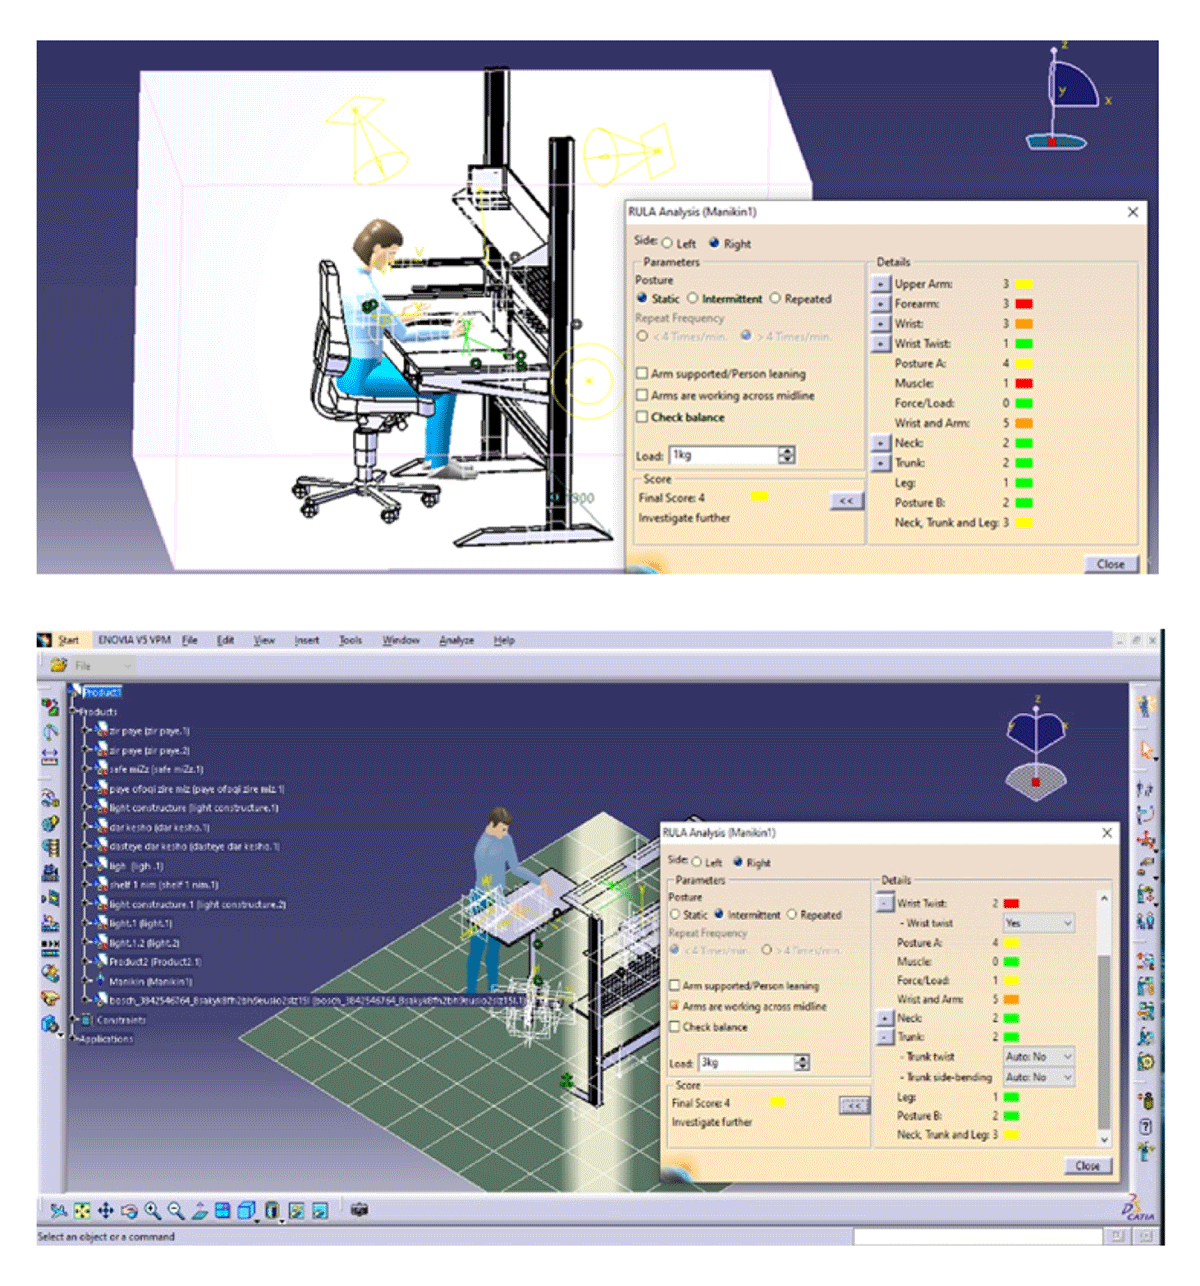
Figure 3
An example of how RULA is reported in CATIA.
Table 4
Comparison of RULA scores from Kinect and CATIA.
| BODY AREAS | RULAfromCATIA | RULAfromKINECT | *P-VALUE | |
|---|---|---|---|---|
| MIDDLE (INTERMEDIATE RANGE) | MIDDLE (INTERMEDIATE RANGE) | |||
| Arms | (5–3) 4 | (1–1) 1 | 0.005 | |
| Forearms | (2–1) 1 | (2–3) 2 | 0.015 | |
| Wrist | (1.75–2.75) 2 | (4–3) 4 | 0.011 | |
| Neck | (3–2) 5/2 | (4–1) 3 | 0.569 | |
| Foot and Trunk | (1.75–2) 2 | (6–5) 5.5 | 0.005 | |
| Final Score | (3–2.75) 3 | (7–5) 6 | 0.004 |
[i] * Wilcoxon signed-rank test.
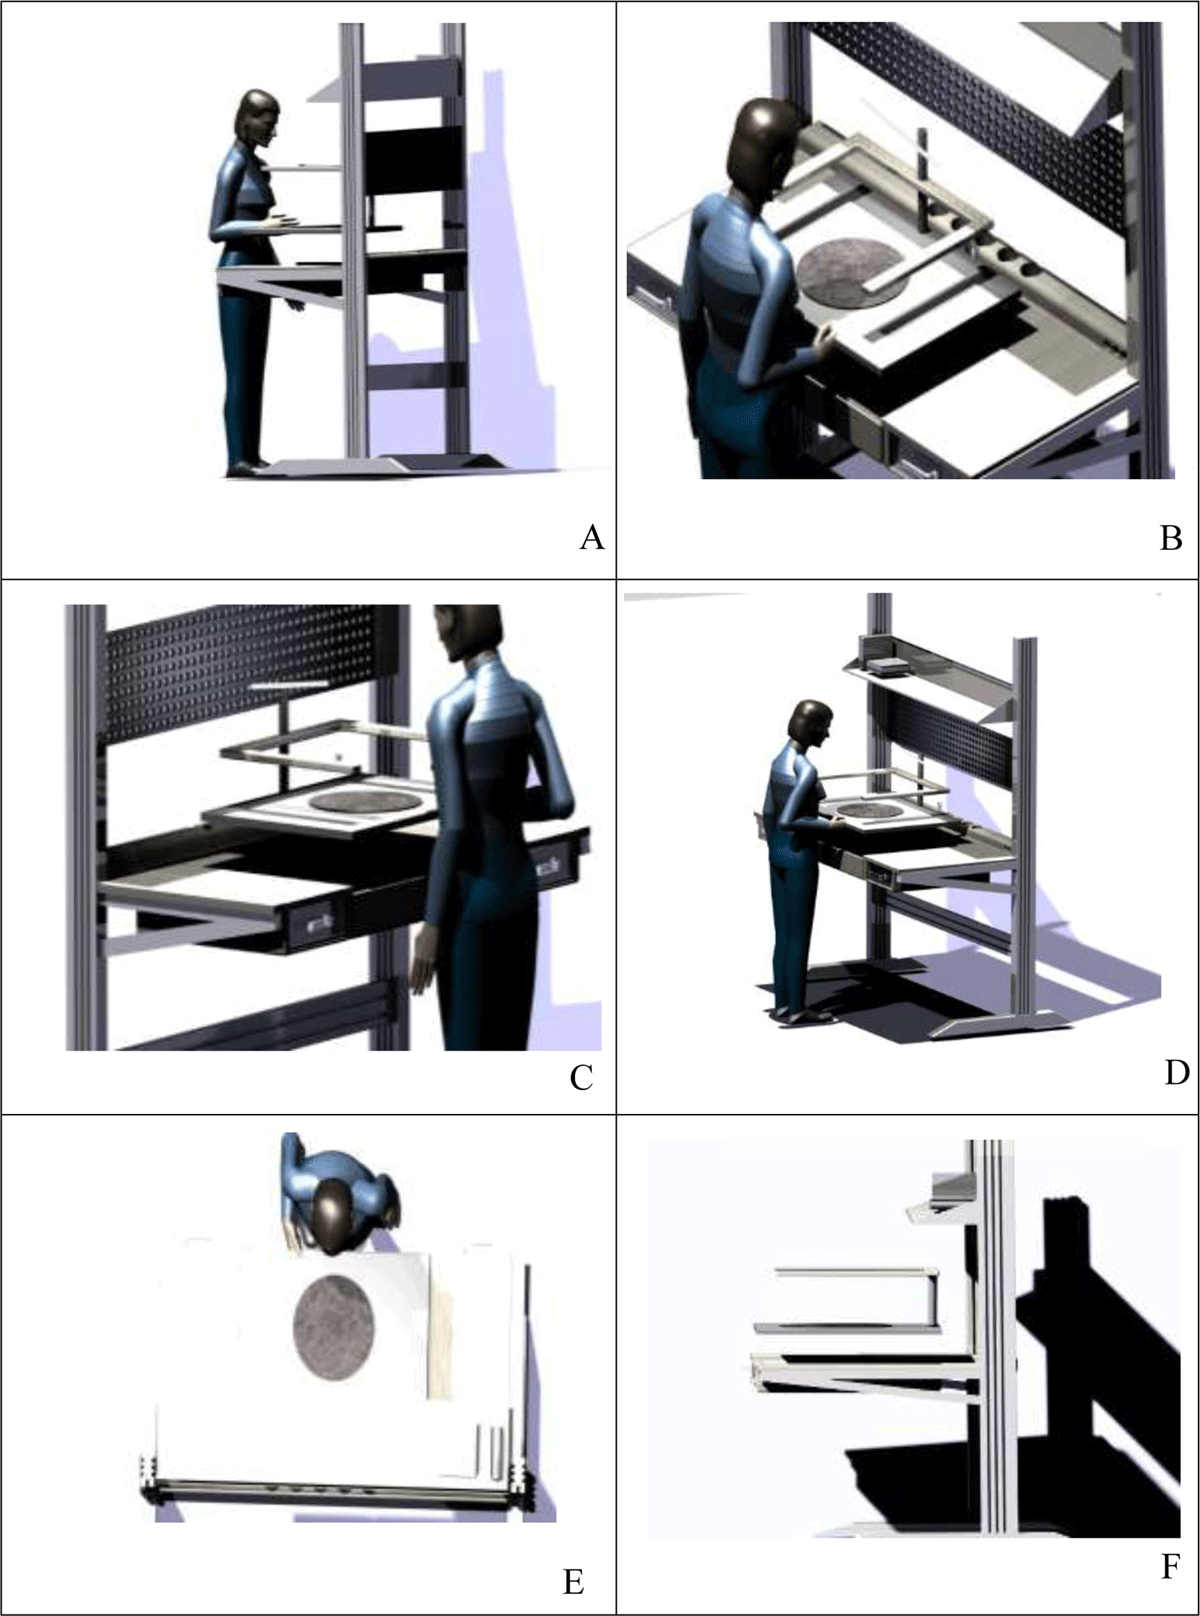
Figure 4
Different views of the proposed design for the lightweight assembly plant.
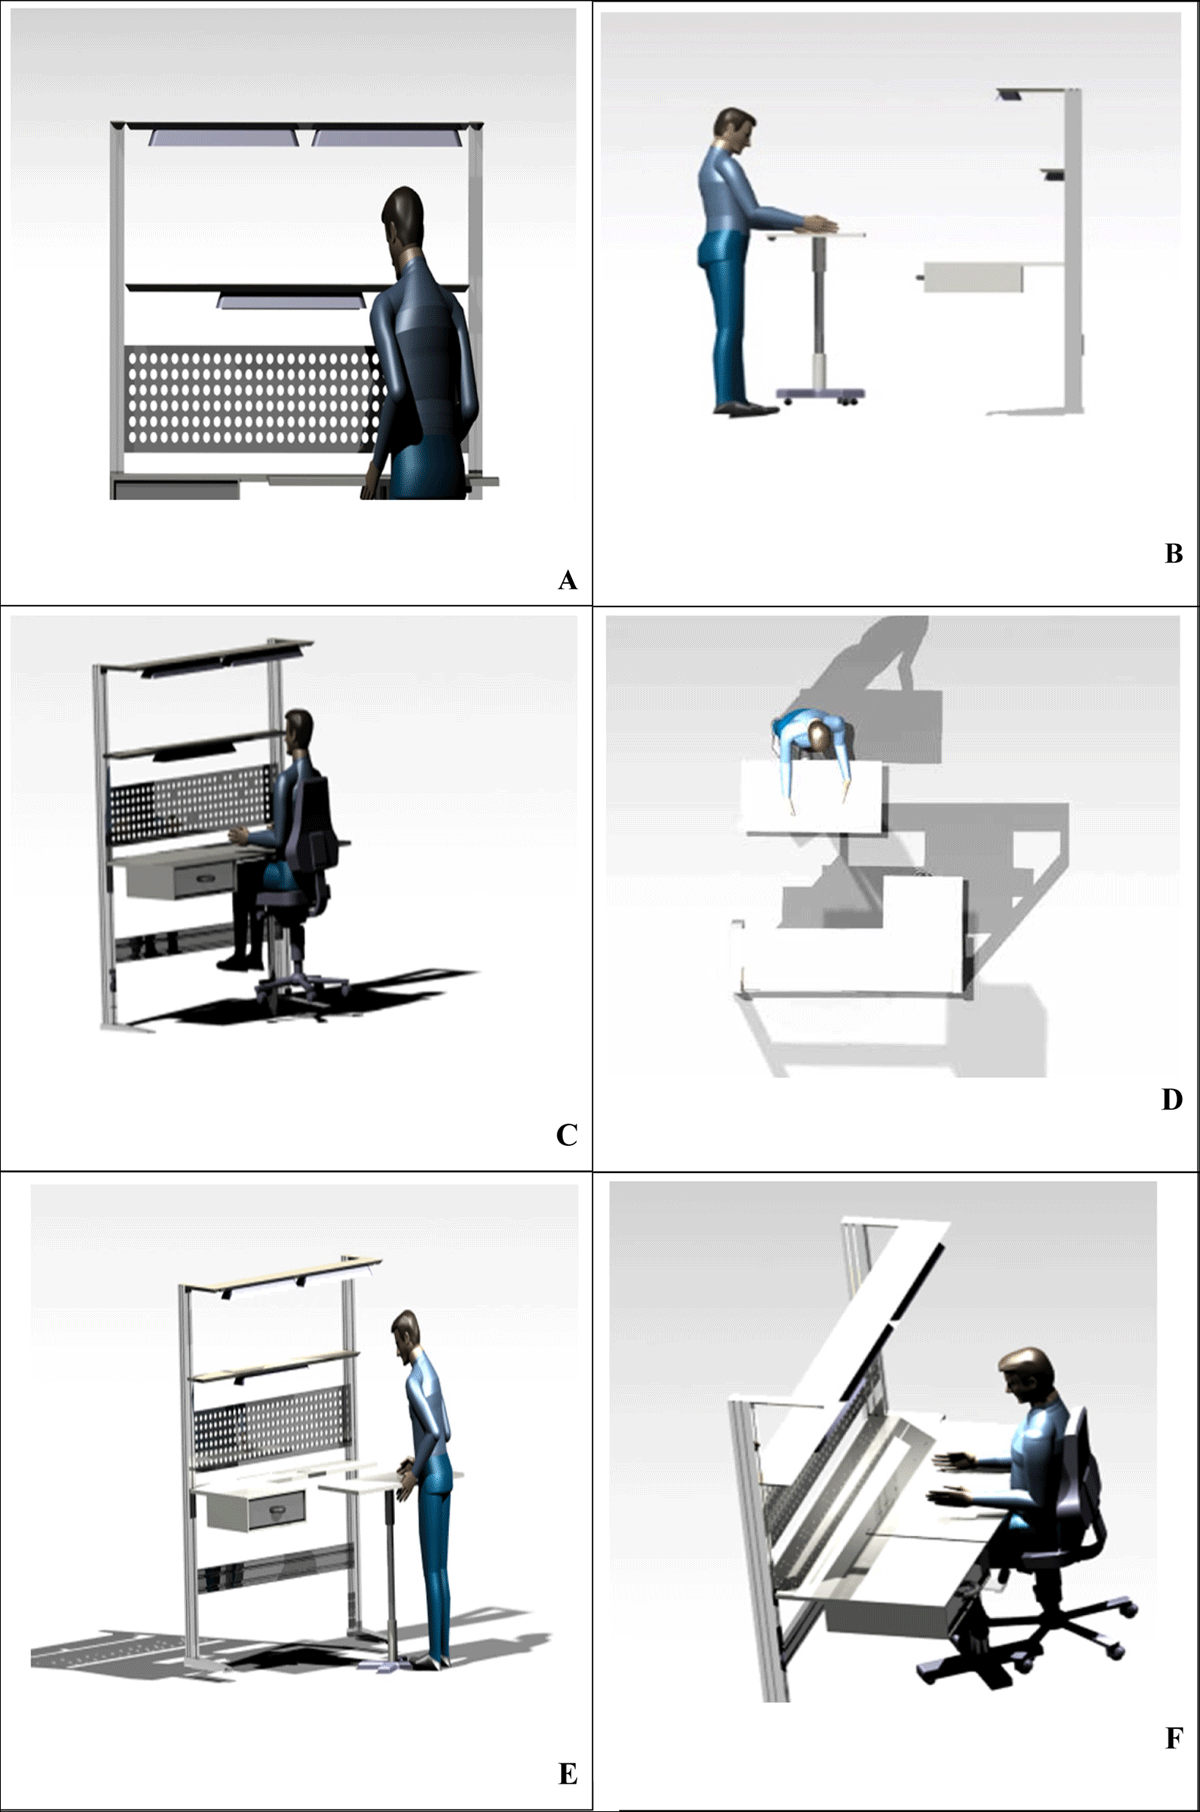
Figure 5
Different views of the proposed design for the heavy assembly workstation.