
Table 1
Tsimane sample composition and distribution of AF risk factors. Standard deviations and standard errors are given in parentheses (for means and proportions, respectively). Significance column provides p-values for testing differences across age groups based on ANOVA.
| AGE GROUP (YEARS) | N | 39–49 | 50–59 | 60–69 | 70–79 | ≥ 80 | TOTAL | SIGNIFICANCE |
|---|---|---|---|---|---|---|---|---|
| N with baseline ECG | 670 | 328 | 204 | 90 | 22 | 1314 | ||
| Proportion Male | 0.52 | 0.51 | 0.55 | 0.49 | 0.36 | 0.52 | ||
| Anthropometric measures | ||||||||
| Height cm | 1307 | 157.0 (7.2) | 155.8 (7.7) | 155.1 (7.4) | 151.6 (7.9) | 149.9 (6.2) | 155.9 (7.5) | <0.001 |
| Weight kg | 1307 | 60.4 (9.6) | 58.4 (10.3) | 56.3 (9.4) | 53.2 (8.7) | 47.8 (7.9) | 58.5 (10.0) | <0.001 |
| BMI kg/m2 | 1306 | 24.4 (3.1) | 24.0 (3.6) | 23.3 (3.1) | 23.1 (3.4) | 21.2 (2.2) | 24.0 (3.3) | <0.001 |
| % BMI > 30 kg/m2 | 1306 | 5.0 (0.8) | 5.2 (1.2) | 3.5 (1.3) | 4.4 (2.2) | 0.0 (0.0) | 4.7 (0.6) | 0.362 |
| Waist Circ. in | 1049 | 34.9 (3.3) | 35.0 (4.1) | 35.2 (3.7) | 35.6 (4.0) | 33.5 (2.4) | 35.0 (3.6) | 0.732 |
| % Waist Circ. High | 1049 | 24.6 (1.9) | 26.0 (2.7) | 31.1 (3.7) | 25.0 (5.3) | 5.9 (5.9) | 25.6 (1.4) | 0.938 |
| Lipid profiles | ||||||||
| Total Cholesterol mg/dL | 1112 | 142.9 (27.6) | 146.8 (30.6) | 140.9 (26.9) | 137.8 (27.6) | 139.6 (26.5) | 143.3 (28.4) | 0.064 |
| % Cholesterol > 240 mg/dL | 1112 | 0.35 (0.25) | 0.68 (0.48) | 0.0 (0.0) | 0.0 (0.0) | 0.0 (0.0) | 0.36 (0.18) | 0.498 |
| LDL mg/dL | 1032 | 86.6 (25.7) | 89.7 (27.9) | 85.0 (25.6) | 80.3 (25.3) | 82.5 (21.7) | 86.7 (26.2) | 0.045 |
| % LDL > 130 mg/dL | 1032 | 5.28 (0.97) | 6.77 (1.54) | 4.52 (1.67) | 5.97 (2.92) | 0.00 (0.00) | 5.52 (0.71) | 0.714 |
| HDL mg/dL | 1035 | 37.2 (7.5) | 38.0 (6.7) | 37.1 (6.4) | 38.0 (7.6) | 37.1 (9.6) | 37.5 (7.2) | 0.045 |
| Triglycerides mg/dL | 1117 | 109.0 (46.9) | 113.9 (52.7) | 106.1 (45.9) | 105.9 (41.0) | 105.6 (22.6) | 109.6 (47.8) | 0.519 |
| % Triglycerides > 200 mg/dL | 1117 | 4.20 (0.84) | 4.76 (1.24) | 4.29 (1.59) | 1.37 (1.37) | 0.00 (0.00) | 4.12 (0.59) | 0.289 |
| Inflammatory Markers | ||||||||
| hs-CRP mg/dL | 758 | 2.4 (1.8) | 2.6 (2.3) | 3.1 (2.3) | 2.3 (1.6) | 4.4 (2.7) | 2.6 (2.0) | <0.001 |
| % hs-CRP > 3 mg/dL | 758 | 37.0 (2.5) | 42.9 (3.4) | 53.8 (4.6) | 45.5 (7.6) | 66.7 (14.2) | 42.2 (1.8) | <0.001 |
| ESR mm/h | 1304 | 27.1 (15.1) | 30.3 (15.1) | 38.8 (20.9) | 43.7 (22.3) | 58.4 (19.0) | 31.4 (17.9) | <0.001 |
| % Elevated ESR | 1304 | 45.6 (1.9) | 59.3 (2.7) | 72.3 (3.2) | 76.4 (4.5) | 95.5 (4.6) | 56.1 (1.4) | <0.001 |
| IL6 (pm/mL) | 740 | 1.6 (0.7) | 1.6 (0.5) | 1.6 (0.9) | 1.6 (1.6) | 1.5 (1.3) | 1.6 (0.8) | <0.001 |
| Blood Pressure and Hypertension | ||||||||
| Heart Rate (BPM) | 1314 | 51.1 (26.0) | 48.1 (27.6) | 49.2 (28.4) | 55.9 (29.5) | 57.6 (26.4) | 50.5 (27.1) | 0.640 |
| Systolic Blood Pressure mmHg | 1305 | 111.1 (8.0) | 114.4 (10.2) | 118.0 (12.7) | 121.9 (16.4) | 121.5 (24.0) | 113.9 (11.1) | <0.001 |
| % SBP > 120 mmHg | 1305 | 11.3 (1.2) | 19.9 (2.2) | 34.2 (3.4) | 45.6 (5.3) | 38.1 (10.9) | 19.8 (1.1) | <0.001 |
| Diastolic Blood Pressure mmHg | 1305 | 69.7 (5.8) | 70.8 (6.1) | 71.6 (7.9) | 70.8 (7.8) | 68.2 (9.8) | 70.3 (6.5) | 0.004 |
| % DBP > 80 mmHg | 1305 | 3.3 (0.7) | 6.8 (1.4) | 11.4 (2.2) | 7.8 (2.8) | 4.8 (4.8) | 5.8 (0.6) | 0.002 |
| % Hypertensive (>130/80 mmHg) | 1305 | 3.8 (0.7) | 8.9 (1.6) | 20.3 (2.8) | 26.7 (4.7) | 9.5 (6.6) | 9.3 (0.8) | <0.001 |
| ECG Measures | ||||||||
| PR ms | 1312 | 162 (19) | 162 (19) | 162 (18) | 162 (20) | 160 (21) | 162 (19) | 0.990 |
| % PR > 200 ms | 1312 | 1.79 (0.5) | 2.44 (0.9) | 2.46 (1.1) | 3.37 (1.9) | 4.56 (4.6) | 2.21 (0.4) | 0.328 |
| QRS ms | 1313 | 103 (12) | 103 (12) | 104 (17) | 104 (18) | 99 (14) | 103 (14) | 0.999 |
| % QRS > 120 ms | 1313 | 7.6 (1.0) | 5.8 (1.3) | 10.3 (2.1) | 10.0 (3.2) | 4.6 (4.6) | 7.7 (0.7) | 0.316 |
| Coronary Calcium scores from CT scan | ||||||||
| % CAC > 100 AU | 823 | 0.5 (0.38) | 3.5 (1.2) | 8.5 (2.34) | 4.4 (3.1) | 30.8 (13.3) | 3.5 (0.6) | <0.001 |
[i] Note: Sample sizes vary, especially for serum biomarker analyses, due to logistical complications in the field (e.g., inability to store serum). CT sample sizes are smaller because of stratified sampling for ages 40–54.
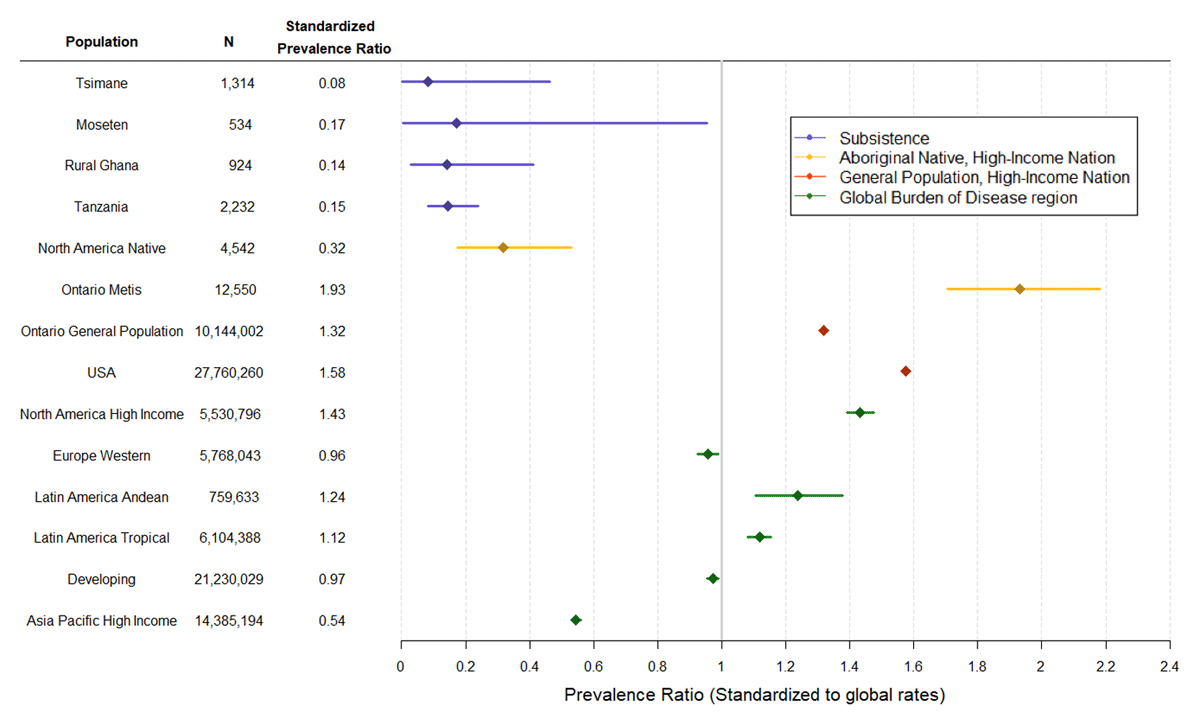
Figure 1
Age-standardized atrial fibrillation prevalence ratios, with 95% CIs. Ratios compare the observed prevalence in each population with the expected prevalence if that population had the average age-specific AF prevalences of a global GBD sample (2010 total prevalence of 1366/100,000), as reported by Chugh et al [12].
Table 2
Moseten sample composition and distribution of AF risk factors. Standard deviations are given in parentheses (for means), standard error (for proportions). “Total” column provides sample means age-standardized to Tsimane sample age distribution. Significance column provides p-values for testing differences across age groups based on ANOVA.
| AGE GROUP (YEARS) | N | 40–49 | 50–59 | 60–69 | 70–79 | ≥ 80 | TOTAL (AGE-ADJUSTED) | SIGNIFICANCE |
|---|---|---|---|---|---|---|---|---|
| N with baseline ECG | 208 | 155 | 121 | 39 | 10 | 534 | ||
| Proportion Male | 0.47 | 0.5 | 0.54 | 0.62 | 0.4 | 0.5 | ||
| Anthropometric Measures | ||||||||
| Height cm | 527 | 156.1 (7.1) | 154.8 (6.7) | 153.3 (8.0) | 151.8 (9.5) | 150.6 (7.1) | 154.8 (7.4) | <0.001 |
| Weight kg | 523 | 64.5 (12.4) | 62.6 (11.1) | 58.2 (13.0) | 58.2 (15.0) | 60.5 (9.0) | 62.4 (12.4) | <0.001 |
| BMI kg/m2 | 523 | 26.5 (5.1) | 26.1 (4.2) | 24.6 (4.7) | 25.1 (5.3) | 26.6 (3.3) | 26.0 (4.8) | 0.002 |
| % BMI > 30 kg/m2 | 523 | 21.2 (2.9) | 18.2 (3.1) | 10.2 (2.8) | 21.1 (6.7) | 10.0 (10.0) | 18.3 (1.7) | 0.088 |
| Lipid Profile | ||||||||
| Total Cholesterol mg/dL | 368 | 157.9 (30.1) | 162.4 (37.8) | 157.2 (35.2) | 161.9 (24.9) | 158.3 (34.5) | 159.2 (33.0) | 0.873 |
| % Cholesterol > 240 mg/dL | 368 | 2.9 (1.4) | 4.5 (2.0) | 2.3 (1.6) | 0.0 (0.0) | 0.0 (0.0) | 3.0 (0.9) | 0.28 |
| LDL mg/dL | 363 | 106.3 (35.7) | 108.8 (37.9) | 99.9 (35.8) | 107.3 (27.4) | 106.3 (30.3) | 105.9 (35.7) | 0.286 |
| % LDL > 130 mg/dL | 363 | 19.9 (3.4) | 24.6 (4.1) | 19.3 (4.2) | 26.1 (9.4) | 33.3 (21.1) | 21.7 (2.2) | 0.991 |
| HDL mg/dL | 363 | 37.6 (9.1) | 36.5 (9.1) | 39.2 (9.3) | 37.8 (9.1) | 35.1 (3.4) | 37.6 (9.1) | 0.193 |
| Triglycerides mg/dL | 365 | 137.9 (74.6) | 134.2 (81.1) | 113.0 (59.8) | 135.0 (71.0) | 103.1 (25.5) | 131.8 (73.2) | 0.047 |
| % Triglycerides > 200 mg/dL | 365 | 15.4 (3.1) | 15.3 (3.4) | 10.2 (3.3) | 16.7 (7.8) | 0.00 (0.00) | 14.3 (1.9) | 0.431 |
| Inflammatory Markers | ||||||||
| hs-CRP mg/dL | 109 | 2.6 (2.7) | 2.5 (2.1) | 2.9 (3.0) | 3.5 (1.9) | 7.3 (0.0) | 2.6 (2.7) | 0.315 |
| % hs-CRP > 3 mg/dL | 109 | 47.4 (8.2) | 42.1 (8.1) | 50.0 (9.3) | 50.0 (50.0) | 100.0 (NA) | 47.6 (5.9) | 0.275 |
| ESR mm/h | 449 | 29.6 (17.3) | 33.8 (20.4) | 38.5 (22.0) | 46.9 (24.1) | 39.0 (21.3) | 33.6 (19.6) | <0.001 |
| % Elevated ESR | 449 | 49.7 (3.9) | 60.2 (4.3) | 64.4 (4.7) | 84.9 (6.3) | 70.0 (15.3) | 57.8 (2.4) | <0.001 |
| IL6 (pm/mL) | 114 | 1.6 (0.3) | 1.6 (1.1) | 1.6 (0.9) | 7.8 (8.8) | 13.3 (0.0) | 1.6 (1.1) | 0.259 |
| Blood Pressure and Hypertension | ||||||||
| Heart Rate (BPM) | 533 | 64.0 (9.0) | 65.3 (9.9) | 64.4 (9.2) | 69.5 (16.1) | 67.8 (10.1) | 64.9 (10.0) | 0.019 |
| Systolic Blood Pressure mmHg | 526 | 116.9 (12.6) | 118.9 (15.9) | 125.0 (15.1) | 130.8 (16.5) | 144.8 (25.3) | 120.3 (14.5) | <0.001 |
| SBP > 120 mmHg | 526 | 35.8 (3.4) | 39.2 (4.0) | 55.4 (4.5) | 71.1 (7.5) | 90.0 (10.0) | 43.5 (2.1) | <0.001 |
| Diastolic Blood Pressure mmHg | 527 | 74.9 (10.1) | 76.8 (11.6) | 78.9 (10.2) | 81.5 (9.3) | 92.2 (15.2) | 76.9 (10.6) | <0.001 |
| % DBP > 80 mmHg | 527 | 26.5 (3.1) | 33.1 (3.8) | 39.7 (4.5) | 47.4 (8.2) | 80.0 (13.3) | 32.9 (2.0) | <0.001 |
| % Hypertensive (>130/80 mmHg) | 527 | 29.4 (3.2) | 37.0 (3.9) | 45.5 (4.6) | 55.3 (8.2) | 100.0 (0.0) | 37.3 (2.1) | <0.001 |
| ECG Measures | ||||||||
| PR ms | 528 | 150 (19) | 152 (20) | 153 (20) | 145 (21) | 158 (33) | 151 (20) | 0.937 |
| % PR > 200 ms | 528 | 1.5 (0.8) | 2.0 (1.1) | 1.7 (1.2) | 0.0 (0.0) | 11.1 (11.1) | 1.7 (0.6) | 0.565 |
| QRS ms | 533 | 104 (13) | 102 (10) | 106 (17) | 104 (15) | 96 (8) | 104 (13) | 0.872 |
| % QRS > 120 ms | 533 | 4.3 (1.4) | 4.5 (1.7) | 10.7 (2.8) | 15.4 (5.9) | 0.0 (0.0) | 6.2 (1.0) | 0.018 |
Table 3
Crude prevalence and incidence of atrial fibrillation.
| AGE GROUP (YEARS) | 40–49 | 50–59 | 60–69 | 70–79 | ≥ 80 | TOTAL |
|---|---|---|---|---|---|---|
| TSIMANE | ||||||
| Number of individuals | 670 | 328 | 204 | 90 | 22 | 1314 |
| Number of AF cases | 0 | 0 | 0 | 1 | 0 | 1 |
| AF prevalence (per 1,000) | 0 | 0 | 0 | 11.11 | 0 | 0.76 |
| N with >1 ECG | 541 | 286 | 157 | 60 | 15 | 1059 |
| Total Person-Years | 3726 | 2190 | 1074 | 335 | 70 | 7395 |
| Average Risk Years per Person | 6.89 | 7.66 | 6.84 | 5.59 | 4.67 | 6.98 |
| Number of new AF cases | 0 | 0 | 0 | 0 | 1 | 1 |
| AF incidence (per 1,000 person years) | 0 | 0 | 0 | 0 | 14.29 | 0.14 |
| MOSETEN | ||||||
| Number of individuals | 208 | 156 | 121 | 39 | 10 | 534 |
| Number of AF cases | 0 | 0 | 0 | 1 | 0 | 1 |
| AF prevalence (per 1,000) | 0 | 0 | 0 | 25.64 | 0 | 1.87 |
| N with > 1 ECG | 96 | 92 | 88 | 25 | 9 | 310 |
| Total Person-Years | 170 | 162 | 153 | 43 | 14 | 542 |
| Average Risk Years per Person | 1.78 | 1.76 | 1.74 | 1.73 | 1.55 | 1.75 |
| Number of new AF cases | 0 | 0 | 0 | 0 | 0 | 0 |
| AF incidence (per 1,000 person years) | 0 | 0 | 0 | 0 | 0 | 0 |