
Table 1
Socio-demographic and Cancer Characteristics of Breast Cancer Cases Percentages may not add up to 100% due to missing values.
| OVERALL (%) N = 224 (100.00) | |
|---|---|
| Age | |
| <40 | 41 (18.30) |
| 40–49 | 76 (33.93) |
| 50–59 | 58 (25.89) |
| 60+ | 49 (21.88) |
| Marital Status | |
| Never Married | 10 (4.46) |
| Married | 157 (70.09) |
| Separated/Divorced | 12 (5.36) |
| Widowed | 45 (20.09) |
| Mammogram Screening in Past 2 Years | |
| Yes | 26 (11.61) |
| No | 197 (87.95) |
| Comorbidities | |
| None | 17 (7.59) |
| 1–2 Conditions | 191 (85.27) |
| >2 Conditions | 16 (7.14) |
| Participant Education | |
| Primary School or Less | 76 (33.93) |
| Secondary/High School | 73 (32.59) |
| College + | 75 (33.48) |
| Mother Education | |
| Primary School or Less | 190 (84.82) |
| Secondary/High School | 18 (8.04) |
| College + | 13 (5.80) |
| Father Education | |
| Primary School or Less | 160 (71.43) |
| Secondary/High School | 40 (17.86) |
| College + | 23 (10.27) |
| Life-course Education (Mother) | |
| Stable Low | 74 (33.04) |
| Decreasing | 0 (0.00) |
| Increasing | 116 (51.79) |
| Stable High | 31 (13.84) |
| Life-course Education (Father) | |
| Stable Low | 68 (30.36) |
| Decreasing | 8 (3.57) |
| Increasing | 92 (41.07) |
| Stable High | 55 (24.55) |
| Cancer Grade | |
| 1 | 15 (6.70) |
| 2 | 132 (58.93) |
| 3 | 77 (34.38) |
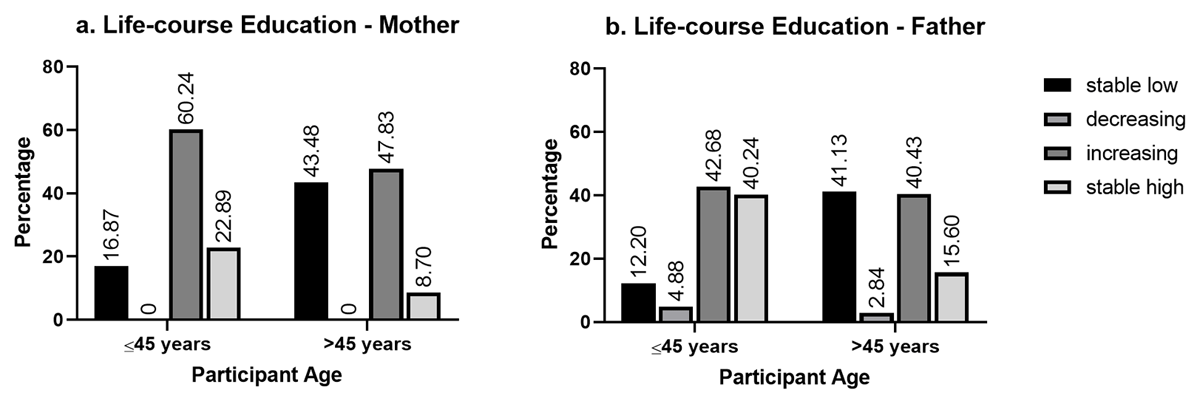
Figure 1
Distribution of life-course education by participant age. a) Distribution of life-course education categories relative to mother by age group. b) Distribution of life-course education categories relative to father by age group.
Table 2
Education Level by Cancer Grade at Diagnosis.
| OVERALL | LOW-GRADE (1–2) | HIGH-GRADE (3) | P-VALUE* | |
|---|---|---|---|---|
| N = 224 (100.00) | N = 147 (65.63) | N = 77 (34.38) | ||
| Participant Education Level | ||||
| Primary School or Less | 76 (33.93) | 48 (32.65) | 28 (36.36) | 0.5775 |
| Secondary/High School + | 148 (66.07) | 99 (67.35) | 49 (63.64) | |
| Mother Education Level | ||||
| Primary School or Less | 190 (84.82) | 123 (83.67) | 67 (87.01) | 0.3025 |
| Secondary/High School + | 31 (13.84) | 23 (15.65) | 8 (10.39) | |
| Father Education Level | ||||
| Primary School or Less | 160 (71.43) | 99 (67.35) | 61 (79.22) | 0.0423 |
| Secondary/High School + | 63 (28.13) | 48 (32.65) | 15 (19.48) | |
| Life-course Education Level – Mother | ||||
| Stable Low | 74 (33.04) | 48 (32.65) | 26 (33.77) | 0.5874 |
| Decreasing | 0 (0.00) | 0 (0.00) | 0 (0.00) | |
| Increasing | 116 (51.79) | 75 (51.02) | 41 (53.25) | |
| Stable High | 31 (13.84) | 23 (15.65) | 8 (10.39) | |
| Life-course Education Level – Father | ||||
| Stable Low | 68 (30.36) | 42 (28.57) | 26 (33.77) | 0.2478 |
| Decreasing | 8 (3.57) | 6 (4.08) | 2 (2.60) | |
| Increasing | 92 (41.07) | 57 (38.78) | 35 (45.45) | |
| Stable High | 55 (24.55) | 42 (28.57) | 13 (16.88) | |
[i] * Determined using Chi-Square tests Where applicable, missing values were not used to generate the p-value.
Percentages may not add up to 100% due to missing values. Life-course education is defined based on participant and parent education level.
Table 3
Multivariate Odds Ratios (OR) for High-Grade Diagnosis.
| UNADJUSTED | AGE | FULLY ADJUSTED | |
|---|---|---|---|
| OR (95% CI) | aOR (95% CI)a | aOR (95% CI)b | |
| Participant Education Level | |||
| Primary School or Less (Ref.) | – | – | – |
| Secondary/High School + | 0.85 (0.48, 1.51) | 0.68 (0.36, 1.29) | 0.72 (0.37, 1.36) |
| Mother Education Level | |||
| Primary School or Less (Ref.) | – | – | – |
| Secondary/High School + | 0.64 (0.27, 1.51) | 0.57 (0.24, 1.37) | 0.57 (0.23, 1.38) |
| Father Education Level | |||
| Primary School or Less (Ref.) | – | – | – |
| Secondary/High School + | 0.51 (0.26, 0.98) | 0.43 (0.21, 0.85) | 0.41 (0.20, 0.84) |
| Life-course Education Level – Mother | |||
| Stable Low (Ref.) | – | – | – |
| Decreasing | # | # | # |
| Increasing | 1.01 (0.55, 1.86) | 0.83 (0.43, 1.62) | 0.87 (0.44, 1.71) |
| Stable High | 0.64 (0.25, 1.64) | 0.51 (0.19, 1.35) | 0.51 (0.19, 1.40) |
| Life-course Education Level – Father | |||
| Stable Low (Ref.) | – | – | – |
| Decreasing | 0.54 (0.10, 2.87) | 0.40 (0.07, 2.25) | 0.41 (0.07, 2.46) |
| Increasing | 0.99 (0.52, 1.89) | 0.78 (0.39, 1.56) | 0.82 (0.40, 1.69) |
| Stable High | 0.50 (0.23, 1.10) | 0.36 (0.15, 0.84) | 0.36 (0.15, 0.87) |
[i] a Adjusted for age.
b Adjusted for age, mammogram screening, marital status, and comorbidities.
OR = Odds Ratio.
aOR = Adjusted Odds Ratio.
# = Undefined.
Bold indicates significance p-value ≤ 0.05.
Life-course education is defined based on participant and parent education level.