
Table 1
Synergies between the SDGs and South Africa’s NDP (adapted from Cumming et al., 2017 and The SDG Country Report 2019 – South Africa) [713].
| SUSTAINABLE DEVELOPMENT GOAL (SDG) | SOUTH AFRICAN NATIONAL DEVELOPMENT PLAN (NDP) FOCUS AREAS | |
|---|---|---|
| 1. | End poverty in all its forms everywhere. | Chapter 3: Economy and employment Chapter 4: Economic infrastructure Chapter 5: Environmental sustainability and resilience Chapter 6: Inclusive rural economy Chapter 8: Transforming human settlements Chapter 11: Social protection |
| 2. | End hunger, achieve food security and improved nutrition, and promote sustainable agriculture. | Chapter 3: Economy and employment Chapter 4: Economic infrastructure Chapter 5: Environmental sustainability and resilience Chapter 6: Inclusive rural economy Chapter 7: Positioning South Africa in the world Chapter 10: Healthcare for all Chapter 11: Social protection |
| 3. | Ensure healthy lives and promote well-being for all ages. | Chapter 5: Environmental sustainability and resilience Chapter 10: Healthcare for all Chapter 12: Building safer communities |
| 4. | Ensure inclusive and equitable quality education and promote life-long learning opportunities for all. | Chapter 9: Improving education, training, and innovation Chapter 11: Social protection |
| 5. | Achieve gender equality and empower all women and girls. | Chapter 4: Economic infrastructure Chapter 6: Inclusive rural economy Chapter 10: Healthcare for all Chapter 12: Building safer communities |
| 6. | Ensure availability and sustainable management of water and sanitation for all. | Chapter 4: Economic infrastructure Chapter 5: Environmental sustainability and resilience Chapter 8: Transforming human settlements |
| 7. | Ensure access to affordable, reliable, sustainable, and modern energy for all. | Chapter 4: Economic infrastructure Chapter 5: Environmental sustainability and resilience |
| 8. | Promote sustained, inclusive, and sustainable economic growth, full and productive employment, and decent work for all. | Chapter 3: Economy and employment Chapter 5: Environmental sustainability and resilience Chapter 6: Inclusive rural economy Chapter 9: Improving education, training, and innovation |
| 9. | Build resilient infrastructure, promote inclusive and sustainable industrialization and foster innovation. | Chapter 4: Economic infrastructure Chapter 9: Improving education, training, and innovation |
| 10. | Reduce inequality within and among countries. | Central theme of NDP Chapter 3: Economy and employment Chapter 11: Social protection Chapter 12: Building safer communities Chapter 15: Nation building and social cohesion |
| 11. | Make cities and human settlements inclusive, safe, resilient, and sustainable. | Chapter 4: Economic infrastructure Chapter 5: Environmental sustainability and resilience Chapter 8 Transforming human settlements Chapter 13: Building a capable and developmental state |
| 12. | Ensure sustainable consumption and production patterns. | Chapter 4: Economic infrastructure Chapter 5: Environmental sustainability and resilience Chapter 6: Inclusive rural economy Chapter 8: Transforming human settlements |
| 13. | Take urgent action to combat climate change and its impacts. | Chapter 4: Economic infrastructure Chapter 5: Environmental sustainability and resilience |
| 14. | Conserve and sustainably use the oceans, seas, and marine resources for sustainable development. | Chapter 5: Environmental Sustainability and resilience |
| 15. | Protect, restore, and promote sustainable use of terrestrial ecosystems, sustainably manage forests, combat desertification, and halt and reverse land degradation and halt biodiversity loss. | Chapter 5: Environmental sustainability and resilience |
| 16. | Promote peaceful and inclusive societies for sustainable development, provide access to justice for all and build effective, accountable, and inclusive institutions at all levels. | Chapter 11: Social protection Chapter 12: Building safer communities Chapter 13: Building a capable and developmental state Chapter 14: Fighting corruption Chapter 15: Notion building and social cohesion |
| 17. | Strengthen the means of implementation and revitalize the global partnership for sustainable development. | Chapter 7: Positioning South Africa in the world |
[i] Note: This list is not exhaustive.

Table 2
South Africa’s SDG dashboard for 2019 showing a performance assessment towards the 17 SDGs and associated trends.
* Adapted from The Sustainable Development Goals Centre for Africa and Sustainable Development Solutions Network 2019.
Note: There are four color categories. Green denotes SDG achievement, followed by yellow and orange which indicate an increasing distance from SDG achievement. Red highlights major challenges.

Figure 1
Location of the villages included in the study area surrounding the town of Giyani, Limpopo.

Figure 2
Model used to assess local survey data within the context of the SDGs either officially or unofficially.
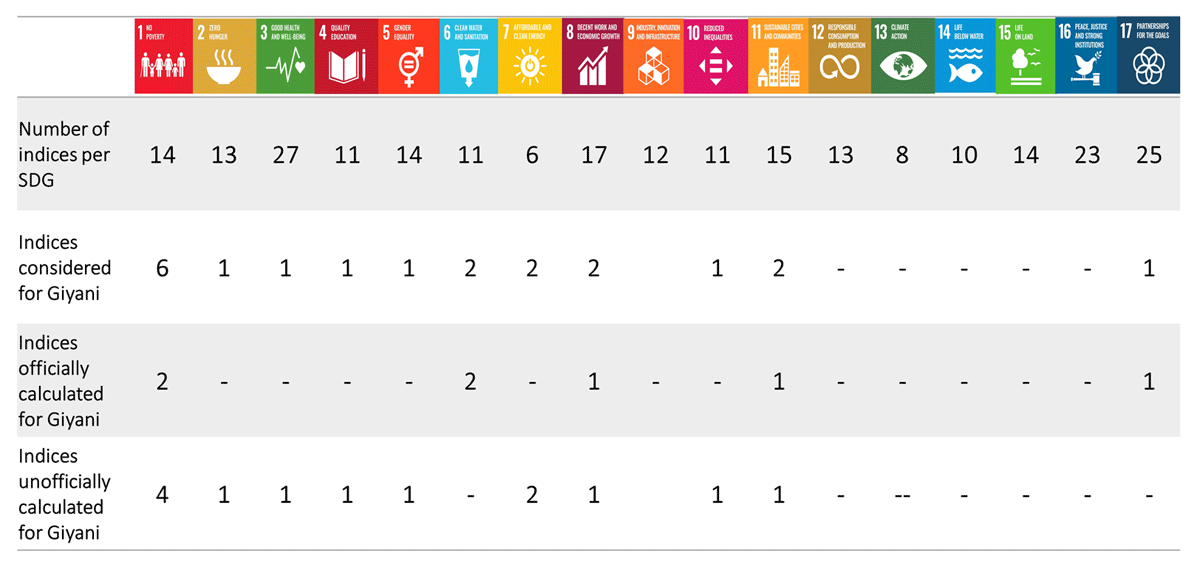
Table 3
Overview of the number of SDG indices considered, officially and unofficially, for this study using data collected in Giyani villages.
Table 4
Officially calculated SDG indicator scores (%) for South Africa vs Giyani villages in relation to the ideal SDG targets, categorized according to relevant socioeconomic status metric.
| SES METRIC | INDICATOR (SDG) | SOUTH AFRICA (%) | GIYANI (%) | TARGET (%) | CONTEXT |
|---|---|---|---|---|---|
| Income | Population living under international poverty line (SDG 1–1.1.1). | 7.4 | 17.7 | 0.0 | 1) No income = 17.7% 2) <R 1,000.00 = 29.8% At least 17.7% of respondents lived below the 2015 international poverty line at the time of the survey (R 456.38/person/month), as they did not earn a salary at all. The percentage could be higher, given that 29.8% of respondents earned less than R 1,000.00/ month (excluding any possible grants received by the household). Exact figures for respondents’ incomes were not available, as data on income were collected as an ordinal variable. |
| Income | Population living under national poverty line (SDG 1–1.2.1). | 25.2 | 17.7 | 0.0 | 1) No income = 17.7% 2) <R 1000 = 29.8% 17.7% of respondents lived below the food poverty line of R441/person/month, as they did not receive any income at all. The proportion of people living below the poverty line could be marginally higher, considering that an additional 29.8% of people earned below R 1,000.00/ month. Exact figures for respondents’ incomes were not available, as data on income were collected as an ordinal variable. |
| Employment | Unemployment rate (SDG 8–8.5.2). | 27.3 | 49.0 | 0.0 | The unemployment rate in Giyani was almost double the national rate. |
| Water | Access to drinking water (SDG6–6.1.1). | 86.0 | 99.3 | 100.0 | 99.3% of households had access to a basic drinking water source. This includes piped water into dwelling, yard, or plot; public taps or standpipes; boreholes or tube wells; protected dug wells; protected springs and rainwater. In Giyani, while many households had access to piped water, the water systems were unreliable and households often had extended periods of time without running water, relying on water storage, leading to other health-related risks (e.g., bacteriological contamination causing diarrheal disease) [14]. |
| Sanitation | Access to sanitation (SDG 6–6.2.1D). | 70.0 | 99.3 | 100.0 | 99.3% of households had access to “improved sanitation” facilities (flush or pour flush toilets connected to sewer systems, septic tanks, or pit latrines, ventilated improved pit latrines, pit latrines with a slab, and composting toilets). This is more than the reported national figure. |
| Housing | Population living in informal dwellings (SDG 11–11.1.1). | 12.2 | 2.9 | 0.0 | 2.9% of participating households lived in informal dwellings. This means that more people in Giyani live in formal dwellings, compared to the rest of the country. |
| Access to internet | Proportion of people using the internet (SDG 17–17.8.1). | 61.8 | 4.2 | 100.0 | 4.2% of households had access to internet. This is substantially less than the country’s measurement. |
[i] Bold: Better than national score.
Note: for more information on results and computation, see Table S1 in supplementary tables.