
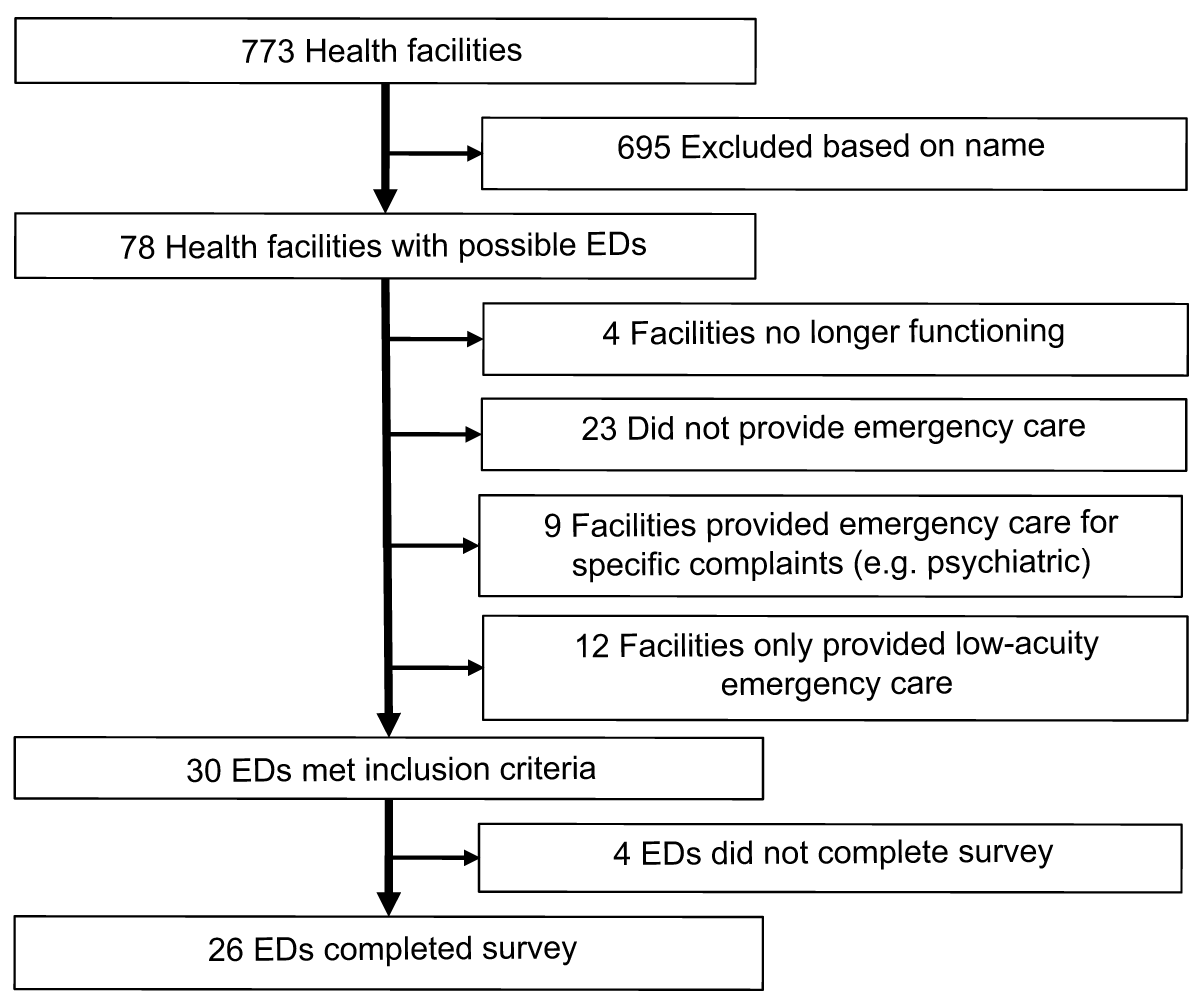
Figure 1
Sample Selection: inclusion/exclusion algorithm used to establish study sample.
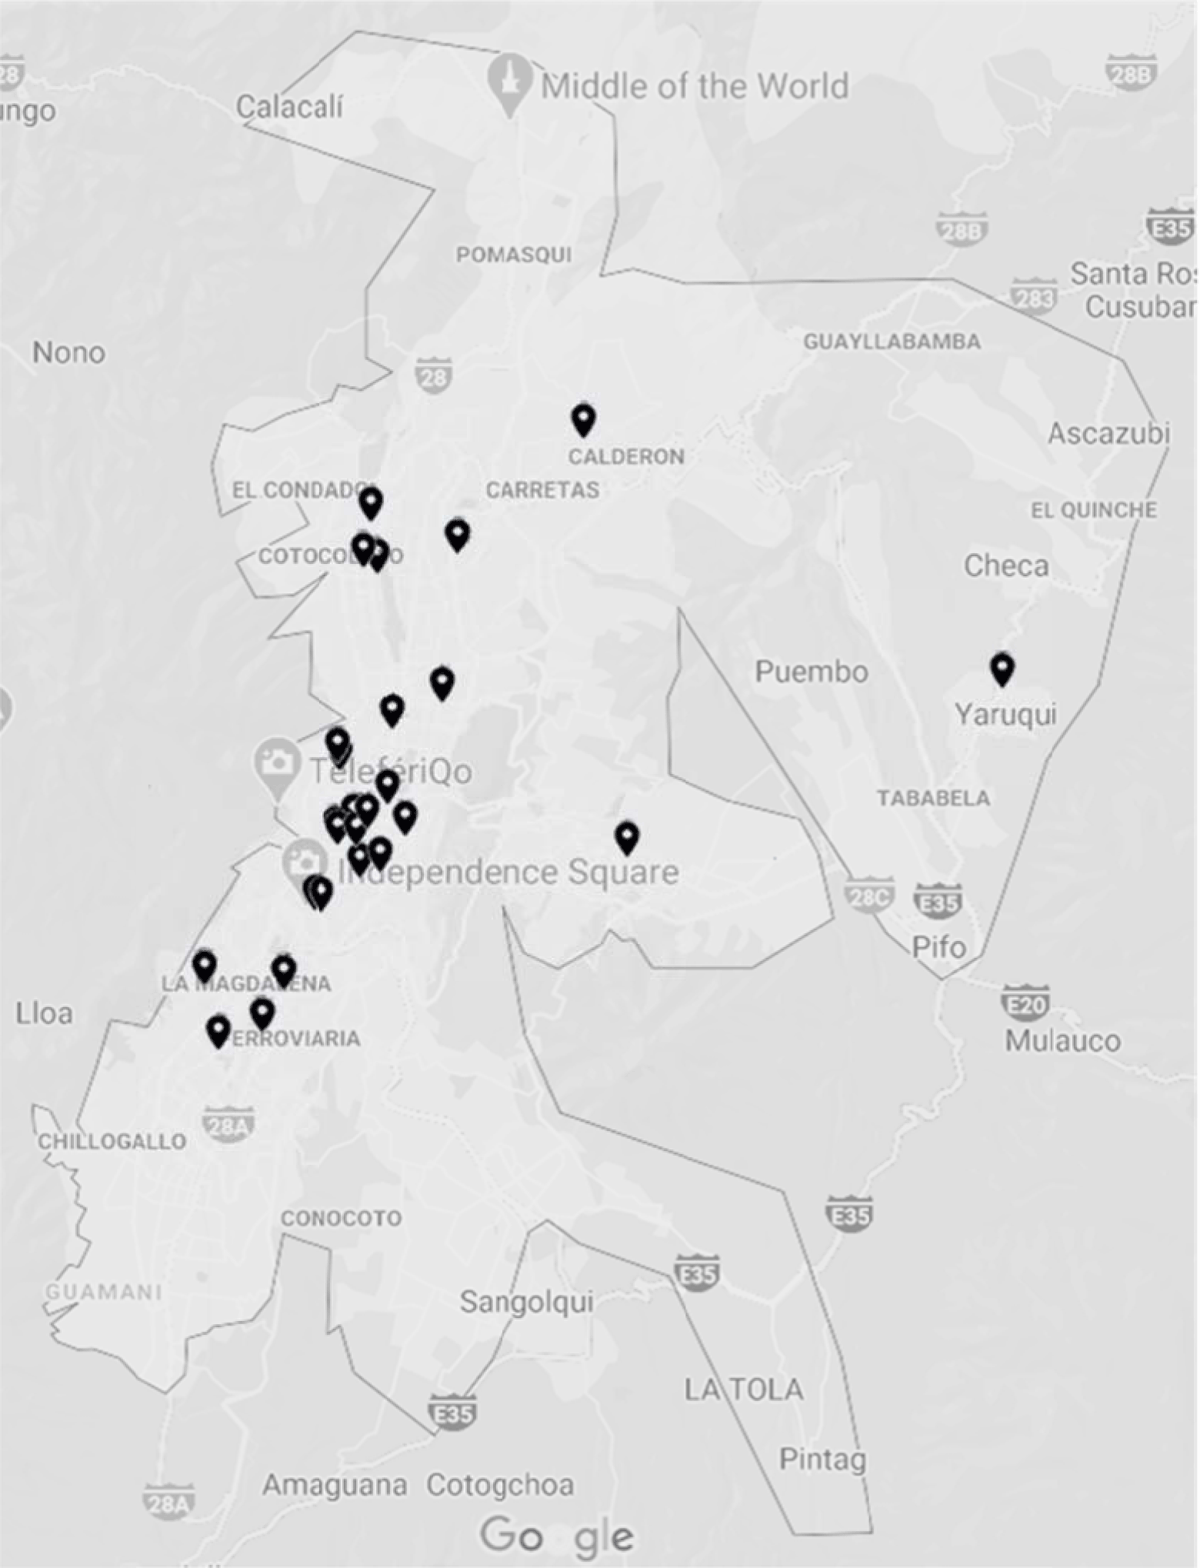
Figure 2
Geographic Distribution of Emergency Departments in Metropolitan Quito.
Table 1
Characteristics of Emergency Departments in Quito, Ecuador (n = 26, 87% response).
| PROPORTION OR MEDIAN | 95% CONFIDENCE INTERVAL OR INTERQUARTILE RANGE | |
|---|---|---|
| ED Characteristics | ||
| Contiguous | 96% | 89–100% |
| Total visits (n = 26) (median) | 25,898 | 12,043–45,050 |
| Percent of visits by children (n = 20, median) | 30% | 23–38% |
| ED beds (n = 26, median) | 17 | 6–33 |
| Triage to service (n = 23) | 57% | 36–76% |
| Patient Experiences in the ED | ||
| Percent of ED pts arriving by ambulance (n = 23) | ||
| <20 | 43% | 23–64% |
| 20–39 | 17% | 2–33% |
| 40–59 | 13% | 0–27% |
| Unknown | 26% | 8–44% |
| Length of Stay (n = 26) | ||
| <1 hour | 4% | 0–11% |
| 1–6 hours | 65% | 47–84% |
| 6+ hours | 31% | 13–49% |
| Percent of ED visits leading to admission (n = 24) | ||
| <20 | 21% | 2–32% |
| 20–39 | 42% | 18–57% |
| 40–59 | 21% | 5–37% |
| Unknown | 17% | 2–32% |
| Resources and Capabilities | ||
| Nurse in ED 24/7 (n = 26) | 100% | – |
| Physician for ED (n = 25) | ||
| In ED 24/7 | 96% | 88–100% |
| In Hospital 24/7 | 4% | 0–12% |
| On call from home 24/7 | 0% | – |
| Mechanical ventilator (n = 25) | 96% | 88–100% |
| 24-hour lab availability (n = 26) | 92% | 82–100% |
| Cardiac monitor (n = 26) | 88% | 76–100% |
| EMR (n = 26) | 73% | 56–90% |
| Dedicated CT (n = 25) | 68% | 50–86% |
| Negative pressure room (n = 26) | 31% | 13–49% |
[i] Abbreviations: ED = emergency department; EMR = electronic medical record; CT = computed tomography; n = number of EDs that answered question; Unknown = respondent did not know answer.
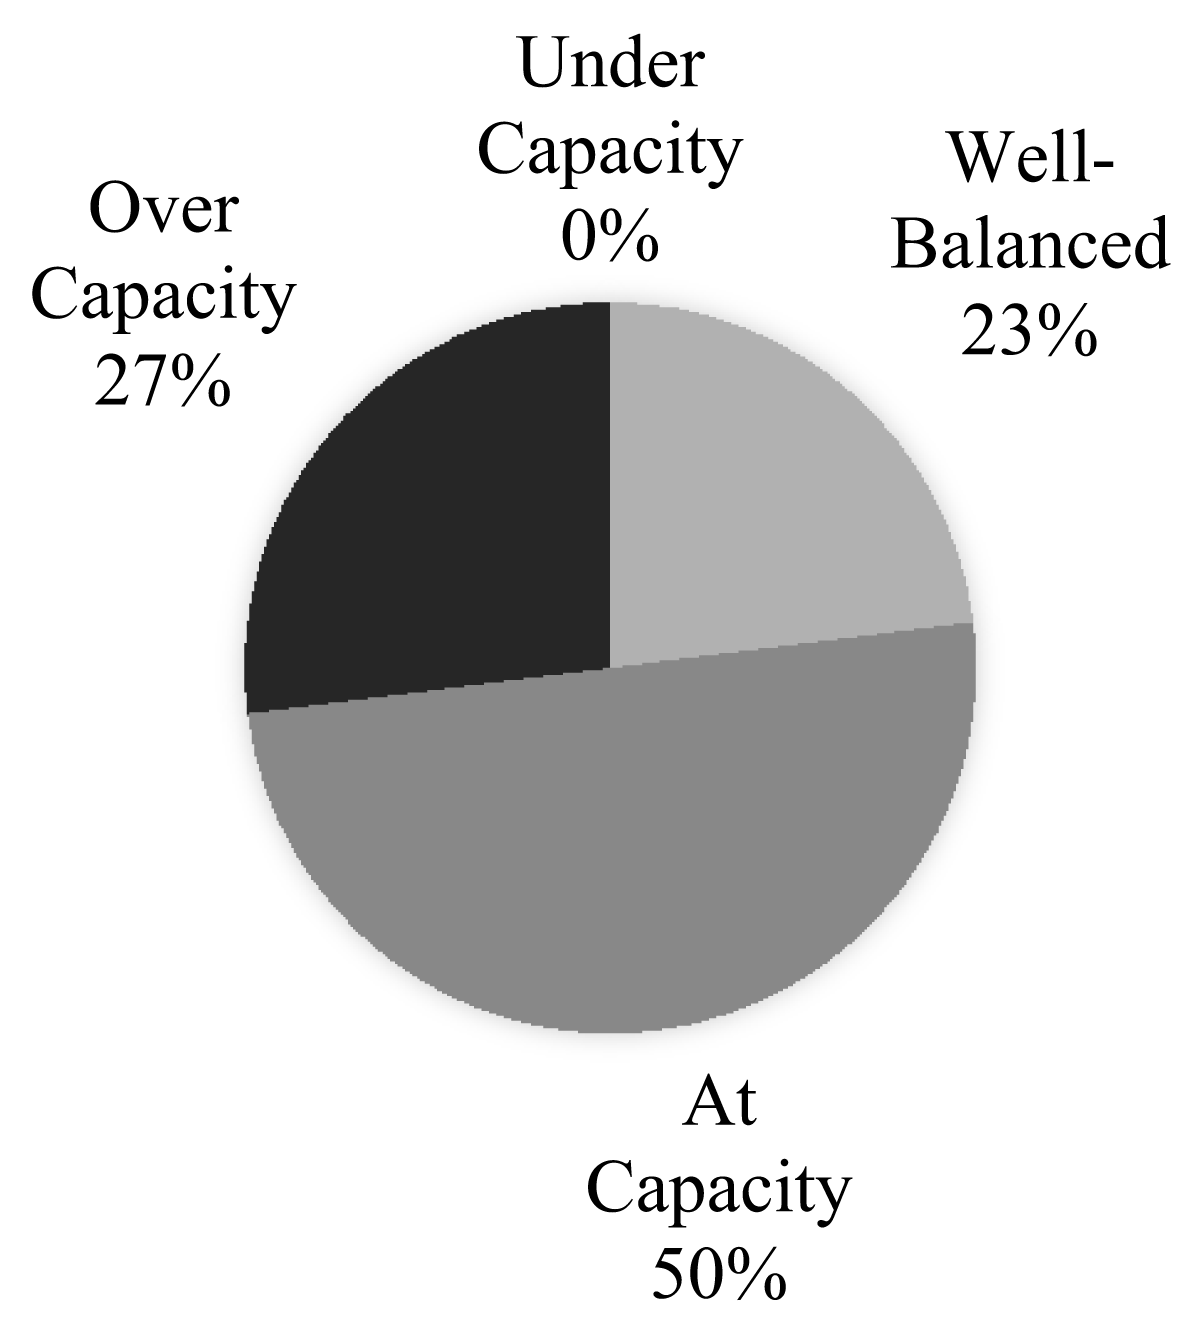
Figure 3
Reported Capacity of Surveyed Emergency Departments (n = 26).
Table 2
Emergency Types Identified as Treatable in Surveyed Emergency Departments in Quito, Ecuador.
| EMERGENCY TYPE | PERCENTAGE OF EDS ABLE TO TREAT 24/7 | 95% CONFIDENCE INTERVAL |
|---|---|---|
| Medical: general (n = 25) | 92% | 81–100% |
| Surgical: general (n = 25) | 92% | 81–100% |
| Gynecological (n = 26) | 88% | 76–100% |
| Surgical: orthopedic (n = 23) | 87% | 73–100% |
| Obstetrical (n = 25) | 84% | 70–98% |
| Toxicological (n = 24) | 83% | 68–98% |
| Trauma (n = 24) | 83% | 68–98% |
| Medical: cardiology (n = 24) | 75% | 58–92% |
| Neurological and neurosurgical (n = 22) | 73% | 54–91% |
| Surgical: plastic (n = 22) | 73% | 54–91% |
| Ear, nose, throat (n = 24) | 71% | 53–89% |
| Medical: oncology (n = 19) | 68% | 48–89% |
| Surgical: oral maxillofacial (n = 21) | 67% | 47–87% |
| Urological (n = 25) | 64% | 45–83% |
| Psychiatric (n = 19) | 63% | 41–85% |
| Ophthalmological (n = 20) | 60% | 39–81% |
| Surgical: hand (n = 22) | 45% | 25–66% |
| Dental (n = 18) | 28% | 81–100% |
[i] Abbreviations: ED = Emergency Department; n = number of EDs that answered question; Unknown = respondent did not know answer.
Table 3
Availability of Consultants in Surveyed Emergency Departments in Quito, Ecuador.
| CONSULTANT DEPARTMENT | PERCENTAGE OF EDS WITH 24/7 CONSULTANT ACCESS | 95% CONFIDENCE INTERVAL |
|---|---|---|
| OB/GYN (n = 23) | 91% | 80–100% |
| General Surgery (n = 23) | 87% | 73–100% |
| Anesthesia (n = 22) | 86% | 72–100% |
| Orthopedic Surgery (n = 22) | 86% | 72–100% |
| Neurosurgery (n = 18) | 56% | 33–79% |
| Plastic Surgery (n = 22) | 55% | 34–75% |
| Neurology (n = 22) | 45% | 25–66% |
| Cardiology (n = 22) | 41% | 20–61% |
| Psychiatry (n = 18) | 39% | 16–61% |
[i] Abbreviations: ED = Emergency Department; OB/GYN = Obstetrics and Gynecology; n = number of EDs that answered question; Unknown = respondent did not know answer.
Table 4
Comparison Between Government and Private Emergency Departments in Quito, Ecuador.
| GOVERNMENT (n = 12) | PRIVATE (n = 14) | p-VALUE | |||
|---|---|---|---|---|---|
| PROPORTION OR MEDIAN | 95% CONFIDENCE INTERVAL | PROPORTION OR MEDIAN | 95% CONFIDENCE INTERVAL | ||
| ED Characteristics | |||||
| Contiguous | 92% | 56–99% | 100% | – | 0.46 |
| Total Visits | 50,090 | 31,530–87,413 | 13,968 | 6,000–20,160 | <0.001 |
| Percent of Pediatrics Patients | 27% | 14–33% | 34% | 29–40% | 0.11 |
| ED Beds (median) | 36 | 18–52 | 9 | 5–18 | 0.002 |
| Triage to a Service | 64% | 32–87% | 50% | 23–77% | 0.68 |
| Patient Experiences in the ED | |||||
| Percent of ED pts arriving by ambulance | 0.43 | ||||
| <20 | 30% | 9–64% | 54% | 27–79% | |
| 20–39 | 10% | 1–50% | 23% | 7–54% | |
| 40–59 | 20% | 5–56% | 8% | 1–42% | |
| Unknown | 40% | 15–72% | 15% | 4–47% | |
| Length of Stay | 0.009 | ||||
| < 1 hour | 0% | – | 7% | 1–39% | |
| 1–6 hours | 42% | 18–70% | 86% | 55–97% | |
| 6+ hours | 58% | 30–82% | 7% | 1–39% | |
| Percent of ED visits leading to admission | 0.65 | ||||
| <20 | 30% | 9–64% | 14% | 3–45% | |
| 20–39 | 40% | 15–72% | 43% | 20–70% | |
| 40–59 | 10% | 0–45% | 29% | 11–58% | |
| Unknown | 20% | 1–50% | 14% | 3–45% | |
| Resources and Capabilities | |||||
| Nurse in ED 24/7 | 100% | – | 100% | – | |
| Physician for ED | 0.99 | ||||
| In ED 24/7 | 100% | – | 92% | 58–99% | |
| In Hospital 24/7 | 0% | – | 8% | 1–42% | |
| On call from home 24/7 | 0% | – | 0% | – | |
| Mechanical ventilator | 100% | – | 93% | – | 0.99 |
| 24-hour lab availability | 83% | 52–98% | 100% | – | 0.2 |
| Cardiac Monitor | 83% | 52–98% | 93% | 66–99% | 0.58 |
| EMR | 42% | 15–72% | 100% | – | 0.99 |
| Dedicated CT | 67% | 35–91% | 69% | 39–91% | 0.61 |
| Negative pressure room | 33% | 10–65% | 29% | 8–58% | 0.99 |
| Capacity | 0.24 | ||||
| Under capacity | 0% | – | 0% | – | |
| Well-balanced | 25% | 8–57% | 21% | 7–51% | |
| At capacity | 33% | 12–64% | 64% | 36–85% | |
| Over capacity | 42% | 18–70% | 14% | 3–45% | |
| Treatable Medical Emergencies 24/7 | |||||
| Medical: general | 100% | – | 86% | 55–97% | 0.49 |
| Surgical: general | 91% | 53–99% | 93% | 60–99% | 0.99 |
| Gynecological | 91% | 53–99% | 86% | 57–98% | 0.99 |
| Surgical: orthopedic | 100% | – | 77% | 46–93% | 0.23 |
| Obstetrical | 91% | 53–99% | 79% | 49–93% | 0.60 |
| Toxicological | 91% | 53–99% | 79% | 49–93% | 0.60 |
| Trauma | 100% | – | 69% | 39–89% | 0.10 |
| Medical: cardiology | 100% | – | 57% | 30–80% | 0.02 |
| Neurological and neurosurgical | 70% | 36–91% | 75% | 43–92% | 0.99 |
| Surgical: plastic | 89% | 47–99% | 62% | 33–84% | 0.33 |
| Ear, nose, throat | 82% | 48–98% | 62% | 33–84% | 0.39 |
| Medical: oncology | 67% | 31–90% | 70% | 35–91% | 0.99 |
| Surgical: oral maxillofacial | 67% | 31–90% | 67% | 36–88% | 0.99 |
| Urological | 73% | 40–92% | 57% | 30–80% | 0.68 |
| Psychiatric | 78% | 40–97% | 50% | 21–79% | 0.35 |
| Ophthalmological | 70% | 39–95% | 50% | 21–79% | 0.65 |
| Surgical: hand | 40% | 15–72% | 50% | 23–77% | 0.69 |
| Dental | 33% | 10–69% | 22% | 5–61% | 0.99 |
| Consultant Availability 24/7 | |||||
| OB/GYN | 82% | 47–96% | 100% | – | 0.22 |
| General Surgery | 80% | 44–95% | 92% | 58–99% | 0.56 |
| Anesthesia | 90% | 50–99% | 83% | 50–96% | 0.99 |
| Orthopedic Surgery | 100% | – | 77% | 46–93% | 0.24 |
| Neurosurgery | 83% | 33–98% | 42% | 17–71% | 0.15 |
| Plastic Surgery | 67% | 31–89% | 46% | 21–73% | 0.42 |
| Neurology | 44% | 17–76% | 46% | 21–73% | 0.99 |
| Cardiology | 33% | 10–69% | 46% | 21–73% | 0.67 |
| Psychiatry | 22% | 5–61% | 56% | 23–84% | 0.34 |