
Table 1
Comparison of participants by various sociodemographic characteristics among 2,100 adolescents in Gombe City and Uyo City in northern and southern Nigeria respectively.
| Variable | Uyo City | Gombe City | Total (Overall) | P Value |
|---|---|---|---|---|
| 1733 (%) | 367 (%) | 2,100 (%) | ||
| Age group | ||||
| Early (10–13) | 595 (34.33) | 89 (24.25) | 684 (32.57) | |
| Middle (14–16) | 876 (50.55) | 180 (49.05) | 1,056 (50.29) | |
| Late (17–18) | 262 (15.12) | 98 (26.70) | 360 (17.14) | 0.000 |
| Sex | ||||
| Male | 736 (42.47) | 191 (52.04) | 927 (44.14) | |
| Female | 997 (57.53) | 176 (47.96) | 1,173 (55.86) | 0.001 |
| Religion | ||||
| Christianity | 1,724 (99.48) | 153 (41.69) | 1,877 (89.38) | |
| Islam | 9 (0.52) | 214 (58.31) | 223 (10.62) | 0.000 |
| Ethnicity | ||||
| Ibibio | 1,410 (81.36) | 0 (0.00) | 1,410 (67.14) | |
| Igbo | 109 (6.29) | 3 (0.82) | 112 (5.33) | |
| Annang | 60 (3.46) | 0 (0.00) | 60 (2.86) | |
| Oro | 44 (2.54) | 0 (0.00) | 44 (2.10) | |
| Efik | 46 (2.65) | 0 (0.00) | 46 (2.19) | |
| Hausa | 12 (0.69) | 85 (23.16) | 97 (4.62) | |
| Fulani | 0 (0.00) | 122 (33.24) | 122 (5.81) | |
| Tangale | 0 (0.00) | 69 (18.80) | 69 (3.29) | |
| Waja | 0 (0.00) | 20 (5.45) | 20 (0.95) | |
| Yoruba | 19 (1.10) | 15 (4.09) | 34 (1.62) | |
| Tera | 0 (0.00) | 13 (3.54) | 13 (0.62) | |
| Others | 33 (1.90) | 40 (10.90) | 73 (3.48) | 0.000 |
| Family Setting | ||||
| Monogamous | 1,488 (85.86) | 243 (66.21) | 1,731 (82.43) | |
| Polygamous | 245 (14.14) | 124 (33.79) | 369 (17.57) | 0.000 |
| Family Socioeconomic status | ||||
| 1 (Wealthiest) | 493 (28.45) | 39 (10.63) | 532 (25.33) | |
| 2 | 536 (30.93) | 70 (19.07) | 606 (28.86) | |
| 3 | 465 (26.83) | 152 (41.42) | 617 (29.38) | |
| 4 | 221 (12.75) | 83 (22.62) | 304 (14.48) | |
| 5 (Poorest) | 18 (1.04) | 23 (6.27) | 41 (1.95) | 0.000 |
| Age (years), Mean (95%CI) | 14.27 (14.17, 14.28) | 14.92 (14.71, 15.11) | 14.38 (14.29, 14.47) | 0.000 |
| Weight (kg), Mean (95%CI) | 48.79 (48.32, 49.31) | 49.65 (48.40, 50.90) | 48.94 (48.49, 49.39) | 0.156 |
| Height (cm), Mean (95%CI) | 157.72 (157.27, 158.16) | 157.70 (156.70, 158.71) | 157.72 (157.31, 158.12) | 0.967 |
| Waist (cm), Mean (95%CI) | 69.47 (68.69, 70.25) | 68.73 (67.71, 69.72) | 69.34 (68.68, 70.01) | 0.404 |
| BMI, Mean (95%CI) | 19.48 (19.34, 19.63) | 19.85 (19.42, 20.27) | 19.55 (19.41, 19.69) | 0.053 |
| WHtR, Mean (95%CI) | 0.44 (0.44, 0.45) | 0.44 (0.43, 0.44) | 0.44 (0.44, 0.44) | 0.423 |
| BMI for age Z score, Mean (95%CI) | –0.24 (–0.30, –0.19) | –0.37 (–0.52, –0.24) | –0.27 (–0.32, –0.21) | 0.049 |
| Height for Age Z scores, Mean (95%CI) | –0.46 (–0.52, –0.41) | –0.37 (–0.98, –0.75) | –0.53 (–0.58, –0.48) | 0.000 |
[i] + All confidence intervals and P Values from mean age to mean height for age z scores were generated after performing an independent sample t test comparing north and south.
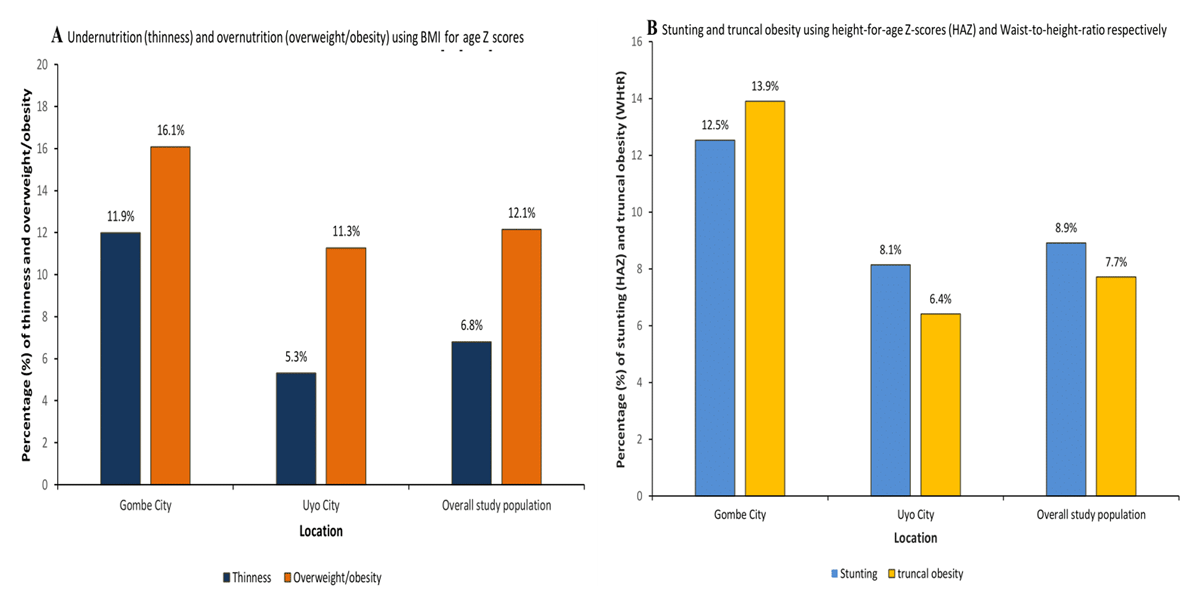
Figure 1
Prevalence rate of population-level thinness, overweight/obesity, stunting, and truncal obesity among adolescents in Gombe, Uyo and the overall study population. Note: Thinness = BAZ < –2SD, overweight/obesity = BAZ > 1SD, stunting = HAZ < –2SD, and truncal obesity = WHtR ≥ 0.5. BAZ (BMI-for-age Z-scores), HAZ (Height-for-age Z-scores) and WHtR (Weight-to-Height-Ratio).
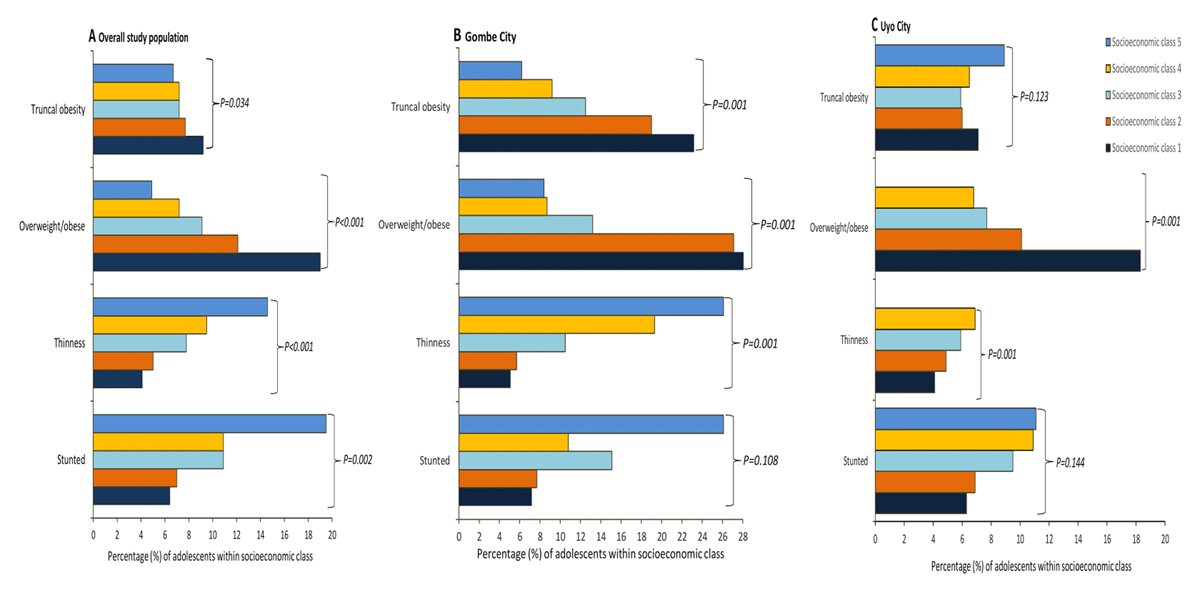
Figure 2
The prevalence rate of population-level malnutrition (truncal obesity, overweight/obesity, thinness and stunting) by socioeconomic status among adolescents in Gombe, Uyo and the overall study population. Note: Within-group prevalence rates are computed (i.e. the prevalence of over- or undernutrition within each socioeconomic class). Thinness = BAZ < –2SD, overweight/obesity = BAZ > 1SD, stunting = HAZ < –2SD, and truncal obesity = WHtR ≥ 0.5.
Table 2
Under-nutrition and over-nutrition measures by location, sex and age among 2,100 adolescents in Gombe and Uyo.
| Various Obesity Measures | Location | Sex | Age Groups | ||||||||
|---|---|---|---|---|---|---|---|---|---|---|---|
| Uyo, n (%) | Gombe, n (%) | P Value | Male, n (%) | Female, n (%) | P Value | Early, n (%) | Middle, n (%) | Late, n (%) | P Value | Total (%) | |
| N= 1733 | N = 367 | N = 927 | N = 1,173 | N = 684 | N = 1,056 | N = 360 | N = 2,100 | ||||
| BMI For Age | |||||||||||
| Severe Thinness | 20 (1.15) | 6 (1.63) | 20 (2.16) | 6 (0.51) | 7 (1.02) | 14 (1.33) | 5 (1.39) | 26 (1.24) | |||
| Thinness | 72 (4.15) | 38 (10.35) | 74 (7.98) | 36 (3.07) | 28 (4.09) | 55 (5.21) | 27 (7.50) | 110 (5.24) | |||
| Normal | 1,445 (83.38) | 264 (71.93) | 756 (81.55) | 953 (81.24) | 518 (75.73) | 895 (84.75) | 296 (82.22) | 1,709 (81.38) | |||
| Overweight | 152 (8.77) | 40 (10.90) | 53 (5.72) | 139 (11.85) | 6 (12.57) | 78 (7.39) | 28 (7.78) | 192 (9.14) | |||
| Obese | 44 (2.54) | 19 (5.18) | 0.000 | 24 (2.59) | 39 (3.32) | 0.000 | 45 (6.58) | 14 (1.33) | 4 (1.11) | 0.000 | 63 (3.00) |
| Height for Age | |||||||||||
| Severely stunted | 23 (1.33) | 8 (2.18) | 22 (2.37) | 9 (0.77) | 2 (0.29) | 23 (2.17) | 6 (1.67) | 31 (1.48) | |||
| Stunted | 118 (6.81) | 38 (10.35) | 113 (12.19) | 43 (3.67) | 31 (4.53) | 98 (9.28) | 27 (7.50) | 156 (7.43) | |||
| Normal | 1,585 (91.46) | 321 (87.47) | 790 (85.22) | 1,116 (95.14) | 644 (94.15) | 935 (88.54) | 327 (90.83) | 1,906 (90.76) | |||
| Tall | 7 (0.40) | 0 (0.00) | 0.035 | 2 (0.22) | 5 (0.43) | 0.000 | 7 (1.02) | 0 (0.00) | 0 (0.000) | 0.000 | 7 (0.33) |
| Waist to height ratio | |||||||||||
| Normal | 1,622 (93.59) | 316 (86.10) | 892 (96.22) | 1,046 (89.17) | 617 (31.84) | 992 (51.19) | 329 (16.98) | 1,938 (92.29) | |||
| Obese (truncal) | 111 (6.41) | 51 (13.90) | 0.000 | 35 (3.78) | 127 (10.83) | 0.000 | 67 (41.36) | 64 (39.51) | 31 (19.14) | 0.013 | 162 (7.71) |
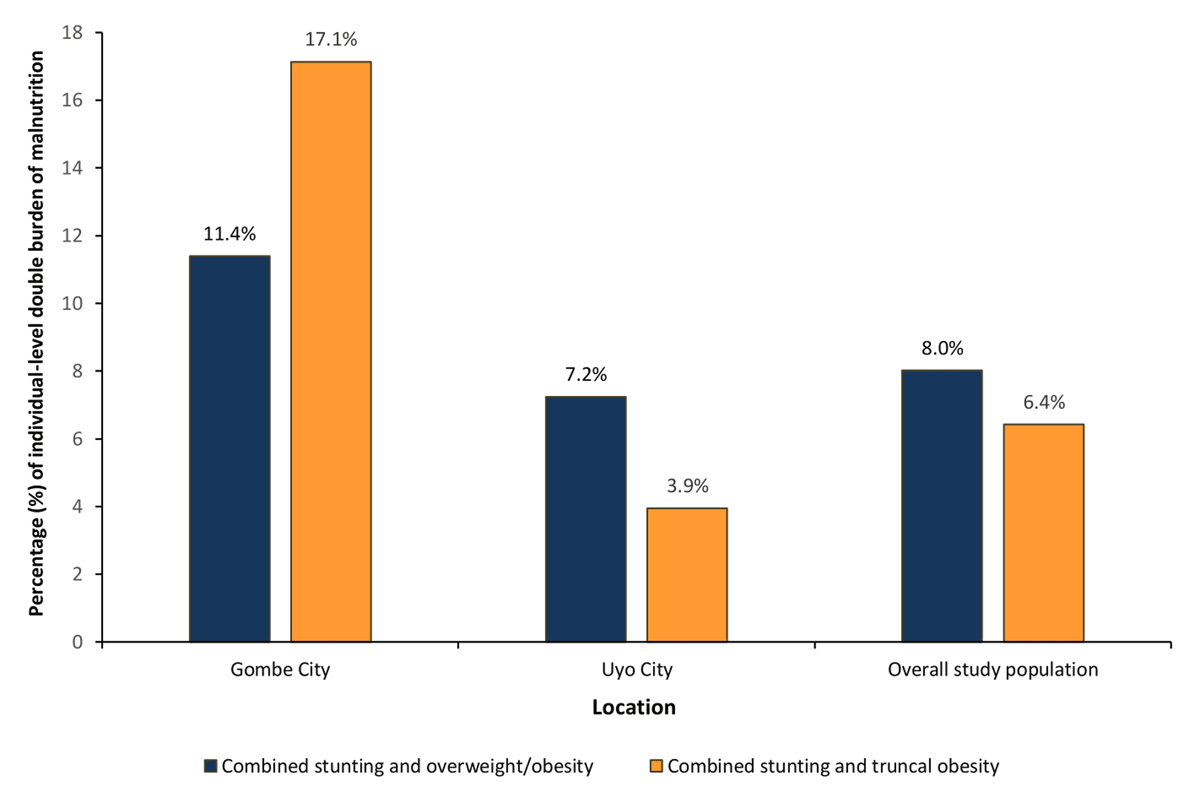
Figure 3
The prevalence rate of individual-level double burden malnutrition among adolescents in Gombe, Uyo and the overall study population. Note: This graph shows the proportion of adolescents who were either concurrently stunted (HAZ < –2SD) and overweight/obese (BAZ > 1SD) or Stunted (HAZ < –2SD) and had truncal obesity (WHtR ≥ 0.5).
Table 3
Comparing Individual-level coexistence of stunting and obesity/overweight among adolescents in Gombe and Uyo.
| HAZ category Overall | HAZ category Gombe | HAZ category Uyo | P Value | ||||
|---|---|---|---|---|---|---|---|
| *Stunted | Normal | *Stunted | Normal | *Stunted | Normal | ||
| N = 187 (%) | N = 1913 (%) | N = 35 (%) | N = 332 (%) | N = 152 (%) | N = 1,581 (%) | ||
| BMI | |||||||
| Thinness** | 42 (22.46) | 94 (4.91) | 7 (20.00) | 26 (7.83) | 35 (23.03) | 68 (4.30) | |
| Normal | 130 (69.52) | 1,579 (82.54) | 24 (68.57) | 278 (83.73) | 106 (69.74) | 1,301 (82.29) | |
| Overweight/Obesity | 15 (8.02) | 240 (12.55) | 4 (11.4) | 28 (8.43) | 11 (7.24) | 212 (13.41) | 0.410 |
| WHtR | |||||||
| Normal | 175 (93.58) | 1,763 (92.16) | 29 (82.86) | 307 (92.47) | 146 (96.05) | 1,456 (92.09) | |
| Obese (truncal) | 12 (6.42) | 150 (7.84) | 6 (17.14) | 25 (7.53) | 6 (3.95) | 125 (7.91) | 0.004 |
[i] * Stunted included adolescents who were stunted (HAZ < –2SD) and those who were severely stunted (HAZ < –3SD).
** Thinness included adolescents who were thin (BAZ < –2SD) and those with severe thinness (BAZ < –3SD).
| BAZ | BMI-for-Age Z-score |
| BMI | Body Mass Index |
| CI | Confidence Interval |
| DBM | Double Burden of Malnutrition |
| HAZ | Height-for-Age Z-score |
| LMICs | Low-and Middle-Income Countries |
| NCDs | Non-Communicable Diseases |
| NNHS | National Nutrition and Health Survey |
| SD | Standard Deviation |
| SES | Socioeconomic Status |
| sSA | sub-Saharan Africa |
| U5 | Children Under Five Years old |
| WHO | World Health Organization |
| WHtR | Waist-to-Height-Ratio |