
Table 1
Demographics Information.
| Question | Number (n = 152) | Percent | |
|---|---|---|---|
| Degree Obtained in 2016 | Master of Global Health, Global Science or Global Medicine | 57 | 37.5% |
| Master of Public Health, with a concentration in Global Health or Master of Science in Public Health | 95 | 62.5% | |
| Gender | Male | 36 | 23.7% |
| Female | 115 | 75.7% | |
| Other/Prefer Not to Answer | 1 | 0.6% | |
| Race/Ethnic Background | American Indian/Alaskan Native | 1 | 0.7% |
| Hawaiian | 1 | 0.7% | |
| Asian or Pacific Islander, including Indian Subcontinent | 38 | 26.6% | |
| Black, not of Hispanic Origin | 9 | 6.3% | |
| Hispanic Origin | 14 | 9.8% | |
| White | 69 | 48.3% | |
| Prefer not to disclose | 11 | 7.7% | |
| Currently a citizen of U.S. or a holder of a U.S. permanent resident visa | Yes | 125 | 83.7% |
| No | 26 | 16.3% | |
| What degrees do you hold, excluding your recent Master’s level degree? | Bachelor’s degree | 112 | 77.8% |
| Degree in Nursing | 21 | 14.6% | |
| Master’s from a school of Public Health | 11 | 7.6% | |
| Employed and Not Employed | Employed | 102 | 67.1% |
| Not Employed | 47 | 30.9% | |
| Volunteering | 3 | 2.0% |
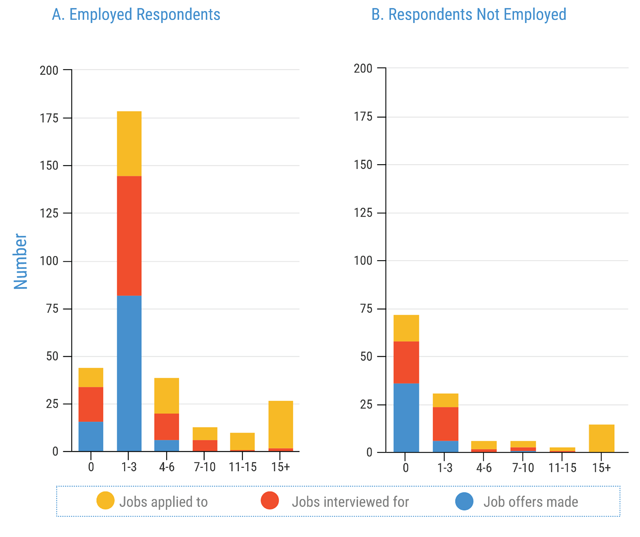
Figure 1
Job Applications, Interviews and Offers.
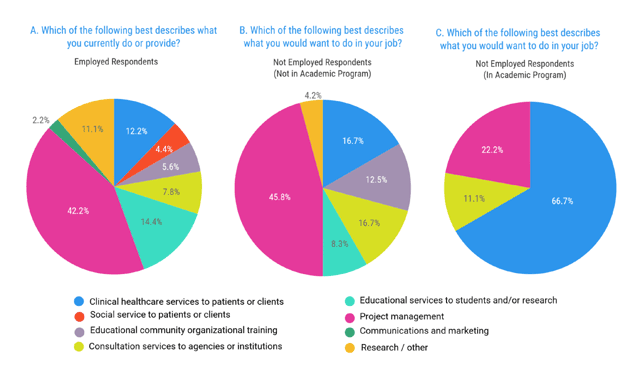
Figure 2
Employment Services Type.
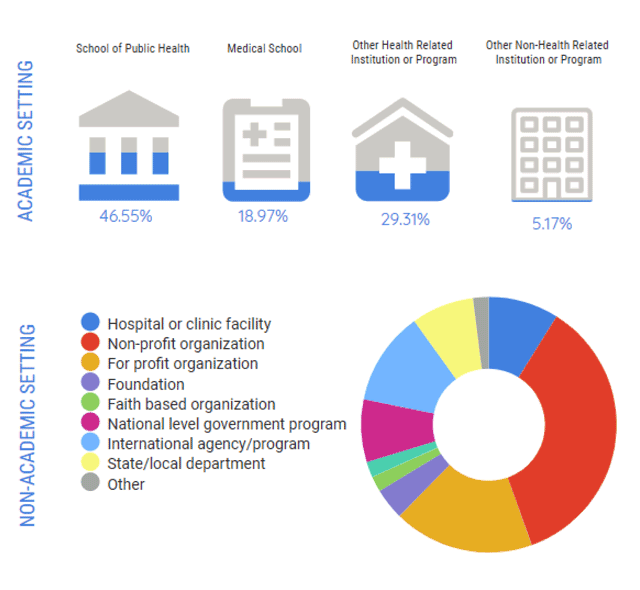
Figure 3
Current Academic or Non-Academic Employment Setting.
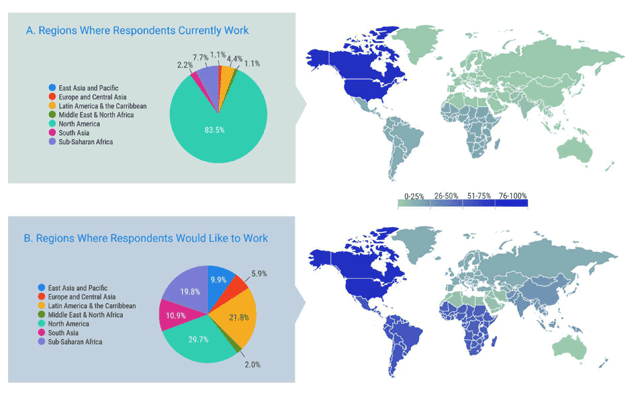
Figure 4
Employment Location.
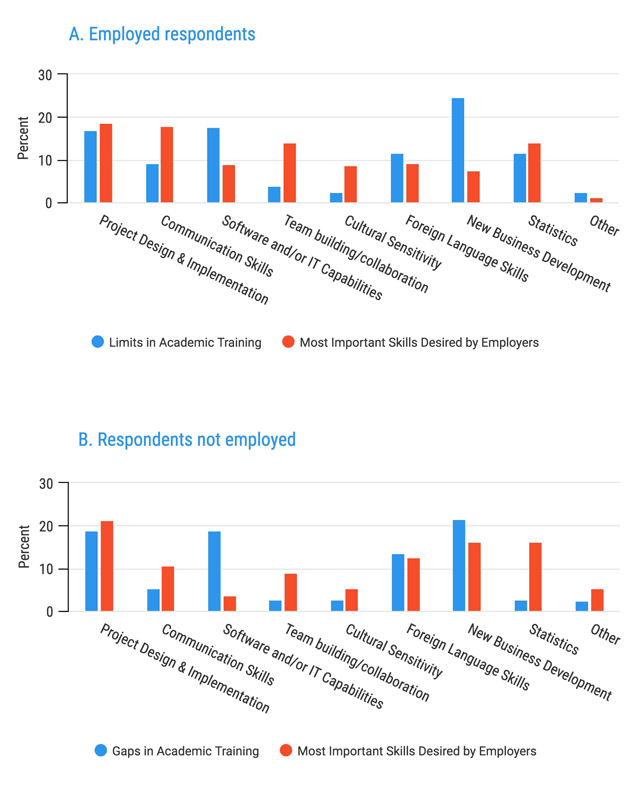
Figure 5
Gaps in Academic Training and Most Important Skills Desired by Employers.
Figure 6
Limitations in Academic Training.
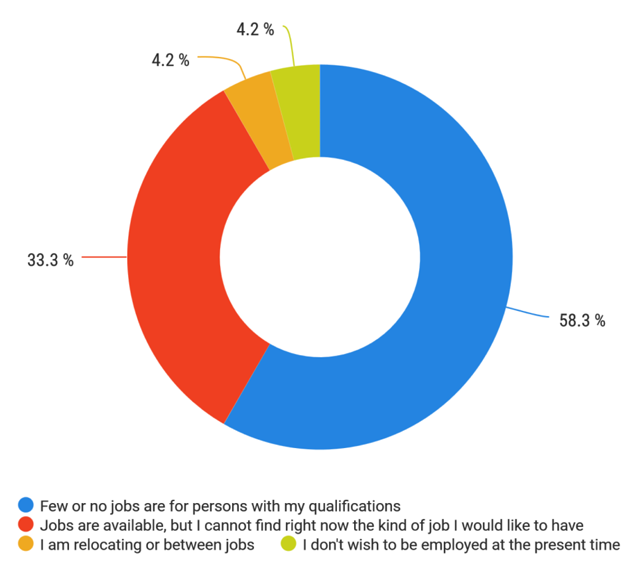
Figure 7
What is the Primary Reason That You Are Now Unemployed?
Table 2
Recommendations for Students, Universities and Employers.
| Major Audience | Recommendations |
|---|---|
| Students |
|
| Universities |
|
| Employers |
|