
Table 1
Demographic characteristics of study participants.
| Age (years, mean ±SD) | 67.5 ±13.1 | ||
| Education (%) | Housing (%) | ||
| Illiterate | 18 | Rented | 23 |
| Incomplete primary | 22 | Owned | 57 |
| Primary | 29 | Belongs to child | 9 |
| Incomplete secondary | 9 | Other | 11 |
| Secondary | 11 | Live alone? (%) | |
| Incomplete University | 1 | Yes | 20 |
| University | 10 | No | 80 |
| Race (%) **Self-Identified** | Work (%) | ||
| Indigenous | 16 | Never worked | 3 |
| Black/Afro Ecuadorian | 3 | Retired | 29 |
| Mestizo | 71 | Unemployed | 22 |
| Mulato | 4 | Working | 46 |
| White | 0 | ||
| Montubio | 5 | ||
| Other | 3 | ||
| No Response | 3 |
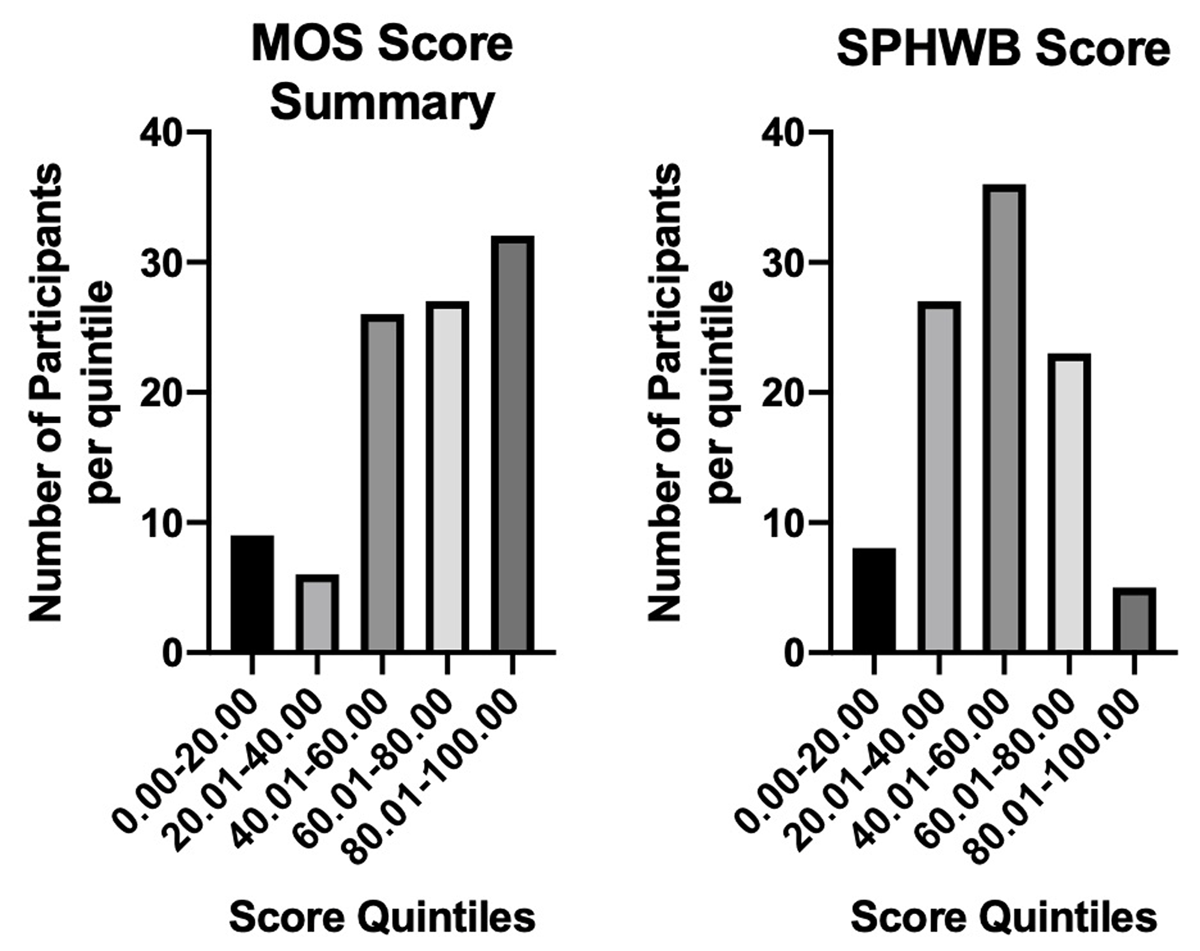
Figure 1
Social Score: MOS and SPHWB.
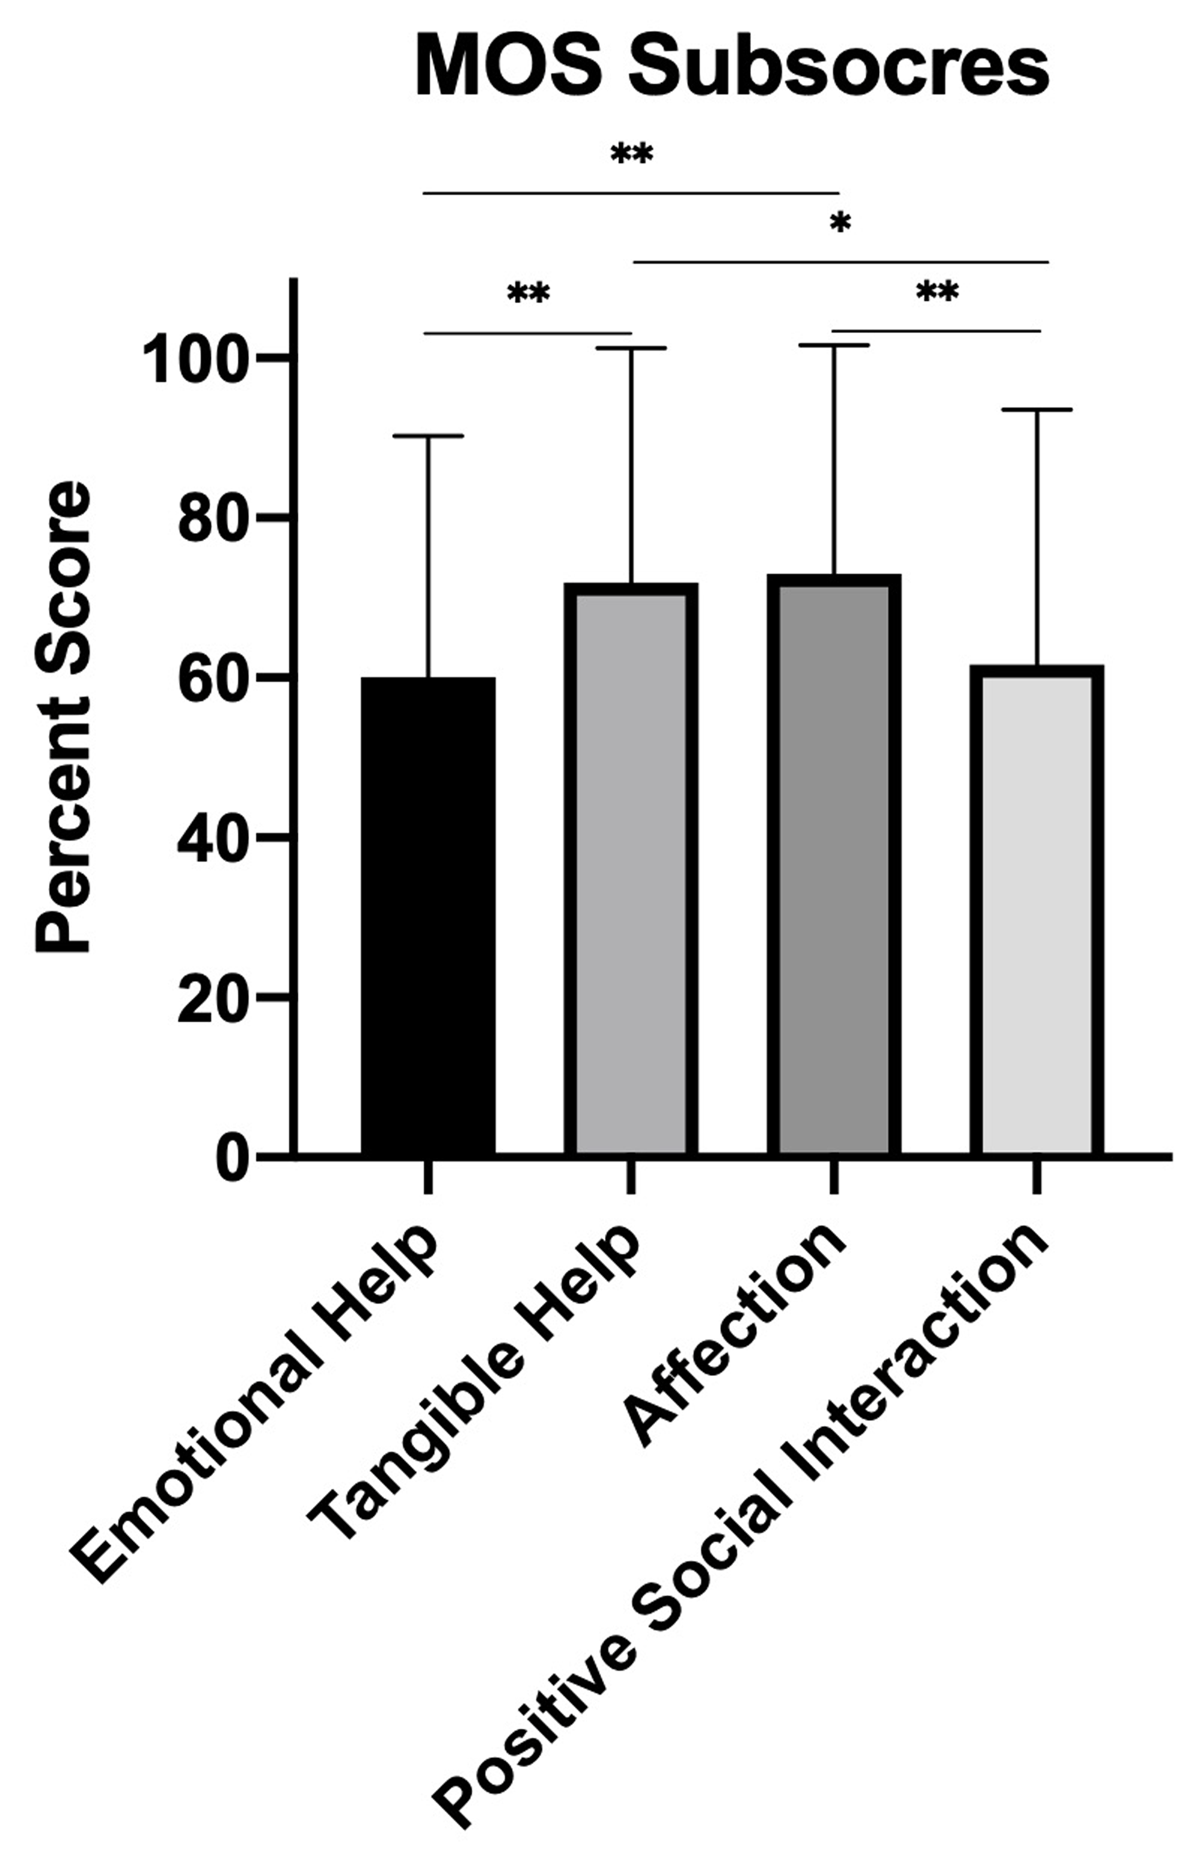
Figure 2
Male Social Participation by MOS subscore.
Table 2
Summary of SPHWB responses.
| Activities | Interpersonal Interaction | ||||||||
|---|---|---|---|---|---|---|---|---|---|
| Familial Outings | Religious Services | Physical Activity | Games | Neighborhood Activities | Volunteering | Time w/ family | Time w/ friends | Time w/ neighbors | |
| Mean (±SD) | 3.300 (1.600) | 2.980 (1.641) | 2.770 (2.169) | 1.919 (1.967) | 1.838 (1.861) | 1.255 (1.278) | 3.270 (1.278) | 1.560 (1.513) | 1.910 (1.664) |
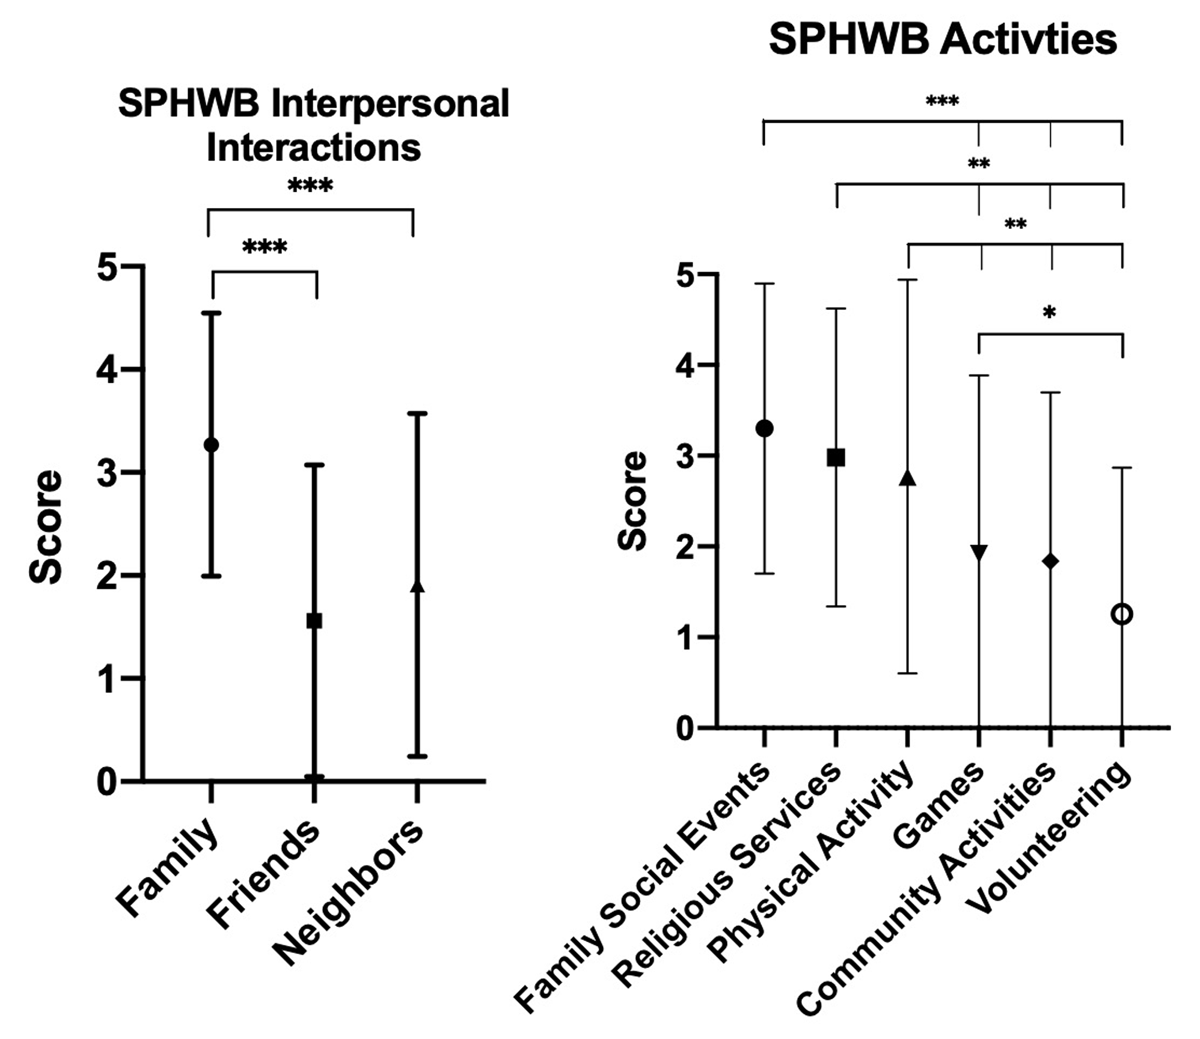
Figure 3
Means of SPHWB subcategories.
Table 3
Regression results for social participation scores and selected demographic characteristics.
| Age | Age Squared | Education | |
|---|---|---|---|
| MOS | –4.364 (1.860)* | 0.031 (0.014)* | 5.070 (1.347)* |
| SPHWB | –0.882 (1.409) | 0.005 (0.011) | 3.370 (1.047)* |
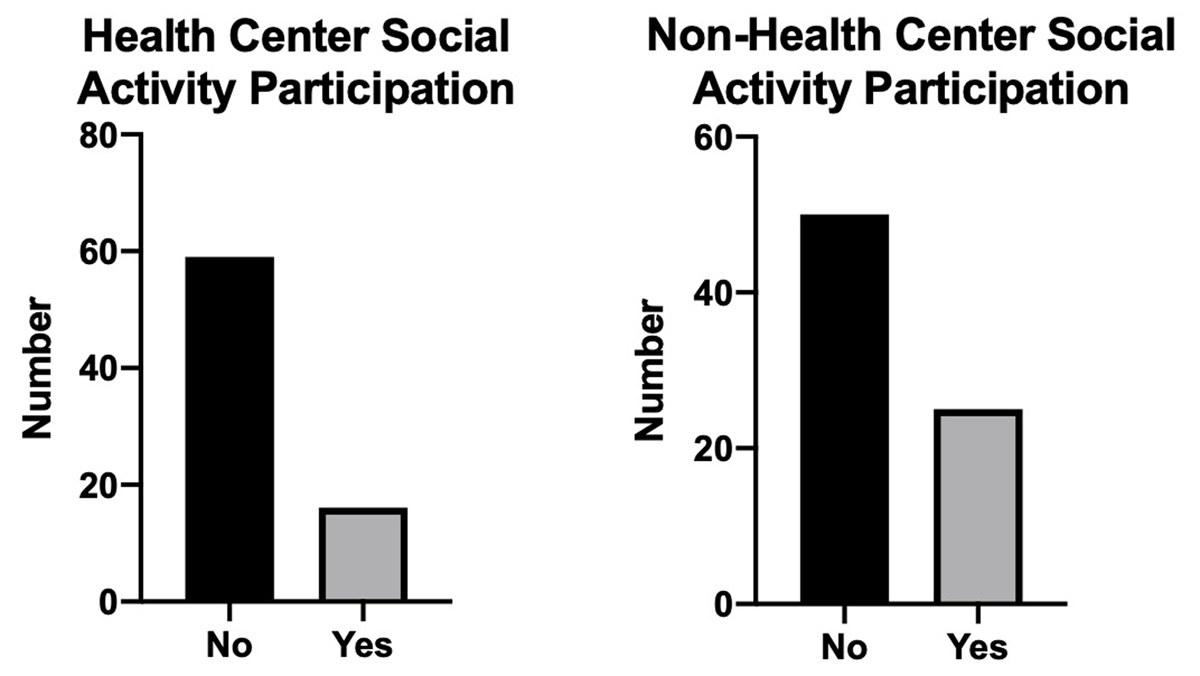
Figure 4
Structured elderly social participation.
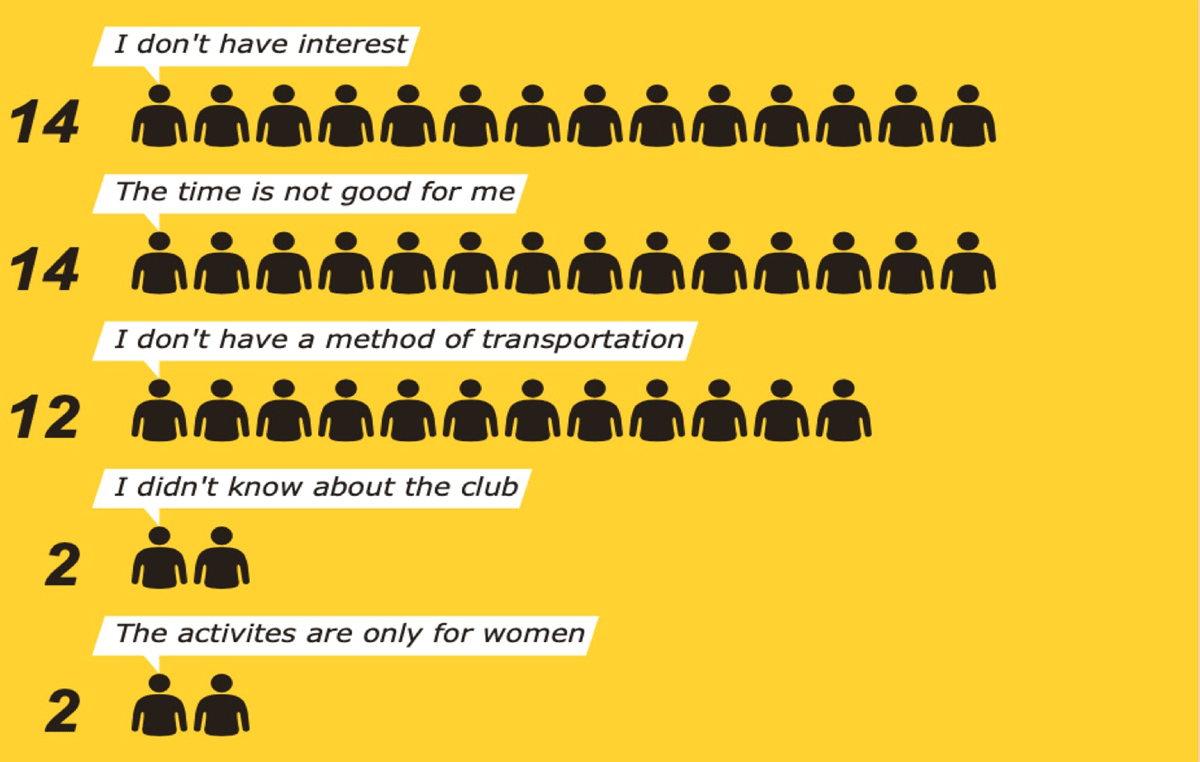
Figure 5
Barriers to Elderly Club Attendance.
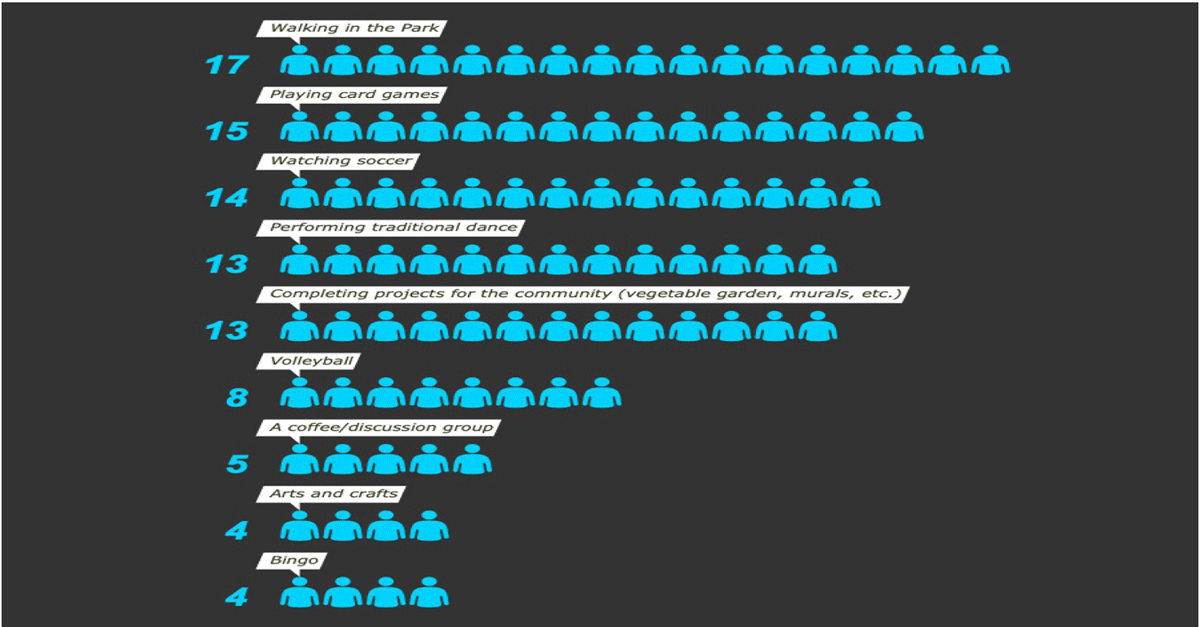
Figure 6
Community Suggested Responses.