
Table 1
Comparison of participants’ general sociodemographic characteristics.
| Demographics | Pretest | Posttest | Total | |
|---|---|---|---|---|
| Gender | Male | 964 | 310 | 1274 |
| Female | 4054 | 1260 | 5314 | |
| Education level | Primary school | 2 | 2 | 4 |
| Junior high school | 36 | 7 | 43 | |
| High school | 212 | 43 | 255 | |
| Undergraduate | 4439 | 1400 | 5839 | |
| Master’s degree | 286 | 117 | 403 | |
| Doctor of Philosophy | 43 | 1 | 44 | |
| Marital status | Unmarried | 1197 | 282 | 1479 |
| Married | 3690 | 1236 | 4926 | |
| Divorced | 114 | 44 | 158 | |
| Widowed | 17 | 8 | 25 | |
| Occupation | Doctor | 1642 | 437 | 2079 |
| Nursing staff | 2658 | 801 | 3459 | |
| Other hospital staff | 718 | 332 | 1050 | |
| Work position | Frontline | 2474 | 585 | 3059 |
| Non-frontline | 2544 | 985 | 3529 | |
| Birth year | After 1950 | 12 | 3 | 15 |
| After 1960 | 441 | 131 | 572 | |
| After 1970 | 934 | 336 | 1270 | |
| After 1980 | 1837 | 724 | 2561 | |
| After 1990 | 1777 | 375 | 2152 | |
| After 2000 | 17 | 1 | 18 | |
| Mean ± standard deviation | 34.46 ± 9.27 | 35.68 ± 8.54 | 34.74 ± 9.07 |
Table 2
Comparison of the pre- and posttest SCL-90 scores of healthcare workers (x̅ ± s).
| Factor | All healthcare workers | Doctors | Nursing staff | Other hospital staff | ||||||||
|---|---|---|---|---|---|---|---|---|---|---|---|---|
| Pre | Post | p | Pre | Post | p | Pre | Post | p | Pre | Post | p | |
| GSI | 0.29 ± 0.40 | 0.26 ± 0.39 | 0.001 | 0.24 ± 0.36 | 0.23 ± 0.40 | 0.479 | 0.34 ± 0.43 | 0.28 ± 0.20 | 0.000 | 0.25 ± 0.36 | 0.24 ± 0.33 | 0.767 |
| PST | 17.70 ± 19.39 | 16.33 ± 20.75 | 0.016 | 14.96 ± 18.12 | 14.21 ± 19.50 | 0.454 | 19.93 ± 20.30 | 17.60 ± 22.06 | 0.005 | 15.71 ± 17.46 | 16.03 ± 18.79 | 0.785 |
| PSDI | 1.36 ± 0.42 | 1.10 ± 0.60 | 0.000 | 1.19 ± 0.57 | 1.07 ± 0.61 | 0.000 | 1.26 ± 0.56 | 1.11 ± 0.60 | 0.000 | 1.19 ± 0.55 | 1.09 ± 0.57 | 0.004 |
| T-S | 26.39 ± 35.60 | 23.03 ± 34.82 | 0.001 | 21.82 ± 32.37 | 20.55 ± 35.75 | 0.479 | 30.33 ± 38.29 | 24.93 ± 36.28 | 0.000 | 22.30 ± 30.24 | 21.71 ± 29.40 | 0.767 |
| SOM | 0.22 ± 0.37 | 0.23 ± 0.40 | 0.427 | 0.18 ± 0.33 | 0.19 ± 0.38 | 0.599 | 0.26 ± 0.40 | 0.27 ± 0.44 | 0.606 | 0.18 ± 0.31 | 0.20 ± 0.34 | 0.519 |
| O-C | 0.45± 0.54 | 0.40 ± 0.53 | 0.001 | 0.36 ± 0.48 | 0.34 ± 0.53 | 0.459 | 0.53 ± 0.57 | 0.44 ± 0.55 | 0.000 | 0.39 ± 0.47 | 0.39 ± 0.48 | 0.825 |
| I-S | 0.32 ± 0.48 | 0.27 ± 0.43 | 0.000 | 0.27 ± 0.44 | 0.25 ± 0.44 | 0.528 | 0.37 ± 0.52 | 0.28 ± 0.45 | 0.000 | 0.27 ± 0.41 | 0.26 ± 0.37 | 0.607 |
| DEP | 0.30 ± 0.47 | 0.26 ± 0.44 | 0.002 | 0.26 ± 0.44 | 0.24 ± 0.47 | 0.547 | 0.33 ± 0.49 | 0.27 ± 0.45 | 0.001 | 0.25 ± 0.41 | 0.24 ± 0.40 | 0.648 |
| ANX | 0.31 ± 0.46 | 0.22 ± 0.41 | 0.000 | 0.26 ± 0.41 | 0.20 ± 0.42 | 0.005 | 0.36 ± 0.50 | 0.24 ± 0.43 | 0.000 | 0.26 ± 0.40 | 0.21 ± 0.34 | 0.035 |
| HOS | 0.27 ± 0.45 | 0.24 ± 0.43 | 0.008 | 0.22 ± 0.41 | 0.20 ± 0.44 | 0.369 | 0.32 ± 0.49 | 0.27 ± 0.46 | 0.010 | 0.22 ± 0.37 | 0.21 ± 0.34 | 0.873 |
| PHOB | 0.31 ± 0.47 | 0.25 ± 0.42 | 0.000 | 0.26 ± 0.43 | 0.26 ± 0.43 | 0.289 | 0.35 ± 0.50 | 0.26 ± 0.44 | 0.000 | 0.27 ± 0.42 | 0.25 ± 0.37 | 0.503 |
| PAR | 0.22 ± 0.39 | 0.19 ± 0.36 | 0.006 | 0.18 ± 0.36 | 0.18 ± 0.39 | 0.870 | 0.25 ± 0.43 | 0.19 ± 0.37 | 0.001 | 0.18 ± 0.33 | 0.18 ± 0.32 | 0.782 |
| PSY | 0.19 ± 0.37 | 0.16 ± 0.35 | 0.001 | 0.15 ± 0.34 | 0.15 ± 0.38 | 0.684 | 0.22 ± 0.40 | 0.17 ± 0.35 | 0.000 | 0.17 ± 0.32 | 0.15 ± 0.30 | 0.587 |
Figure
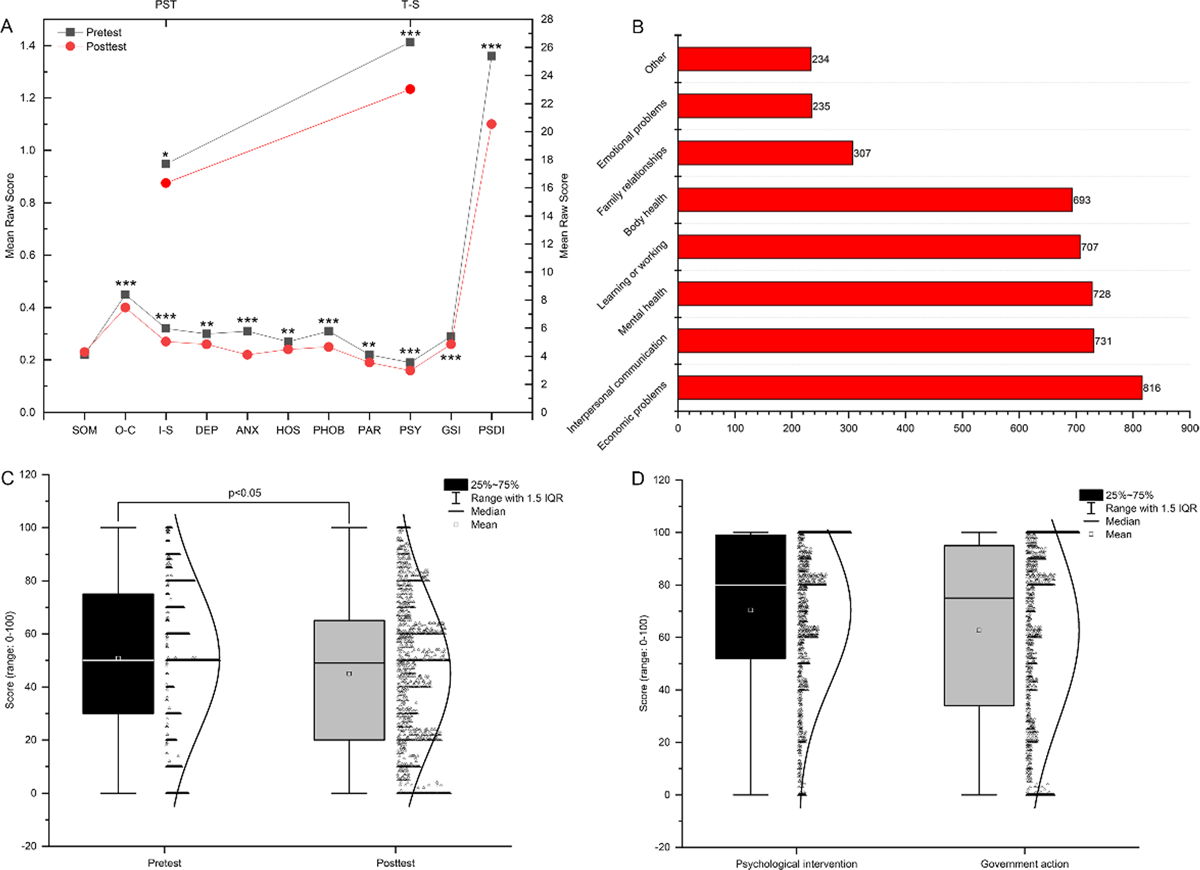
(A) Comparison of all healthcare workers pretest and post-test SCL-90 scores. (B) Impact of the epidemic on life. (C) Pretest and post-test scores for the degree of worry about the epidemic. (D) Scores for the evaluation of the psychological intervention system and the degree of satisfaction with government.
Table 3
Multivariate logistic regression analysis of different factors on the total score.
| Factor | B | SE | Wald X2 | p | OR | 95% CI |
|---|---|---|---|---|---|---|
| Gender | –0.23 | 0.11 | 4.12 | 0.04 | 0.80 | 0.637–0.992 |
| Age | –0.01 | 0.01 | 6.01 | 0.01 | 0.99 | 0.980–0.998 |
| Marital status | 0.09 | 0.09 | 1.08 | 0.30 | 1.10 | 0.922–1.302 |
| Education level | 0.03 | 0.11 | 0.07 | 0.79 | 1.03 | 0.831–1.274 |
| Occupation | –0.12 | 0.07 | 3.13 | 0.08 | 0.89 | 0.780–1.013 |
| Work position | –0.53 | 0.08 | 39.14 | 0.00 | 0.59 | 0.502–0.697 |
| Constant | –1.04 | 0.55 | 3.64 | 0.06 | 0.35 |