
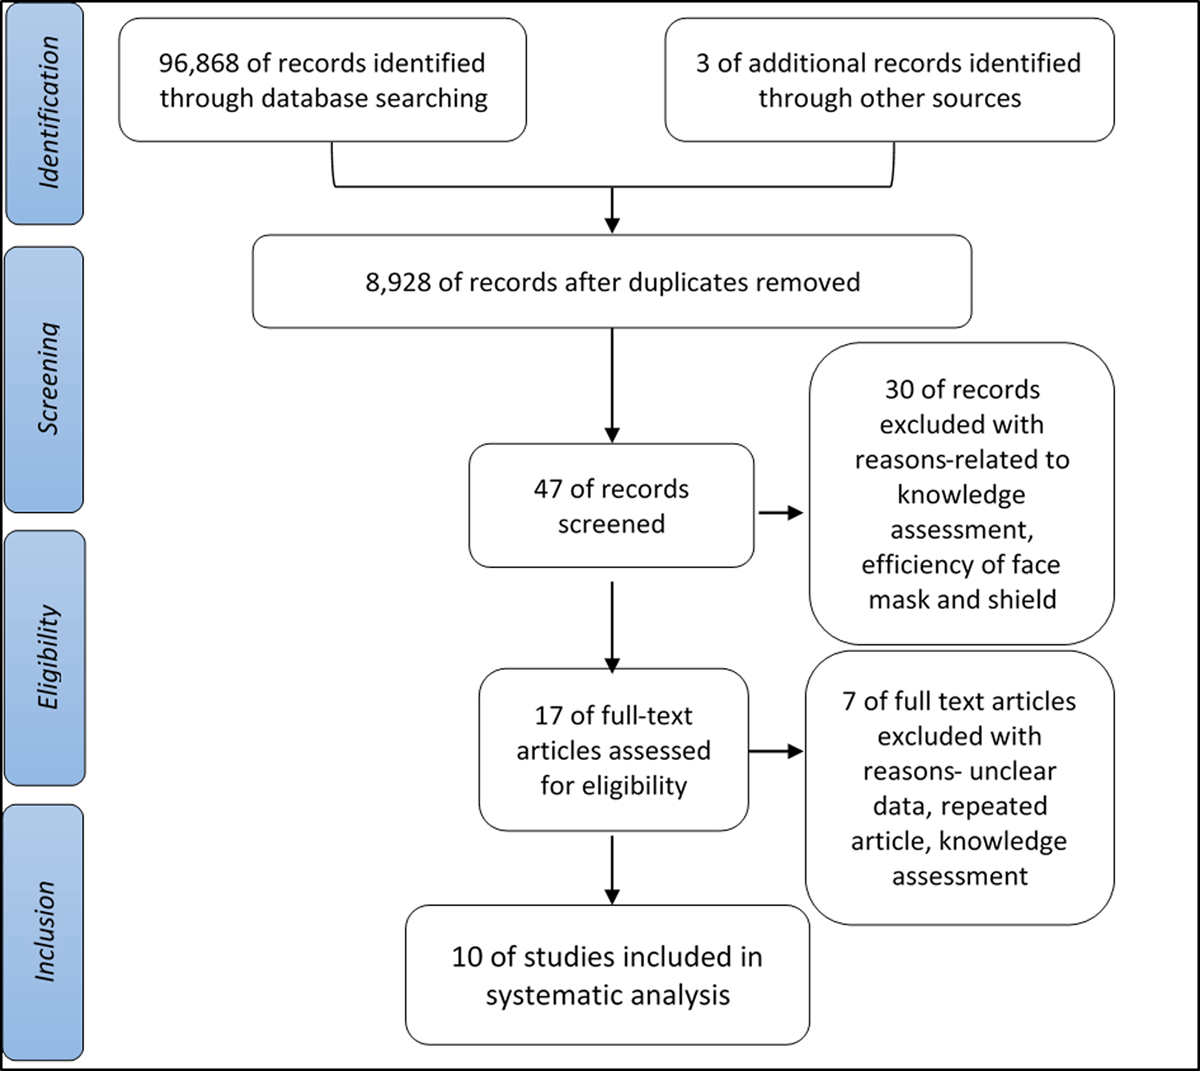
Figure 1
Diagram of the PRISMA flow chart showing a selection of observational studies for review.
Table 1
Quality assessment of the included studies based on the Newcastle Ottawa scale.
| Hendley, 1973 | Nelson, 1982 | Diamond, 1984 | Hatta, 1984 | Nicas, 2008 | Erdozain, 2011 | Elder, 2014 | Johnston, 2014 | Kwok, 2015 | Morito, 2019 | |
|---|---|---|---|---|---|---|---|---|---|---|
| Selection | ||||||||||
| 1) Representativeness of the exposed group. | c (0) | d (0) | b (+1) | b (+1) | c (0) | a (+1) | b (+1) | c (0) | b (+1) | b (+1) |
| a) Truly representative of the average person in community* | ||||||||||
| b) Somewhat representative of the average person in community* | ||||||||||
| c) Selected group of users | ||||||||||
| d) No description of the derivation of the group | ||||||||||
| 2) Selection of the non-exposed group. | c (0) | c (0) | c (0) | c (0) | c (0) | c (0) | c (0) | c (0) | c (0) | c (0) |
| a) Drawn from the same community as the exposed group* | ||||||||||
| b) Drawn from a different source | ||||||||||
| c) No description of the derivation of the non-exposed group | ||||||||||
| 3) Ascertainment of exposure. | b (+1) | b (+1) | b (+1) | b (+1) | b (+1) | b (+1) | b (+1) | b (+1) | b (+1) | b (+1) |
| a) Secured record (e.g. lab)* | ||||||||||
| b) Structured interview or questionnaire* | ||||||||||
| c) Written self-reports | ||||||||||
| d) No description | ||||||||||
| Confounder | ||||||||||
| 1) Comparability of groups on the basis of the design or analysis. | b (+1) | b (+1) | b (+1) | b (+1) | b (+1) | b (+1) a (+1) | b (+1) | b (+1) a (+1) | b (+1) | b (+1) a (+1) |
| a) Study controls for age and sex* | ||||||||||
| b) Study controls for any additional factor* | ||||||||||
| Outcome | ||||||||||
| 1) Assessment of outcome. | a (+1) | a (+1) | a (+1) | a (+1) | a (+1) | a (+1) | a (+1) | a (+1) | a (+1) | a (+1) |
| a) Independent blind assessment* | ||||||||||
| b) Record linkage* | ||||||||||
| c) Self reports | ||||||||||
| d) No description | ||||||||||
| Overall Score (out of 5) | 3 Satisfactory | 3 Satisfactory | 4 Good | 4 Good | 3 Satisfactory | 5 very good | 4 Good | 4 Good | 4 Good | 5 very good |
Table 2
Summary of the included studies.
| Study ID and country | Study sample | Time of observation | Methods of measurement | Outcome | Part of the face touched |
|---|---|---|---|---|---|
| Hendley (5), USA | 89, employees of an Insurance company and their families. | 60 | Observation | Total 62 times touched per hour. 1/3 of total touch was picking noses, 1/2.7 rubbing eyes. | Nose and eyes. Nose was touched more than eyes. |
| Nelson (1), USA | 16, students | 4hr, 9 hr | Observation | mean frequency of touch 13.09 per 5-min interval. | Any part including neck and earrings with pens and water container. |
| Dimond (2), UK | 18, students | 30 | PET computer conducted | mean 13.33 times per 20 minutes. | Mouth (18%), chin (57%), and nose were touched. |
| Hatta (21), Japan and UK | 36, students | 30 | PET computer and magnetic tape data recorder | They were observed in 3 different strata- with no task, listening to music and lecture. For Japanese 4.5, 2.6 and 3 times and British 13.6, 8.8 and 9 times respectively. | Japanese/British Mouth = 17.5/18.3 Chin = 17.5/58.0 Cheek = 7.0/3.4 Nose = 24.6/10.6 Scalp = 8.8/4.8 Ear = 5.3/0.6 Forehead = 5.3/1.4 Eye = 14.0/2.8 |
| Nicas (17), USA | 10, students | 180 | Videotape recording | 15.7 per hour. | Eyes = 7.4, Lips/mouth = 24, Nose = 16 times. |
| Erdozain(16), USA | 574, public visitors to animal petting zoos. | 30 | Observation | Children 77%, adults 69% touched face in total self-touch. | Not specified. |
| Elder (7), USA | 79, health personnel | 120 | Observation | 19 times in two hours. | The mouth was touched twice as often as other parts (nose/eyes). |
| Johnston (18), USA | 93, employees and students from a laboratory. | 337 (average) | Observation | Nose 44.9%, Mouth 4%, Eye 1.7%, Forehead 36.9% and Cheek/Chin 12.5%. | |
| Kwok (19), Australia | 26, medical students | 120 | Videotape recording | 23 times per hour. | 44% = T-zone (36% = mouth, 31% = nose, 27% = eyes, and 6% = combination of these regions) and 56% = non-mucosal areas. |
| Morita (20), Japan | 40 students | 30 | Video monitoring in a simulated cabin | 17.8 times per hour. | T-zone = 42.2% and 57.8% = non-mucosal surface. |
Table 3
Mean (SD) of frequency of face and T-zone touch.
| Variables | Mean | SD | Minimum | Median | Maximum |
|---|---|---|---|---|---|
| Face touched per hour | 50.06 | 47.2 | 9.5 | 31.5 | 162 |
| T-zone touched per hour | 68.70 | 27.2 | 16 | 74 | 100 |
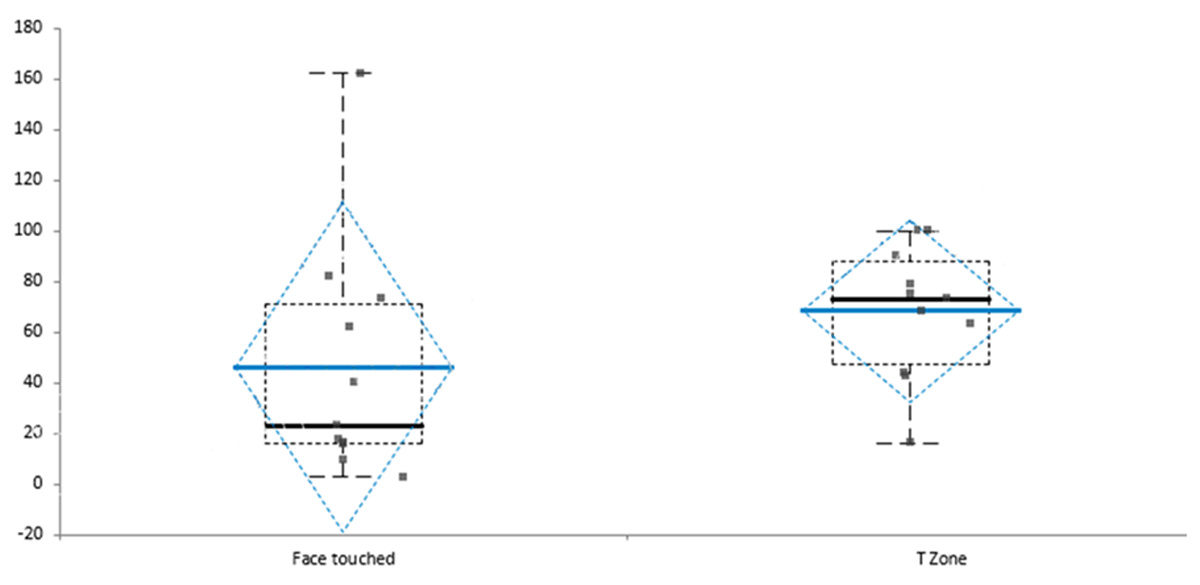
Figure 2
The distribution of the standard deviation of T-zone touch.
Table 4
Correlation coefficient of face touched within T-zone per hour.
| T-zone | Correlation coefficient | |
|---|---|---|
| Face touched | 0.669 | Pearson’s R |
| 0.620 | Spearman’s rs | |
| 0.494 | Kendall’s tau |
Table 5
Chi-square tests showing the frequency of face touch in humans.
| Parts of face | Chi-square value | df | P-value |
|---|---|---|---|
| Eyes | 163.11 | 10 | <0.0001 |
| Nose | 160.67 | 10 | <0.0001 |
| Mouth | 164.71 | 10 | <0.0001 |
| T-zone | 167.63 | 10 | <0.0001 |
Table 6
The ANOVA test for the T-zone touch (N = 11).
| Source | Sum of square (SS) | Degree of freedom (df) | Mean squares (MS) | F | p-value |
|---|---|---|---|---|---|
| Measures | 2.768872E+03 | 1 | 2.768872E+03 | 4.32 | 0.0643* |
| Subjects | 2.238206E+04 | 10 | 2.238206E+03 | ||
| Error or residual | 6.408358E+03 | 10 | 6.408358E+02 | ||
| Total | 3.155929E+04 | 21 | 1.502823E+03 |
[i] Where:
H0: μ1 = μ2 = μ…
The mean of the populations are all equal.
H1: μi ≠ μj for at least one i,j.
The mean of the populations are not all equal.
* Do not reject the null hypothesis at the 0.1% significance level.
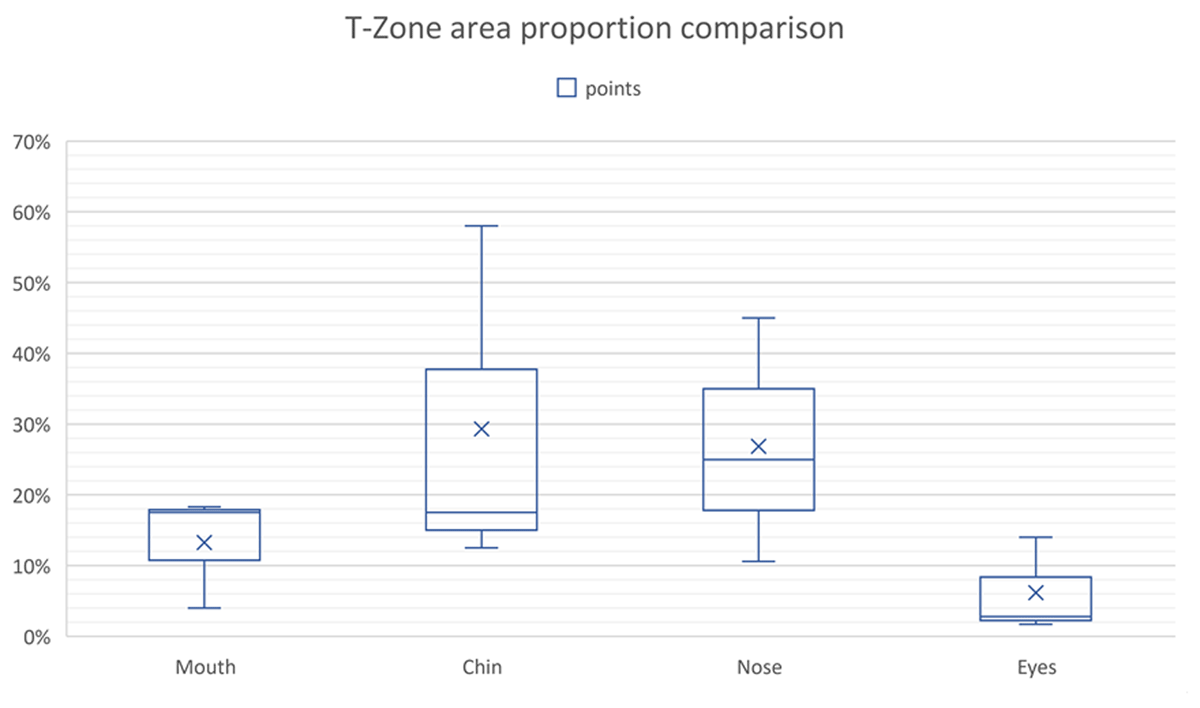
Figure 3
T-zone area proportion comparison based on mean and standard deviation (SD).
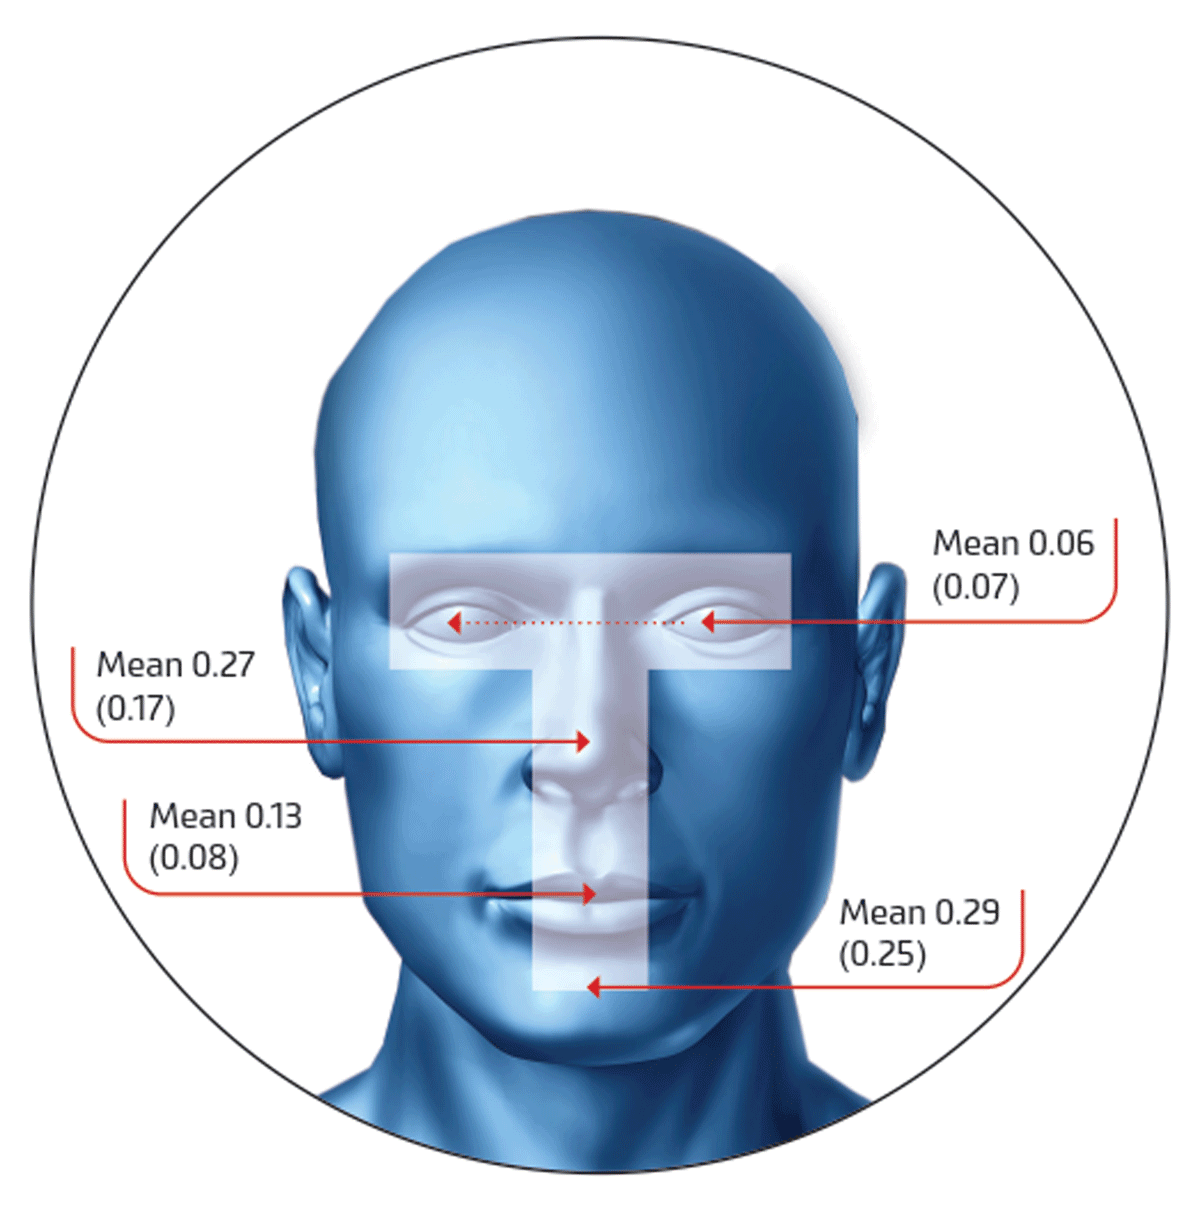
Figure 4
Mean (SD) of the T-zone touch (pooled data).