
Table 1
Demographic and clinical characteristics of surveyed patients, where SD = standard deviation.
| Variable | Count/Mean | Percentage/SD | |
|---|---|---|---|
| Sample size | 101 | ||
| Age (years) | 54.2 | 17.5 | |
| Sex | Male | 39 | 38.6% |
| Female | 62 | 61.4% | |
| Ethnicity | Ganda | 44 | 43.6% |
| Munyankole | 10 | 9.9% | |
| Musoga | 10 | 9.9% | |
| Other | 37 | 36.6% | |
| Marital status | Single | 16 | 15.8% |
| Married | 52 | 51.5% | |
| Separated/Divorced | 10 | 9.9% | |
| Widowed | 23 | 22.8% | |
| Number of people in home | 5.5 | 3.3 | |
| Education achieved | No study | 11 | 10.9% |
| Primary | 51 | 50.5% | |
| Secondary | 20 | 19.8% | |
| University | 19 | 18.8% | |
| Literacy level | Illiterate | 30 | 29.7% |
| Some reading/writing | 22 | 21.8% | |
| Fully literate | 49 | 48.5% | |
| Monthly household income | No income | 63 | 62.4% |
| <50,000 USh | 8 | 7.9% | |
| 50,000–500,000 USh | 22 | 21.8% | |
| 500,000–1,000,000 USh | 7 | 6.9% | |
| >1,000,000 USh | 1 | 1.0% | |
| Employment | Employed | 11 | 10.9% |
| Self-employed | 28 | 27.7% | |
| Unemployed | 57 | 56.4% | |
| Retired | 5 | 5.0% | |
| Self-reported health status | Poor | 30 | 29.7% |
| Fair | 58 | 57.4% | |
| Good | 13 | 12.9% | |
| Excellent | 0 | 0.0% | |
| Years with heart failure | 2.5 | 3.0 | |
| New York Heart Association class | I | 6 | 5.9% |
| I/II | 2 | 2.0% | |
| II | 34 | 33.7% | |
| II/III | 2 | 2.0% | |
| III | 44 | 43.6% | |
| IV | 11 | 10.9% | |
| N/A | 2 | 2.0% | |
| Left ventricular ejection fraction | 39.8% | 15.7% | |
| Primary cause of heart failure | Cardiomyopathy | 42 | 41.6% |
| Hypertension | 24 | 23.8% | |
| Rheumatic heart disease | 17 | 16.8% | |
| Other | 16 | 15.8% | |
| N/A | 2 | 2.0% |
Table 2
Patient responses to technology-related survey items.
| Variable | Count | Percentage | |
|---|---|---|---|
| Sample size | 101 | ||
| Access to weight scale | Yes (at home) | 4 | 4.0% |
| Yes (from a friend) | 4 | 4.0% | |
| Yes (from work) | 3 | 3.0% | |
| Yes (from street) | 1 | 1.0% | |
| No | 89 | 88.1% | |
| Access to blood pressure cuff | Yes (at home) | 8 | 7.9% |
| Yes (from a friend) | 6 | 5.9% | |
| Yes (from work) | 3 | 3.0% | |
| No | 84 | 83.2% | |
| Access to mobile phone | Yes (own phone) | 90 | 89.1% |
| Yes (borrow from a friend) | 9 | 8.9% | |
| No | 2 | 2.0% | |
| Type of mobile phone | Smartphone | 16 | 15.8% |
| Non-smartphone | 84 | 83.2% | |
| No phone | 2 | 2.0% |
Table 3
Patient responses to opinion-based survey items, where SD = standard deviation.
| Survey Item | Mean ± SD | % Agree* | % Neutral† | % Disagree‡ |
|---|---|---|---|---|
| I need to weigh myself every day at home. | 3.2 ± 1.4 | 54.5% | 14.9% | 30.7% |
| It is important to check my blood pressure at home. | 3.8 ± 1.3 | 77.2% | 5.9% | 16.8% |
| I am confident in my ability to care for myself with regard to my heart failure condition. | 3.4 ± 1.2 | 52.5% | 28.7% | 18.8% |
| I know what to do in response to changes in my heart failure symptoms (e.g. shortness of breath or fluid buildup in legs). | 2.8 ± 1.7 | 51.5% | 1.0% | 47.5% |
| I feel comfortable using a mobile phone to send and receive SMS messages. | 2.7 ± 1.8 | 45.5% | 2.0% | 52.5% |
| I feel comfortable using a mobile phone to interact with an interactive voice response system. | 2.7 ± 1.8 | 46.5% | 1.0% | 52.5% |
| I feel comfortable using a mobile phone for the purposes of mobile money. | 3.2 ± 1.7 | 63.4% | 1.0% | 35.6% |
[i] * % Agree = percentage of responses as either Agree (4) or Strongly Agree (5).
† % Neutral = percentage of responses as Neither Agree or Disagree (3).
‡ % Disagree = percentage of responses as either Disagree (2) or Strongly Disagree (1).
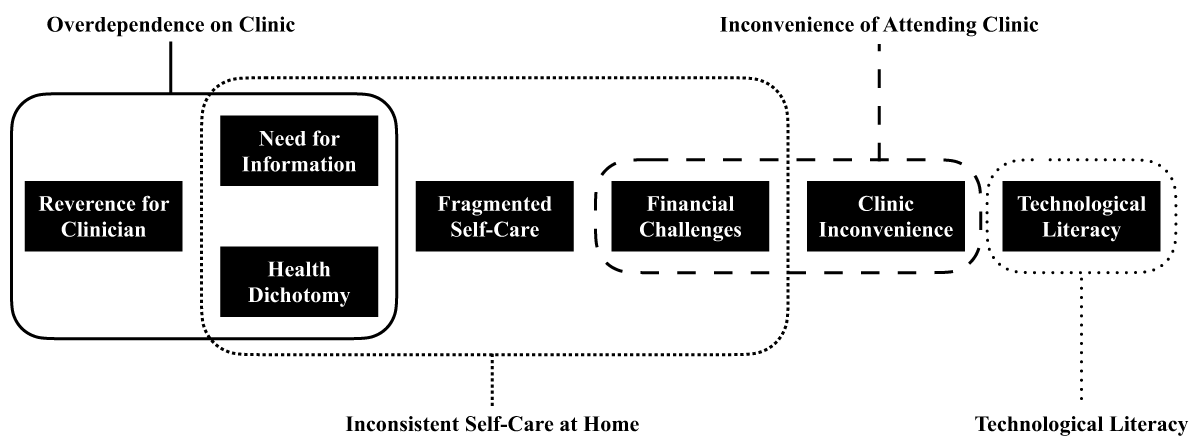
Figure 1
Summary of the seven themes and four theme clusters emerging in the qualitative analysis.