
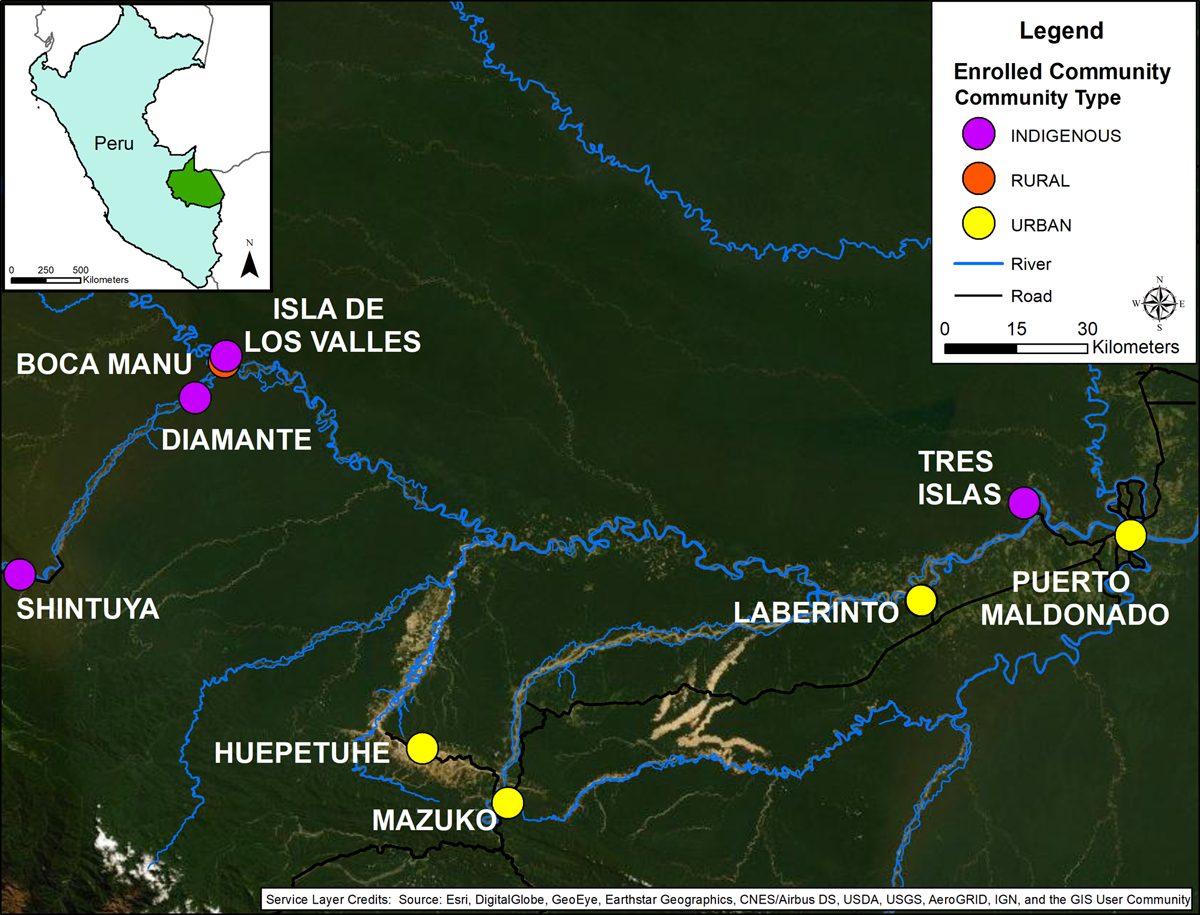
Figure 1
Project Site Map. Site map with communities identified as indigenous (purple), non-indigenous rural (orange) or non-indigenous urban (yellow).
Table 1
Mean hemoglobin (g/dL) and anemia status by age group prior and post government legislation passed in 2017.
| Ages | Prior (2014–2017) | Post (2018) | ||||||
|---|---|---|---|---|---|---|---|---|
| Mean Hemoglobin | Not Anemic | Anemic | Prevalence (%) | Mean Hemoglobin | Not Anemic | Anemic | Prevalence (%) | |
| 2–4 Years Old | 11.14 | 115 | 92 | 44 | 11.69 | 161 | 46 | 22*** |
| 5–7 Years Old | 11.50 | 132 | 116 | 47 | 11.94 | 170 | 78 | 31** |
| 8–11 Years Old | 11.97 | 166 | 67 | 29 | 12.53 | 201 | 32 | 14*** |
| All Ages | 11.55 | 413 | 275 | 40 | 12.06 | 532 | 156 | 23*** |
[i] *** p < 0.0001; ** p < 0.01; * p < 0.05.
Table 2
Logit model results for anemic status (Yes/No) with all ages and by age group (2–4, 5–7, and 8–11), rural community excluded.
| All Ages Combined1 | 2–4 year olds1 | 5–7 Year olds1 | 8–11 year olds1 | |||||
|---|---|---|---|---|---|---|---|---|
| Odds Ratio | (95% CI) | Odds Ratio | (95% CI) | Odds Ratio | (95% CI) | Odds Ratio | (95% CI) | |
| Intervention: Post (vs. Prior)2 | 0.31 | (0.17– 0.54)*** | 0.42 | (0.15–1.12). | 0.31 | (0.11–0.86)* | 0.21 | (0.07–0.53)** |
| Age (Years) Continuous (separate model) | 0.71 | (0.53–0.95)* | ns | 0.71 | (0.56–0.88)** | |||
| Age3 2–4 year olds | 2.09 | (1.38–3.18)*** | ||||||
| 5–7 year olds | 2.16 | (1.43–3.26)*** | ||||||
| 8–11 year olds | Ref | |||||||
| Sex: Male (vs. Female) | ns | ns | 1.49 | (01.01–2.21)* | ns | |||
| Community: URBAN (vs. Native) | ns | 1.21 | (0.55–2.73) | 0.87 | (0.32–2.36) | 0.23 | (0.10–0.45)*** | |
| Community Income (PEN) | 0.77 | (0.51–1.14) | ns | ns | 0.49 | (0.30–0.78)** | ||
| Mining Community: Yes (vs. No) | 0.65 | (0.33–1.28) | 0.32 | (0.17–0.60)*** | 0.75 | (0.34–1.66) | ns | |
| Interactions | ||||||||
| Intervention:* 2–4 yrs (vs. 8–11 yrs) | 0.83 | (0.43–1.59) | ||||||
| Intervention:* 5–7 yrs (vs. 8–11 yrs) | 1.38 | (0.74–2.57) | ||||||
| Intervention* URBAN | 0.64 | (0.19–2.15) | 1.28 | (0.32–5.11) | 3.28 | (1.09–10.99)* | ||
[i] 1. The log-odds intercept for each model is, respectively (All Ages to 8–11 year olds): 2.41 (95% CI: 0.18–31.85); 1.52 (95% CI: 0.97–2.41); 1.18 (95% CI: 0.70–1.99); and 1.12 (95% CI: 0.68–1.88).
2. The marginal (population) effects and 95% CIs of the intervention for each age category (All Ages, 2–4, 5–7, 8–11 years) were, respectively: 0.32 (0.21–0.48); 0.34 (0.19–0.60); 0.35 (0.19–0.64); and 0.38 (0.21–0.68).
3. Age is categorical for the All Ages Combined model, but continuous for the age-specific models. Age is centered at 3, 6, and 9 years for the 2–4, 5–7, and 8–11 year old models, respectively.
*** p < 0.0001; ** p < 0.01; * p < 0.05; . p < 0.10.
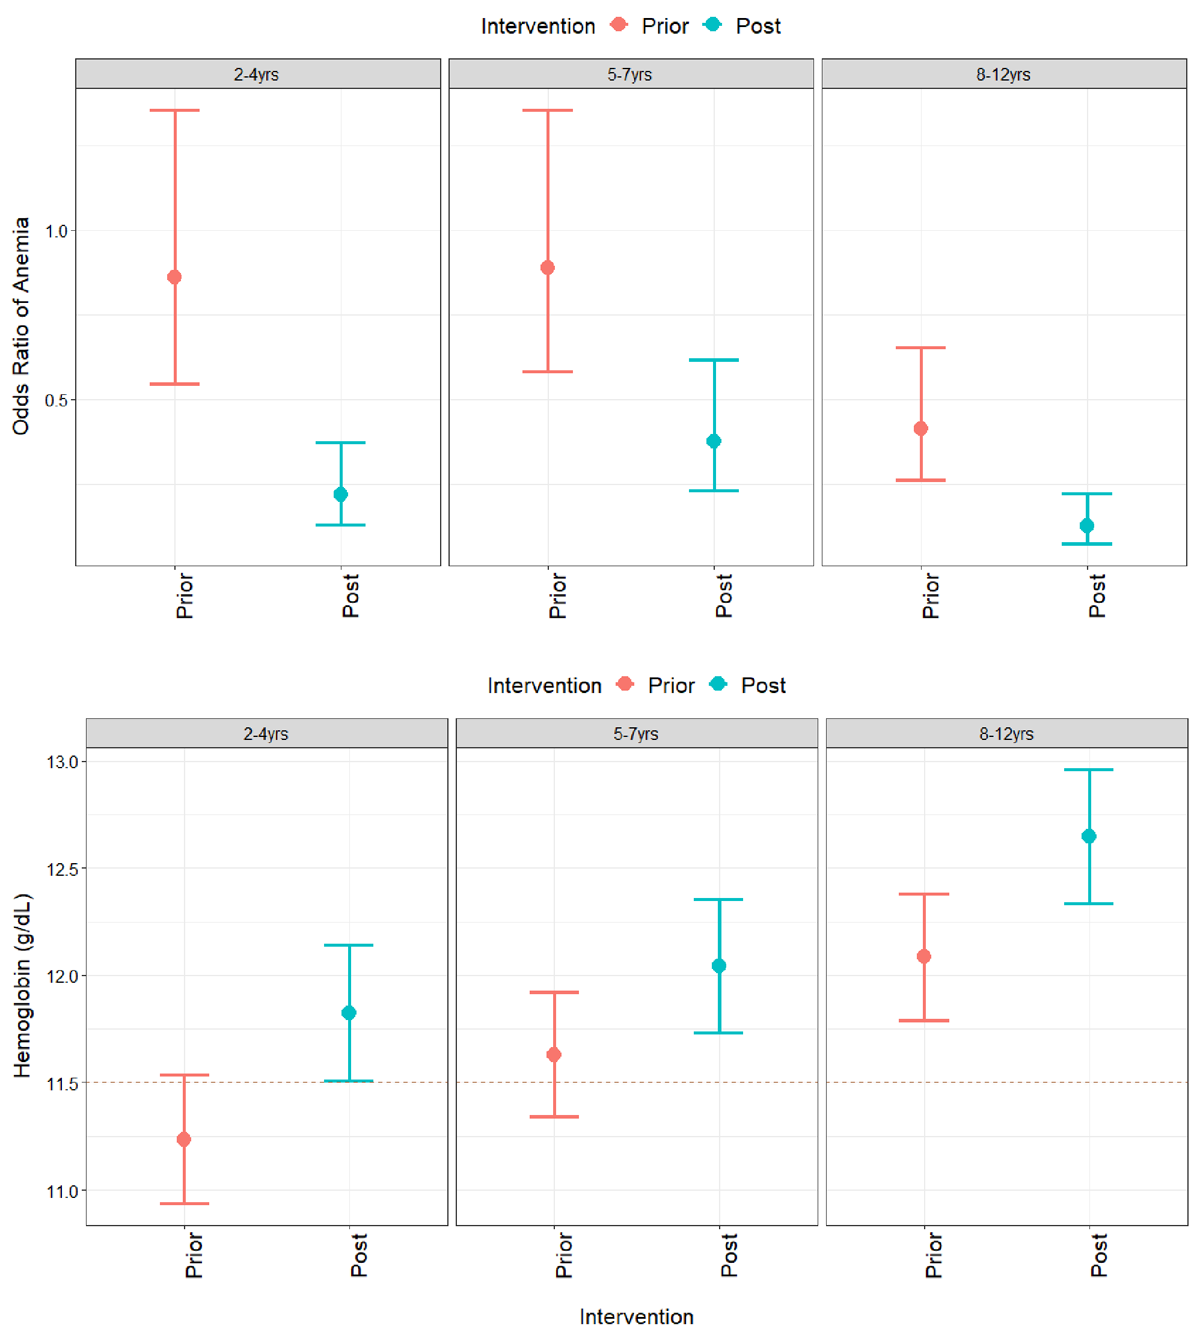
Figure 2
Model Estimates of Anemia Prevalence and Hemoglobin Levels by Age Group. Model adjusted intervention effects for the odds ratio of anemia (top panel) and blood hemoglobin levels (bottom panel) with 95% confidence intervals by age group. Model estimates incorporate mean age, household income and other covariates from the model selection procedure (Tables 2–4). Levels prior to (red) and post (blue) the 2017 government legislation are shown along with a dotted line indicating Peru’s Ministry of Health definition of anemia for children 5–11 years old; the value for children ages 2–4 is below 11.0 g/dL (see Method for WHO cut-offs).
Table 3
Linear model results for hemoglobin (g/dL) with all ages and and by age group (2–4, 5–7, and 8–11), rural community excluded.
| All Ages Combined1 | 2–4 year olds1 | 5–7 Year olds1 | 8–11 year olds1 | |||||
|---|---|---|---|---|---|---|---|---|
| Beta | (95% CI) | Beta | (95% CI) | Beta | (95% CI) | Beta | (95% CI) | |
| Intervention: Post (vs. Prior)2 | 0.56 | 0.(32–0.81)*** | 0.89 | (0.45–01.32)*** | 0.21 | (–0.36–0.78) | 0.90 | (0.52–1.29)*** |
| Age (Years) | 0.26 | (0.14–0.39)*** | ns | 0.21 | (0.12–0.31)*** | |||
| Age3 2–4 year olds | –0.85 | (–1.06––0.64)*** | ||||||
| 5–7 year olds | –0.45 | (–0.66––0.25)*** | ||||||
| 8–11 year olds | REF | |||||||
| Sex: Male (vs. Female) | Ns | ns | –0.18 | (–0.38–0.02). | ns | |||
| Community: URBAN (vs. Native) | ns | ns | 0.37 | (–0.47–1.21) | 0.65 | (0.31–0.99)*** | ||
| Community Income (PEN) | ns | ns | ns | 0.24 | (0.03–0.45)* | |||
| Mining Community: Yes (vs. No) | 0.38 | (–0.10–0.87) | 0.36 | (0.11–0.61)** | ns | ns | ||
| Interactions | ||||||||
| Intervention:* 2–4 yrs (vs. 8–11 yrs) | 0.02 | (–0.27–0.32) | ||||||
| Intervention:* 5–7 yrs (vs. 8–11 yrs) | –0.15 | (–0.43–0.13) | ||||||
| Intervention* URBAN | –0.49 | (–1.01–0.03). | 0.3. | (–0.41–1.01) | –0.56 | (–1.02––0.11)* | ||
[i] 1. The intercept for each model is respectively (All Ages to 8–11 years old): 11.89 (95% CI: 11.59–12.21); 10.73 (95% CI: 10.52–10.94); 11.25 (95% CI: 10.77–11.74); 9.97.60 (95% CI: 8.55–11.38).
2. The marginal (population) effects and 95% CIs of the intervention for each age category (All Ages, 2–4, 5–7, 8–11 years) were, respectively: 0.52 (0.33–0.71); 0.65 (0.40–0.90); 0.38 (0.02–0.74); and 0.62 (0.39–0.85).
3. Age is categorical for the All Ages Combined model, but continuous for the age-specific models. Age is centered at 3, 6, and 9 years for the 2–4, 5–7, and 8–11 year old models, respectively.
*** p < 0.0001; ** p < 0.01; * p < 0.05; . p < 0.10.
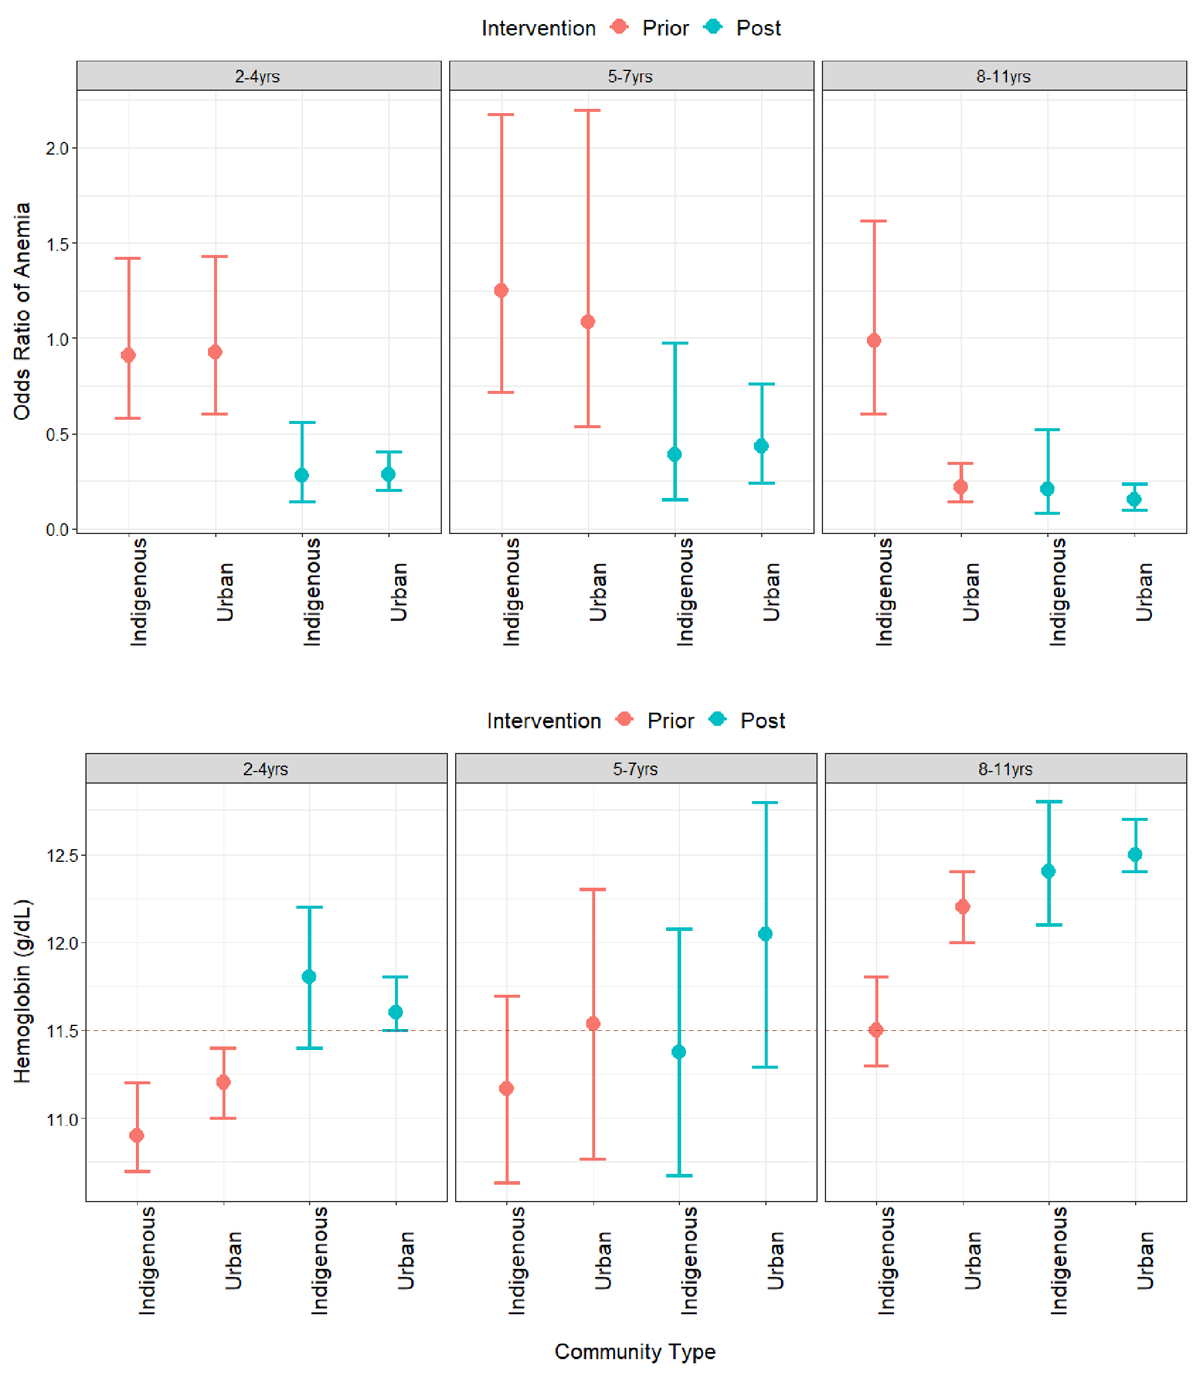
Figure 3
Model Estimates of Anemia Prevalence and Hemoglobin Levels by Community Type. Model adjusted intervention effects for the odds ratio of anemia (top panel) and blood hemoglobin levels (bottom panel) by community type and age group (excluding rural communities). Levels prior to (red) and post (blue) the 2017 government legislation are shown along with a dotted line indicating Peru’s Ministry of Health definition of anemia for children 5–11 years old; the value for children ages 2–4 is below 11.0 g/dL (see Method for WHO cut-offs).