
| i. | Adjust for the size of the population: | |
| n = n/(1+(n–1)/N) | ||
| n = 178/(1+(178–1)/356 | ||
| n = 119 | ||
| where n = 178; N = 119 | ||
| ii. | Adjust for the expected response rate: | |
| The response rate is 0.80 | ||
| therefore n = 119/0.80 | ||
| n = 149 | ||
| iii. | Adjust for the expected proportion eligible: | |
| % Eligible = 0.95 | ||
| therefore n = 149/0.95 | ||
| n = 157 | ||
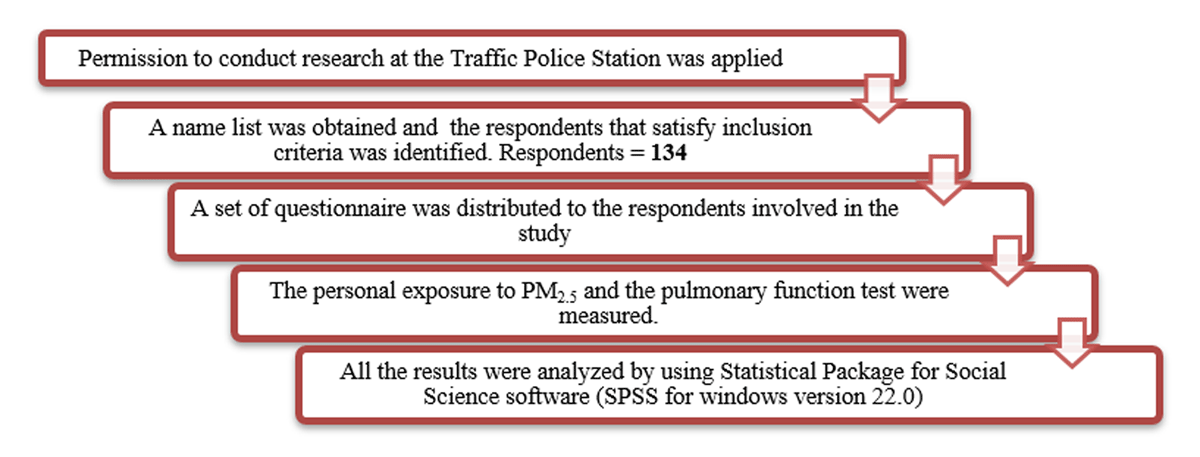
Figure 1
The flow chart of the research procedure.
Table 1
Characteristics of the study population, N = 134.
| Variables | KL | JB | Total | |||
|---|---|---|---|---|---|---|
| F (%) | Mean ± SD | F (%) | Mean ± SD | F (%) | Mean ± SD | |
| Age | ||||||
| 20–30 years old | 18(25.7) | 14(21.9) | 32(23.9) | 35 ± 10.1 | ||
| 31–40 years old | 25(35.7) | 13(20.3) | 38(28.3) | |||
| 41–50 years old | 13(18.6) | 15(23.4) | 28(20.9) | |||
| ≥51 years old | 14(20) | 22(34.4) | 36(26.9) | |||
| Race | ||||||
| Malay | 46(65.7) | 56(87.5) | 102(76.1) | |||
| Chinese | 2(2.9) | 0 | 2(1.5) | |||
| Indian | 1(1.4) | 0 | 1(0.8) | |||
| Others | 21(30) | 8(12.5) | 29(21.6) | |||
| Height (cm) | 70(100) | 170.3 ± 4.8 | 64(100) | 170.7 ± 6.1 | 134(100) | 170.5 ± 5.4 |
| Weight (kg) | 70(100) | 72.0 ± 10.3 | 64(100) | 76.1 ± 13.9 | 134(100) | 74.0 ± 12.5 |
| Educational level | ||||||
| Primary | 0 | 1(1.6) | 1(0.7) | |||
| Secondary | 56(80) | 60(93.7) | 116(86.6) | |||
| Tertiary | 14(20) | 3(4.7) | 17(12.7) | |||
| Marital Status | ||||||
| Single | 26(37.1) | 5(7.8) | 31(23.1) | |||
| Married | 44(62.9) | 59(92.2) | 103(76.9) | |||
| Total | 70 | 64 | 134 | |||
Table 2
Lifestyle characteristics on the subject, N = 134.
| Variables | KL | JB | Total | |||
|---|---|---|---|---|---|---|
| F | (%) | F | (%) | F | (%) | |
| Smoking habitsa | ||||||
| Yes | 57 | 81.4 | 52 | 81.3 | 109 | 81.3 |
| No | 13 | 18.6 | 12 | 18.7 | 25 | 18.7 |
| Physical activityb | ||||||
| Yes | 59 | 84.3 | 52 | 81.3 | 111 | 82.8 |
| No | 11 | 15.7 | 12 | 18.7 | 23 | 17.2 |
| Total | 70 | 64 | 134 | |||
[i] a smoking habit: a physical addiction to tobacco products. Source: Encyclopedia of Children’s Health. In this study, respondents who have experience smoking pipes, cigarettes, or cigars throughout their life would answer yes to the question.
b physical activity: any body movement that works our muscles and requires more energy than resting (e.g. aerobic, muscle-strengthening). Source: National Heart, Lung, and Blood Institute, United States. In this study, respondents with weekly routine physical activity, whether its work out or jogging, as long as it is outside of work.
Table 3
Occupational factors on the subject, N = 134.
| Variables | KL | JB | Total | |||
|---|---|---|---|---|---|---|
| F (%) | Mean ± SD | F (%) | Mean ± SD | F (%) | Mean ± SD | |
| Rank | ||||||
| Constable | 37(52.9) | 5(7.8) | 42(31.3) | |||
| Lance Corporal | 11(15.7) | 14(21.9) | 25(18.7) | |||
| Corporal | 17(24.3) | 38(59.4) | 55(41) | |||
| Sergeant | 5(7.1) | 7(10.9) | 12(9) | |||
| Duration of services | ||||||
| <6 years | 52(74.3) | 20(31.2) | 72(53.7) | 6.5 ± 5.0 | ||
| ≥6 years | 18(25.7) | 44(68.8) | 62(46.3) | |||
| Average working hours | 70(100) | 8.8 ± 2.4 | 64(100) | 10.2 ± 3.3 | 134(100) | 9.5 ± 3.0 |
| Total | 70 | 64 | 134 | |||
Table 4
Lung function status of the traffic policeman.
| Variables | Status | Study Locations Frequencies (%) | Total N = 134 Frequencies (%) | χ2 value | p-value | |
|---|---|---|---|---|---|---|
| KL n = 70 | JB n = 64 | |||||
| FVC% predicted | Abnormal | 61(87.1) | 61(95.3) | 122(91.0) | 2.74 | 0.10 |
| Normal | 9(12.9) | 3(4.7) | 12(9.0) | |||
| FEV1% predicted | Abnormal | 65(92.9) | 61(95.3) | 126(94.0) | 0.36 | 0.55 |
| Normal | 5(7.1) | 3(4.7) | 8(6.0) | |||
[i] *chi-square test.
Table 5
Association between socio-demographic characteristics, lifestyle and occupational factors with pulmonary function among traffic policemen (N = 134).
| Variables | FVC (litre) | FEV1 (litre) | ||||||
|---|---|---|---|---|---|---|---|---|
| Normal | Abnormal | χ2 | p-value | Normal | Abnormal | χ2 | p-value | |
| n(%) | n(%) | n(%) | n(%) | |||||
| Age | ||||||||
| 20–30 years old | 12(85.7) | 56(46.7) | 8(100) | 60(47.6) | ||||
| 31–40 years old | 2(14.3) | 28(23.3) | 8.42 | * | 0 | 30(23.8) | 8.26 | * |
| 41–50 years old | 0(0) | 21(17.5) | (3) | 0 | 21(16.7) | (3) | ||
| ≥51 years old | 0(0) | 15(12.5) | 0 | 15(11.9) | ||||
| Race | ||||||||
| Malay | 7(50) | 95(79.2) | 5(62.5) | 97(77) | ||||
| Chinese | 0 | 1(0.8) | 7.56 | NS | 0 | 1(0.8) | 1.39 | NS |
| Indian | 0 | 2(1.7) | (3) | 0 | 2(1.6) | (3) | ||
| Others | 7(50) | 22(18.3) | 3(37.5) | 26(20.6) | ||||
| Educational level | ||||||||
| Primary | 0 | 1(0.8) | 0 | 1(0.8) | ||||
| Secondary | 13(92.9) | 103(85.8) | 0.57 | NS | 8(100) | 108(85.7) | 1.32 | NS |
| Tertiary | 1(7.1) | 16(13.3) | (1) | 0 | 17(13.5) | (1) | ||
| Marital Status | ||||||||
| Single | 6(42.9) | 25(20.8) | 3.42 | NS | 2(25) | 29(23) | 0.02 | NS |
| Married | 8(57.1) | 95(79.2) | (1) | 6(75) | 97(77) | (1) | ||
| Smoking habitsa | ||||||||
| Yes | 7(50) | 78(65) | 1.22 | NS | 4(50) | 81(64.3) | 0.66 | NS |
| No | 7(50) | 42(35) | (1) | 4(50) | 45(35.7) | (1) | ||
| Physical activityb | ||||||||
| Yes | 102(83.6) | 9(75) | 0.57 | NS | 105(83.3) | 6(75) | 0.37 | NS |
| No | 20(16.4) | 3(25) | (1) | 21(16.7) | 2(25) | (1) | ||
| Rank | ||||||||
| Constable | 9(64.3) | 33(27.5) | 6(75) | 36(28.6) | ||||
| Lance Corporal | 1(7.1) | 24(20) | 8.52 | * | 0 | 25(19.8) | 8.05 | * |
| Corporal | 4(28.6) | 51(42.5) | (4) | 2(25) | 53(42) | (4) | ||
| Sergeant | 0 | 12(10) | 0 | 12(9.5) | ||||
| Duration of services | ||||||||
| <6 years | 10(71.4) | 51(42.5) | 11.0 | *** | 7(87.5) | 54(42.9) | 6.53 | ** |
| ≥6 years | 4(28.6) | 69(57.5) | (1) | 1(12.5) | 72(57.1) | (1) | ||
[i] a smoking habit: a physical addiction to tobacco products. Source: Encyclopedia of Children’s Health. In this study, respondents who have experience smoking pipes, cigarettes, or cigars throughout their life would answer yes to the question.
b physical activity: any body movement that works our muscles and requires more energy than resting (e.g. aerobic, muscle-strengthening). Source: National Heart, Lung, and Blood Institute, United States. In this study, respondents with weekly routine physical activity, whether its work out or jogging, as long as it is outside of work.
*P < 0.05, **P < 0.01, *** P < 0.001; NS, not significant.
Table 6
Relationship between occupational factor with lung function (N = 134).
| Variables | Measured FVC (litre) | Measured FEV1 (litre) | Predicted FVC | Predicted FEV1 | %Ratio FEV1/FVC | |||||
|---|---|---|---|---|---|---|---|---|---|---|
| r value | p value | r value | p value | r value | p value | r value | p value | r value | p value | |
| Average working hours | –3.97 | *** | –3.70 | *** | –0.494 | *** | –0.473 | *** | –0.474 | *** |
[i] #Spearman correlation.
***Significant at p < 0.001.