
Table 1
Demographics.
| N (%) | |
|---|---|
| Age (years) | |
| 18–29 | 58 (42) |
| 30–39 | 49 (36) |
| 40–49 | 12 (9) |
| 50–59 | 12 (9) |
| 60 or greater | 4 (3) |
| Sex | |
| Female | 95 (69) |
| Male | 42 (31) |
| Home Setting | |
| Urban (e.g. city) | 112 (82) |
| Rural | 25 (18) |
| Religion | |
| Christian | 133 (97) |
| Parental Status | |
| Children | 66 (48) |
| No Children | 70 (51) |
| Profession | |
| Nurse | 60 (44) |
| Physician | 19 (14) |
| Pharmacist | 8 (6) |
| Other health workers: | 43 (31) |
| Medical lab scientist | 22 (16) |
| Physical therapist | 4 (3) |
| Midwife | 3 (2) |
| Microbiologist | 3 (2) |
| Dietician | 2 (2) |
| Dentist | 1 (1) |
| Institution | |
| Private | 51 (37) |
| Public | 48 (35) |
| Mission | 34 (25) |
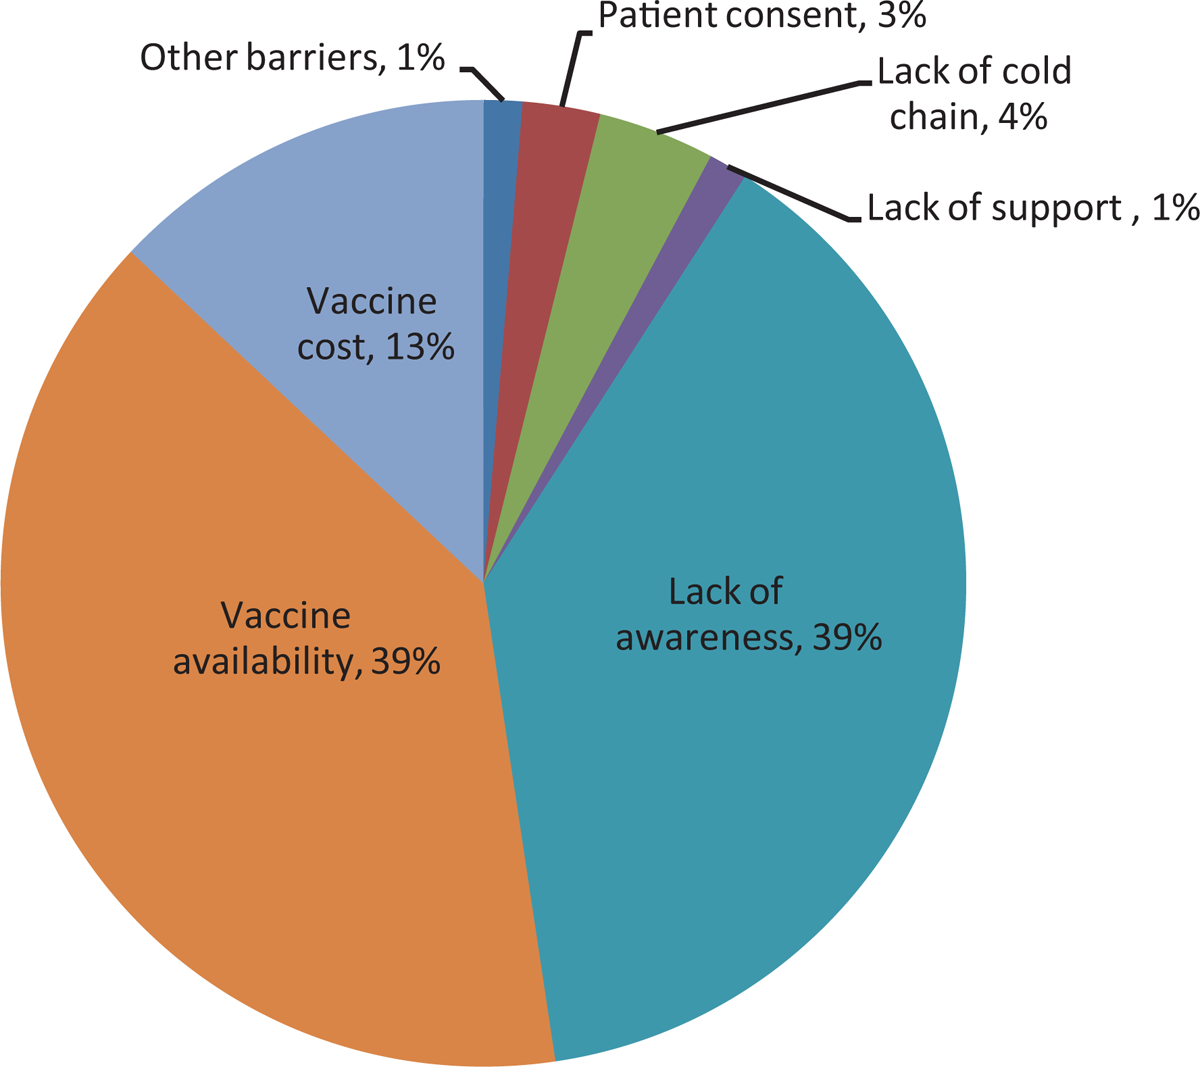
Figure 1
Most Significant Barrier.
Table 2
Barriers Identified by Category.
| Categorized Barriers | |
|---|---|
| Educational |
|
| Access |
|
| Practical |
|
| Other |
|
[i] * Inclusive of key words/phrases written by respondents in the free response portion of survey.
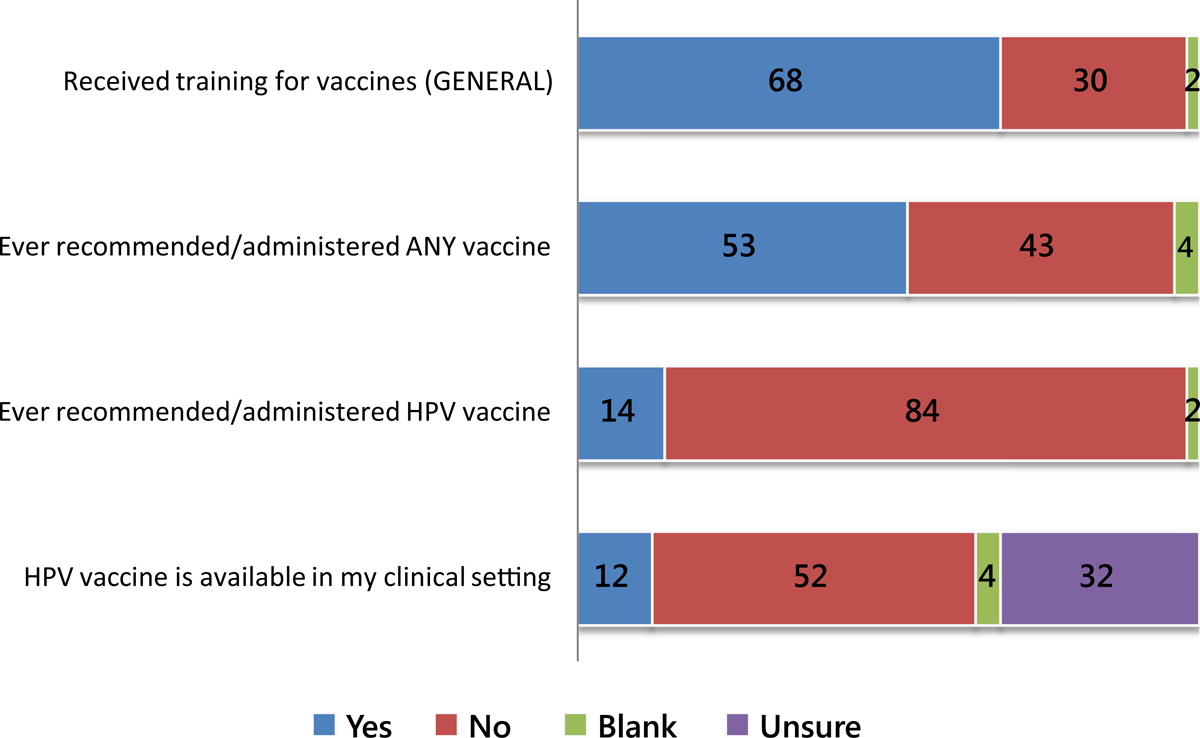
Figure 2
Experiences & Practices (%).
Table 3
Baseline Knowledge Responses Total and By Sex.
| Survey question | Total responses | Correct n (%) | Not Correct | p-value **Correct vs not correct by group | |
|---|---|---|---|---|---|
| Incorrect n (%) | Not sure n (%) | ||||
| HPV puts one at risk for acquiring cervical cancer | 137 | 111 (81) | 8 (6) | 10 (7) | |
| Males | 40 | 38 (95) | 1 (3) | 1 (3) | 0.069 |
| Females | 89 | 73 (82) | 7 (8) | 9 (10) | |
| HPV is sexually transmitted | 137 | 81 (59) | 22 (16) | 28 (20) | |
| Males | 41 | 32 (78) | 5 (12) | 4 (10) | 0.008 |
| Females | 90 | 49 (54) | 17 (19) | 24 (27) | |
| HPV is an infection that only affects women | 137 | 42 (30) | 65 (47) | 22 (16) | |
| Males | 41 | 19 (46) | 12 (29) | 10 (24) | 0.004 |
| Females | 88 | 23 (26) | 53 (60) | 12 (14) | |
[i] * Columns/rows may not add to 100% due to missing data.