
Table 1
Demographic and socio-economic characteristic of subjects (n = 125).
| Variable | n | Percentage (%) | Mean ± SD |
|---|---|---|---|
| Age (years) | 32.49 ± 7.85 | ||
| Gender | |||
| Male | 75 | 60.0 | |
| Female | 50 | 40.0 | |
| Marital status | |||
| Single | 44 | 35.2 | |
| Married | 75 | 60.0 | |
| Divorced | 3 | 2.4 | |
| Widowed | 3 | 2.4 | |
| Religion | |||
| Islam | 50 | 40.0 | |
| Buddhist | 27 | 21.6 | |
| Hindu | 22 | 17.6 | |
| Christian | 26 | 20.8 | |
| Others | 0 | 0 | |
| Nationality | |||
| Indonesia | 25 | 20.0 | |
| Bangladesh | 25 | 20.0 | |
| Myanmar | 25 | 20.0 | |
| Nepal | 25 | 20.0 | |
| Philippines | 25 | 20.0 | |
| Living area | |||
| Village | 97 | 77.6 | |
| City | 28 | 22.4 | |
| Occupation | |||
| Construction worker | 29 | 23.2 | |
| Cleaning worker | 9 | 7.2 | |
| Domestic worker | 20 | 16.0 | |
| Security guard | 15 | 12.0 | |
| Factory worker | 29 | 23.2 | |
| Foodservice worker | 15 | 12.0 | |
| Others | 8 | 6.4 | |
| Working experience in Malaysia | |||
| 0 month–1 year | 25 | 20.0 | |
| 2 years–3 years | 25 | 20.0 | |
| 4 years–5 years | 33 | 26.4 | |
| 6 years–7 years | 20 | 16.0 | |
| >7 years | 22 | 17.6 | |
| Household size | 5.63 ± 1.43 | ||
| 1–5 | 64 | 51.2 | |
| 6–10 | 60 | 48.0 | |
| ≥11 | 1 | 0.8 | |
| Number of children | 1.32 ± 1.32 | ||
| Personal monthly income (RM) | 1215.12 ± 260.23 | ||
| Household monthly income (RM) | 1784.61 ± 575.48 | ||
| ≤1000 | 18 | 14.4 | |
| 1001–1600 | 32 | 25.6 | |
| 1601–2200 | 51 | 40.8 | |
| 2201–2800 | 19 | 15.2 | |
| 2801–3400 | 5 | 4.0 | |
| Income per capita (RM) | 327.48 ± 110.44 | ||
| First priority on spending salary | |||
| Sending back to hometown | 61 | 48.8 | |
| House rental | 52 | 41.6 | |
| Electricity and water | 12 | 9.6 |
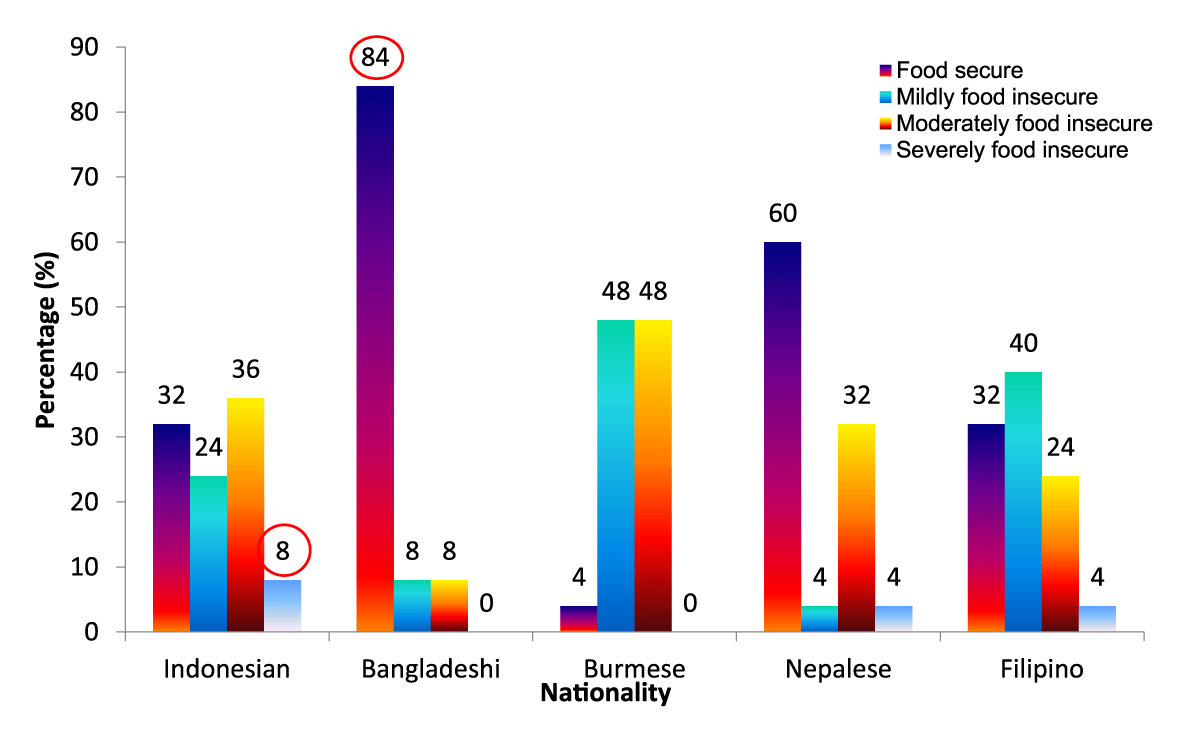
Figure 1
Household food security status of migrant workers by nationality (n = 125).
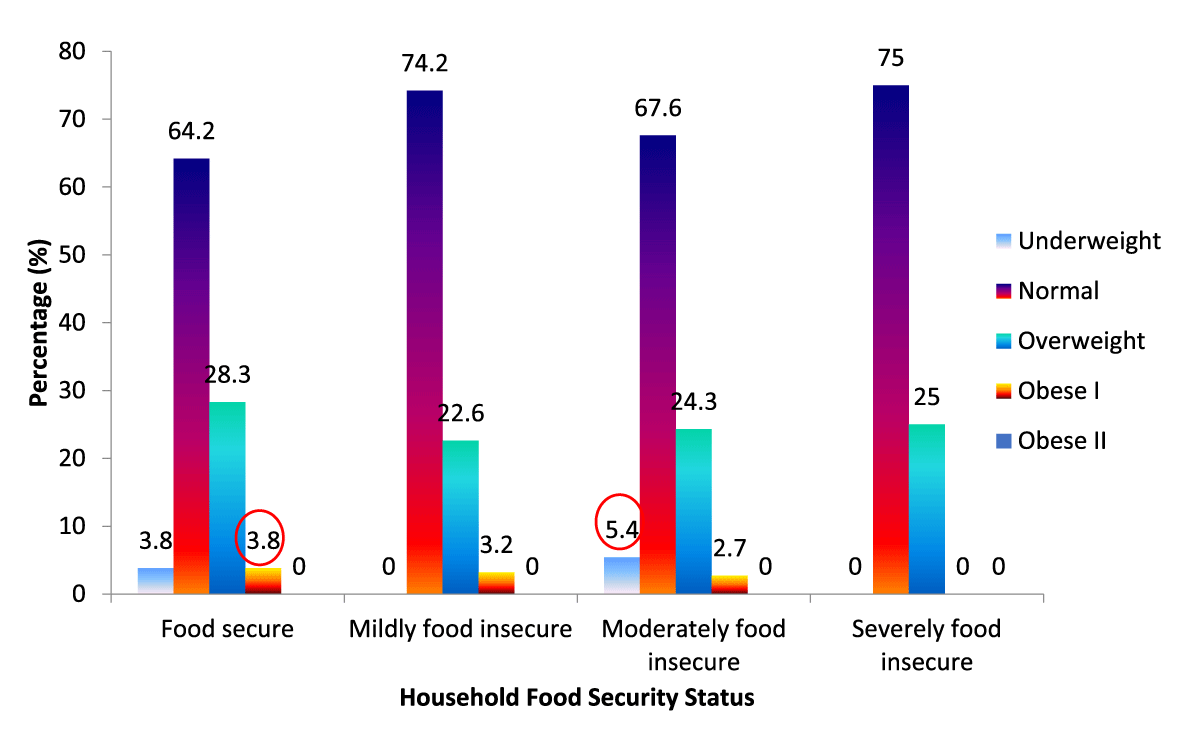
Figure 2
Weight status of migrant workers by nationality (n = 125).
Table 2
Nutrient intakes of migrant workers (n = 125).
| Variable | Mean ± SD |
|---|---|
| Energy (kcal) | 1952.34 ± 662.90 |
| Carbohydrate (g) | 310.11 ± 122.86 |
| Protein (g) | 72.29 ± 24.66 |
| Fat, total (g) | 47.44 ± 21.50 |
| Vitamin C (mg) | 32.80 ± 25.93 |
| Calcium (mg) | 362.87 ± 250.69 |
| Iron (mg) | 14.04 ± 6.19 |
| Dietary fiber, total (g) | 2.36 ± 1.45 |
Table 3
Household monthly income of migrant workers by household food security status (n = 125).
| Variable | Food Secure (n = 53) | Mildly Food Insecure (n = 31) | Moderately Food Insecure (n = 37) | Severely Food Insecure (n = 4) | X2 value | p-value |
|---|---|---|---|---|---|---|
| Household monthly income (RM) | 5.030 | 0.540 | ||||
| ≤1000 | 11 (20.8) | 2 (6.5) | 4 (10.8) | 1 (25.0) | ||
| 1001–1600 | 17 (32.1) | 8 (25.8) | 7 (18.9) | NA | ||
| 1601–2200 | 18 (34.0) | 13 (41.9) | 17 (45.9) | 3 (75.0) | ||
| 2201–2800 | 5 (9.4) | 7 (22.6) | 7 (18.9) | NA | ||
| 2801–3400 | 2 (3.8) | 1 (3.2) | 2 (5.4) | NA |
[i] NA = Not Applicable.
Chi-square test, p < 0.05.
Table 4
Weight status of migrant workers by food security status (n = 125).
| Variable | Food Secure (n = 53) | Mildly Food Insecure (n = 31) | Moderately Food Insecure (n = 37) | Severely Food Insecure (n = 4) | X2 value | p-value |
|---|---|---|---|---|---|---|
| BMI (kg/m2) | 7.995 | 0.535 | ||||
| Underweight | 2 (3.8) | NA | 2 (5.4) | NA | ||
| Normal | 34 (64.2) | 23 (74.2) | 25 (67.6) | 3 (75.0) | ||
| Overweight | 15 (28.3) | 7 (22.6) | 9 (24.3) | 1 (25.0) | ||
| Obese I | 2 (3.8) | 1 (3.2) | 1 (2.7) | NA |
[i] BMI: Body Mass Index.
NA = Not Applicable.
Chi-square test, p < 0.05.
Table 5
Association of Food Insecurity, Household Income, and Nutritional Status among Migrant Workers.
| Test Variables | Pearson R correlation | Description | P value | Remarks |
|---|---|---|---|---|
| Food Insecurity & Household Monthly Income | –0.247 | Very low correlation | 0.294 | Not significant |
| Food Insecurity & Nutritional Status | 0.109 | Very low correlation | 0.687 | Not significant |