
Table 1
Demographic characteristics of participants.
| Year | Male | Proportion | Female | Proportion | Total | Zscore | P-value |
|---|---|---|---|---|---|---|---|
| 0–11 months | 43 | 2.07 | 55 | 1.31 | 98 | 2.286 | 0.022 |
| 1–4 | 223 | 10.72 | 220 | 5.24 | 443 | 7.983 | <0.001 |
| 5–9 | 183 | 8.80 | 247 | 5.88 | 430 | 4.313 | <0.001 |
| 10–14 | 190 | 9.13 | 257 | 6.12 | 447 | 4.367 | <0.001 |
| 15–19 | 177 | 8.51 | 337 | 8.02 | 514 | 0.667 | 0.505 |
| 20–24 | 206 | 9.90 | 341 | 8.12 | 547 | 2.355 | 0.019 |
| 25–29 | 171 | 8.22 | 419 | 9.97 | 590 | –2.238 | 0.025 |
| 30–34 | 116 | 5.58 | 186 | 4.43 | 302 | 2.005 | 0.045 |
| 35–39 | 137 | 6.59 | 382 | 9.09 | 519 | –3.387 | 0.001 |
| 40–44 | 88 | 4.23 | 135 | 3.21 | 223 | 2.057 | 0.040 |
| 45–49 | 111 | 5.34 | 351 | 8.35 | 462 | –4.302 | <0.001 |
| 50–54 | 79 | 3.80 | 311 | 7.40 | 390 | –5.565 | <0.001 |
| 55–59 | 114 | 5.48 | 316 | 7.52 | 430 | –3.014 | 0.003 |
| 60–64 | 64 | 3.08 | 148 | 3.52 | 212 | 0.560 | 0.576 |
| 65–69 | 53 | 2.55 | 190 | 4.52 | 243 | –3.811 | 0.000 |
| 70+ | 125 | 6.01 | 307 | 7.31 | 432 | –1.916 | 0.055 |
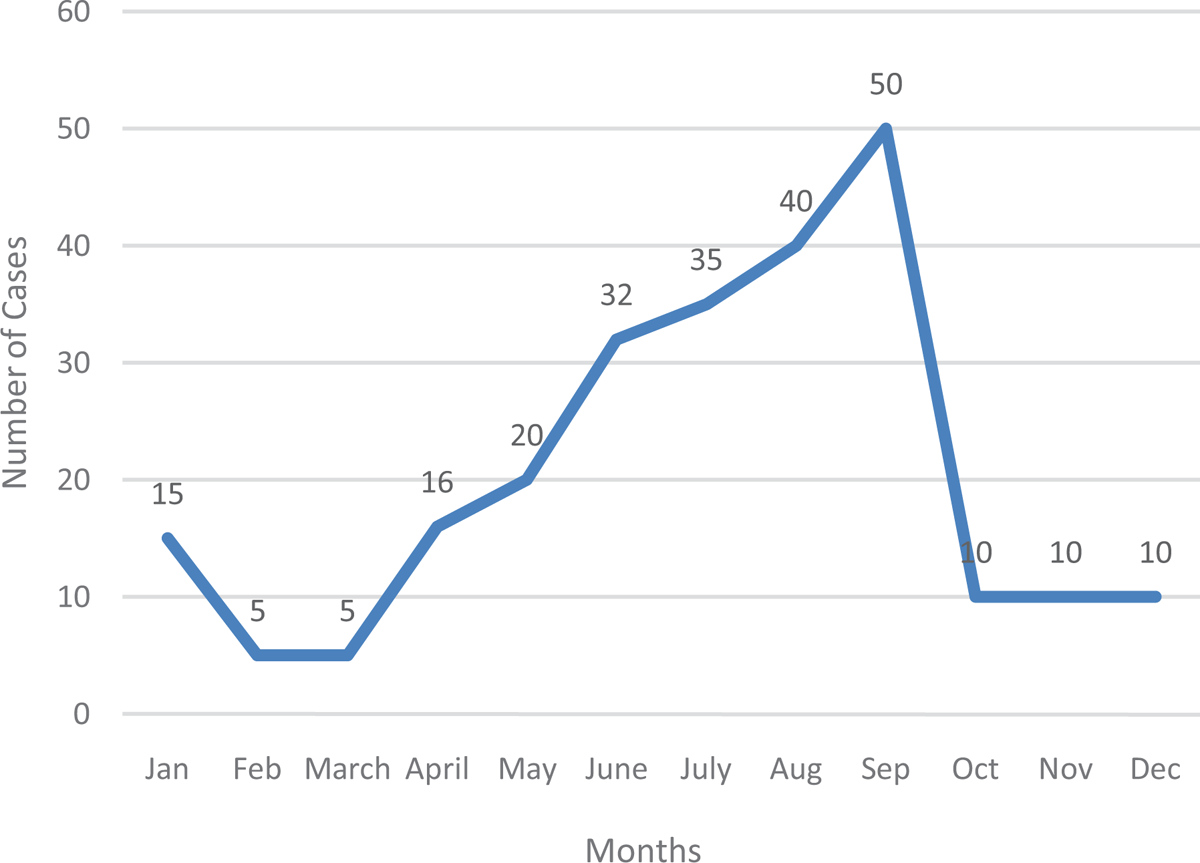
Figure 1
Typhoid Cases in 2012.
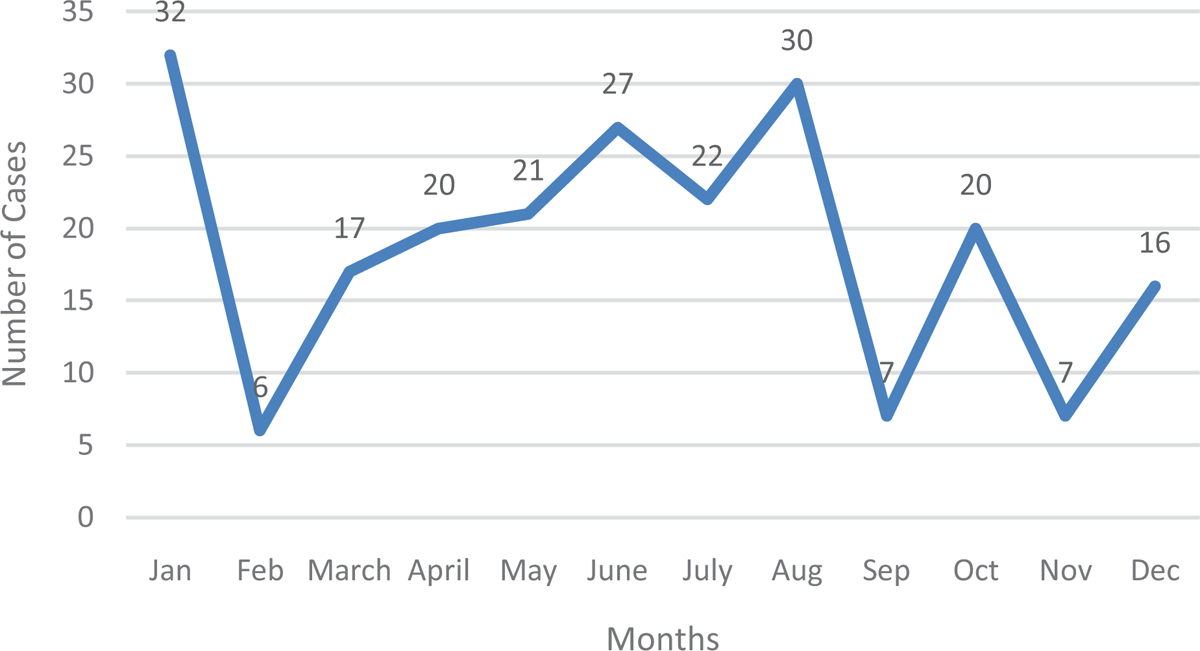
Figure 2
Typhoid Fever in 2013.
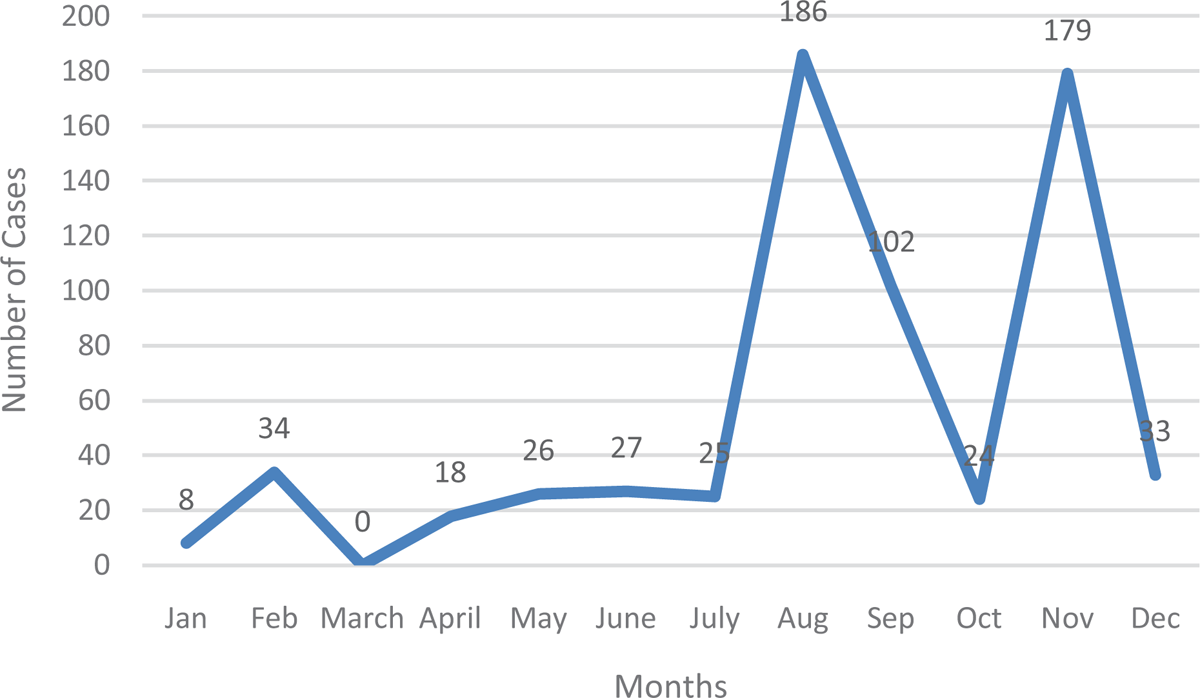
Figure 3
Typhoid Fever Cases in 2014.
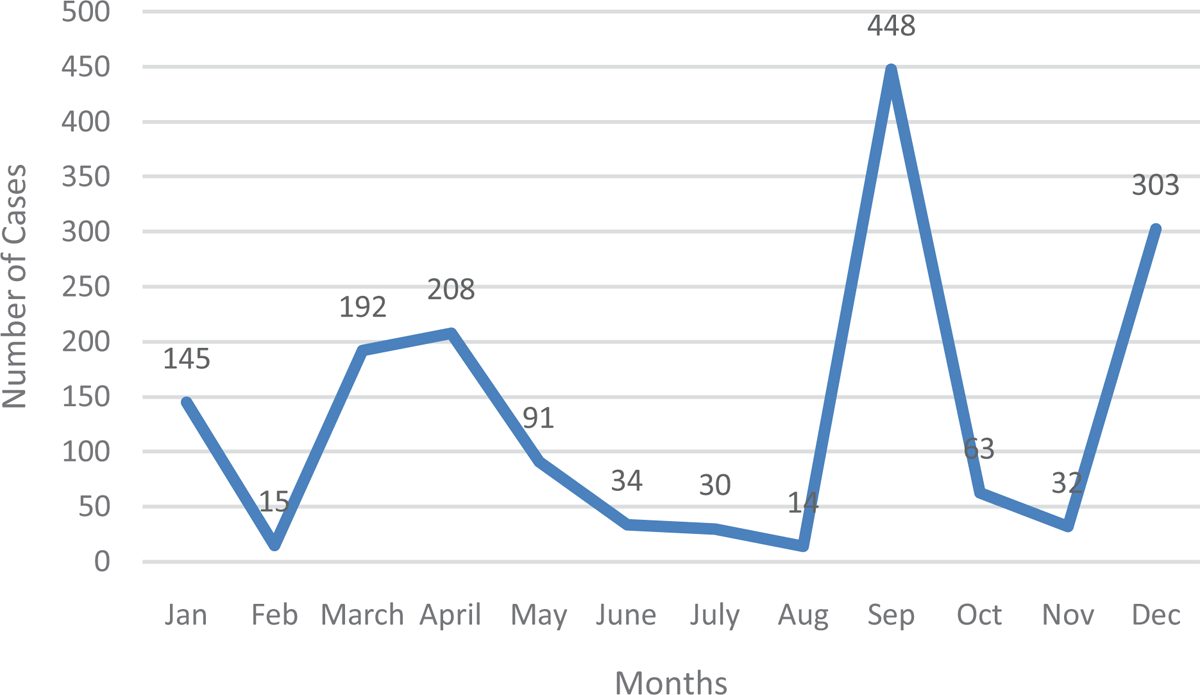
Figure 4
Typhoid Fever Cases in 2015.
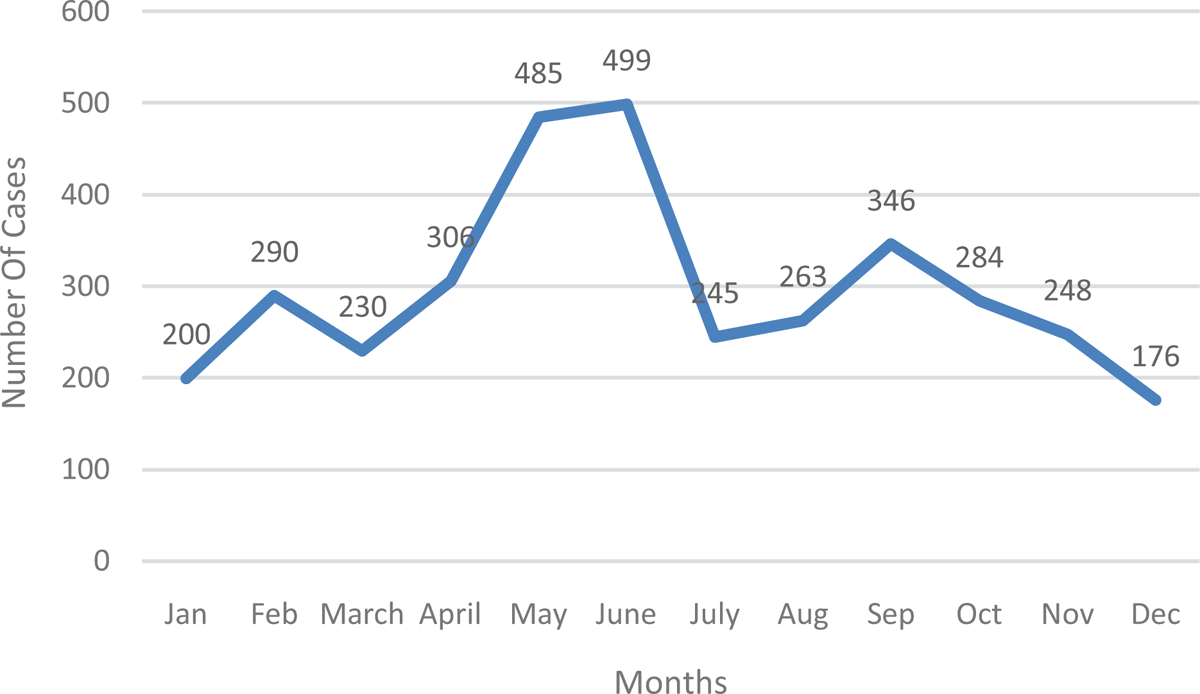
Figure 5
Typhoid Fever Cases in 2016.
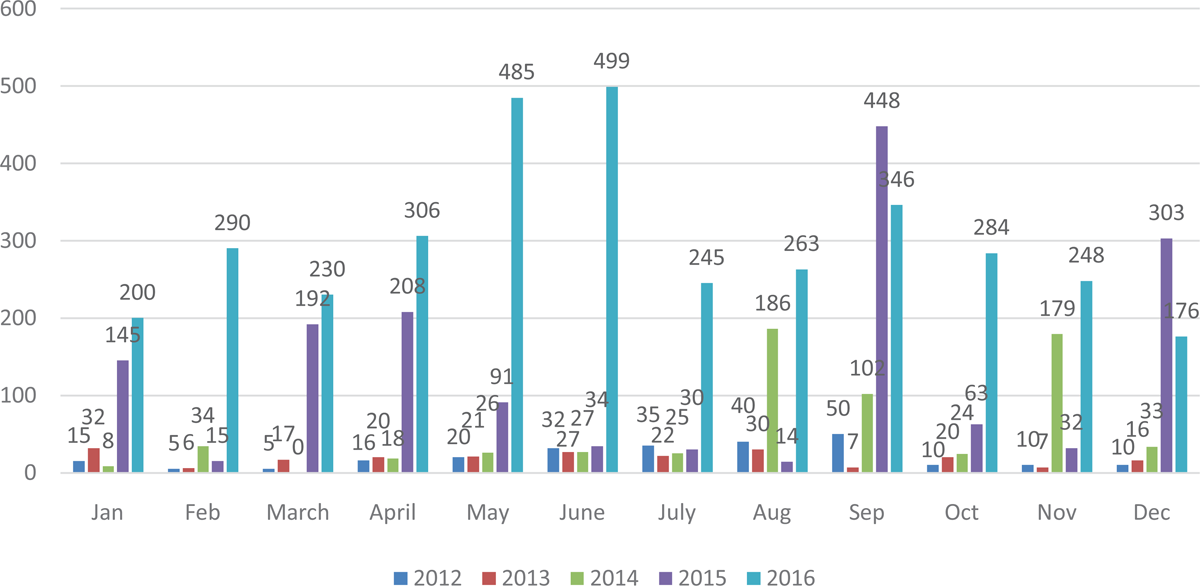
Figure 6
Typhoid Fever Cases from January 2012–December 2016.
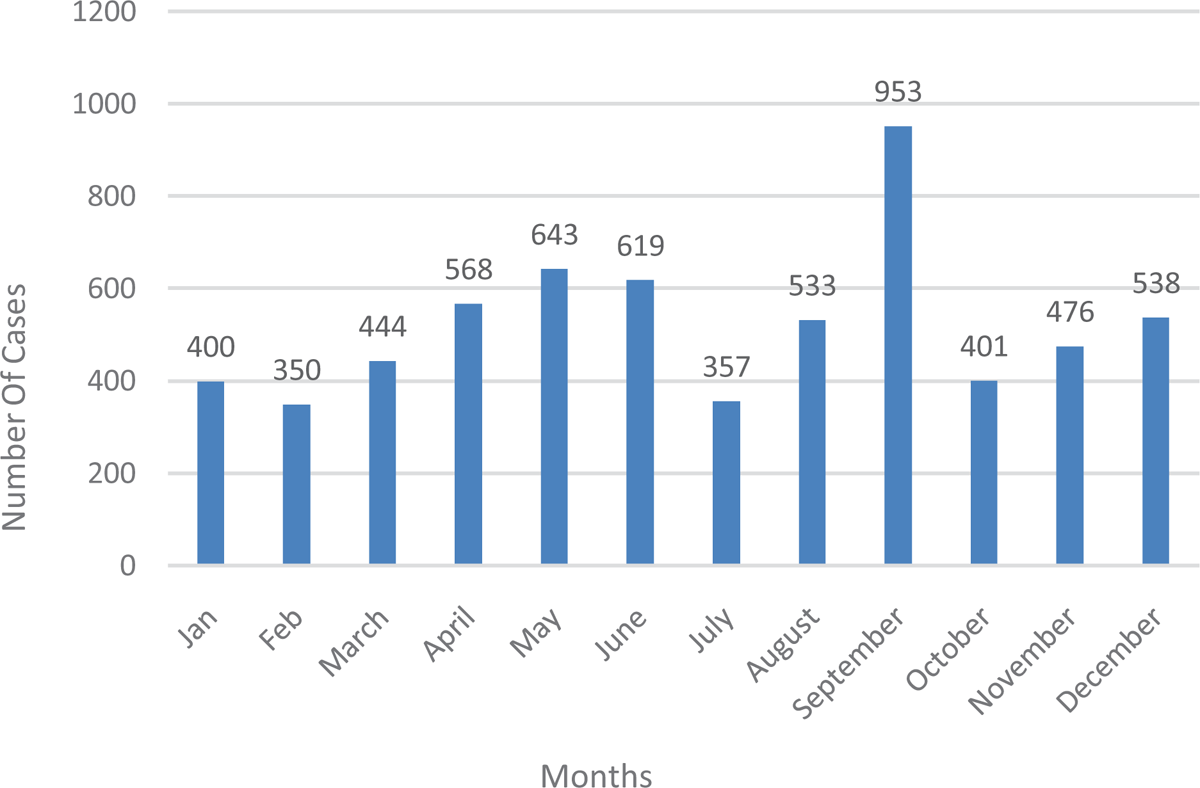
Figure 7
Typhoid fever cases by months during the study period.
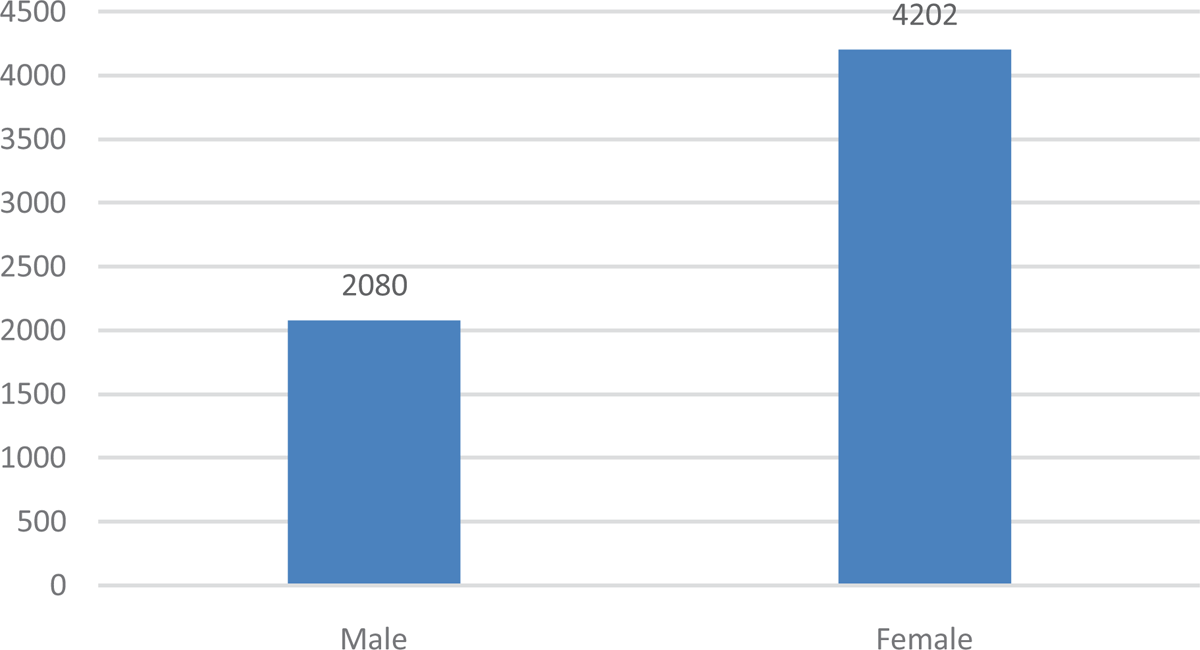
Figure 8
Typhoid fever cases by Gender.
Table 2
Typhoid Fever Cases among Various Age Groups (Male).
| Age | Male | |||||
|---|---|---|---|---|---|---|
| 2012 | 2013 | 2014 | 2015 | 2016 | Total | |
| 0–11 months | 1 | 4 | 1 | 26 | 11 | 43 |
| 1–4 | 8 | 5 | 10 | 96 | 104 | 223 |
| 5–9 | 8 | 3 | 23 | 37 | 112 | 183 |
| 10–14 | 13 | 10 | 10 | 45 | 122 | 190 |
| 15–19 | 12 | 7 | 27 | 32 | 106 | 177 |
| 20–24 | 6 | 12 | 32 | 25 | 143 | 206 |
| 25–29 | 9 | 12 | 15 | 52 | 95 | 171 |
| 30–34 | 11 | 6 | 19 | 50 | 36 | 116 |
| 35–39 | 5 | 2 | 15 | 27 | 90 | 137 |
| 40–44 | 8 | 2 | 10 | 20 | 50 | 88 |
| 45–49 | 13 | 3 | 16 | 28 | 54 | 111 |
| 50–54 | 6 | 3 | 4 | 28 | 41 | 79 |
| 55–59 | 3 | 4 | 6 | 20 | 85 | 114 |
| 60–64 | 6 | 7 | 2 | 16 | 40 | 64 |
| 65–69 | 2 | 1 | 5 | 15 | 31 | 53 |
| 70+ | 6 | 6 | 13 | 31 | 75 | 125 |
| Total | 117 | 87 | 208 | 548 | 1195 | 2080 |
Table 3
Typhoid Fever among Various Age Groups (Females).
| Age | Female | |||||
|---|---|---|---|---|---|---|
| 2012 | 2013 | 2014 | 2015 | 2016 | Total | |
| 0–11 months | 3 | 3 | 0 | 37 | 12 | 55 |
| 1–4 | 5 | 3 | 14 | 100 | 98 | 220 |
| 5–9 | 9 | 10 | 37 | 67 | 124 | 247 |
| 10–14 | 6 | 7 | 31 | 50 | 163 | 257 |
| 15–19 | 24 | 14 | 21 | 79 | 199 | 337 |
| 20–24 | 8 | 20 | 50 | 123 | 140 | 341 |
| 25–29 | 12 | 16 | 64 | 120 | 207 | 419 |
| 30–34 | 6 | 4 | 34 | 40 | 102 | 186 |
| 35–39 | 7 | 6 | 34 | 84 | 251 | 382 |
| 40–44 | 6 | 12 | 12 | 50 | 55 | 135 |
| 45–49 | 8 | 10 | 30 | 53 | 250 | 351 |
| 50–54 | 9 | 7 | 69 | 65 | 161 | 311 |
| 55–59 | 10 | 9 | 40 | 55 | 202 | 316 |
| 60–64 | 5 | 5 | 19 | 20 | 99 | 148 |
| 65–69 | 6 | 7 | 30 | 37 | 110 | 190 |
| 70+ | 7 | 12 | 18 | 74 | 196 | 307 |
| Total | 131 | 145 | 503 | 1054 | 2369 | 4202 |
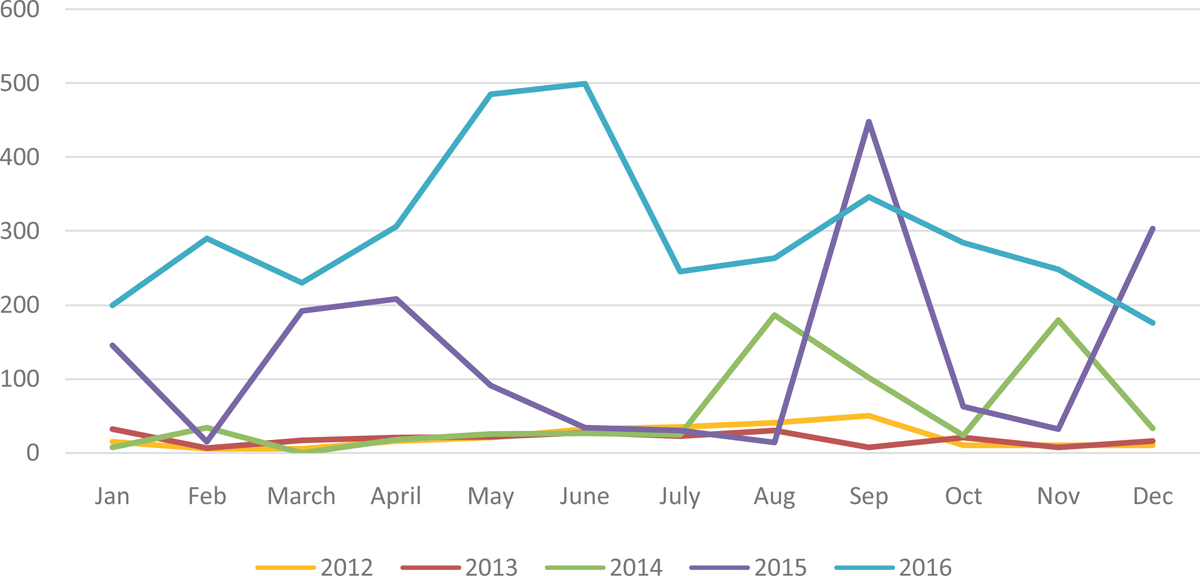
Figure 9
A trend analysis showing the prevalence of typhoid fever from January 2012 to December 2016.