
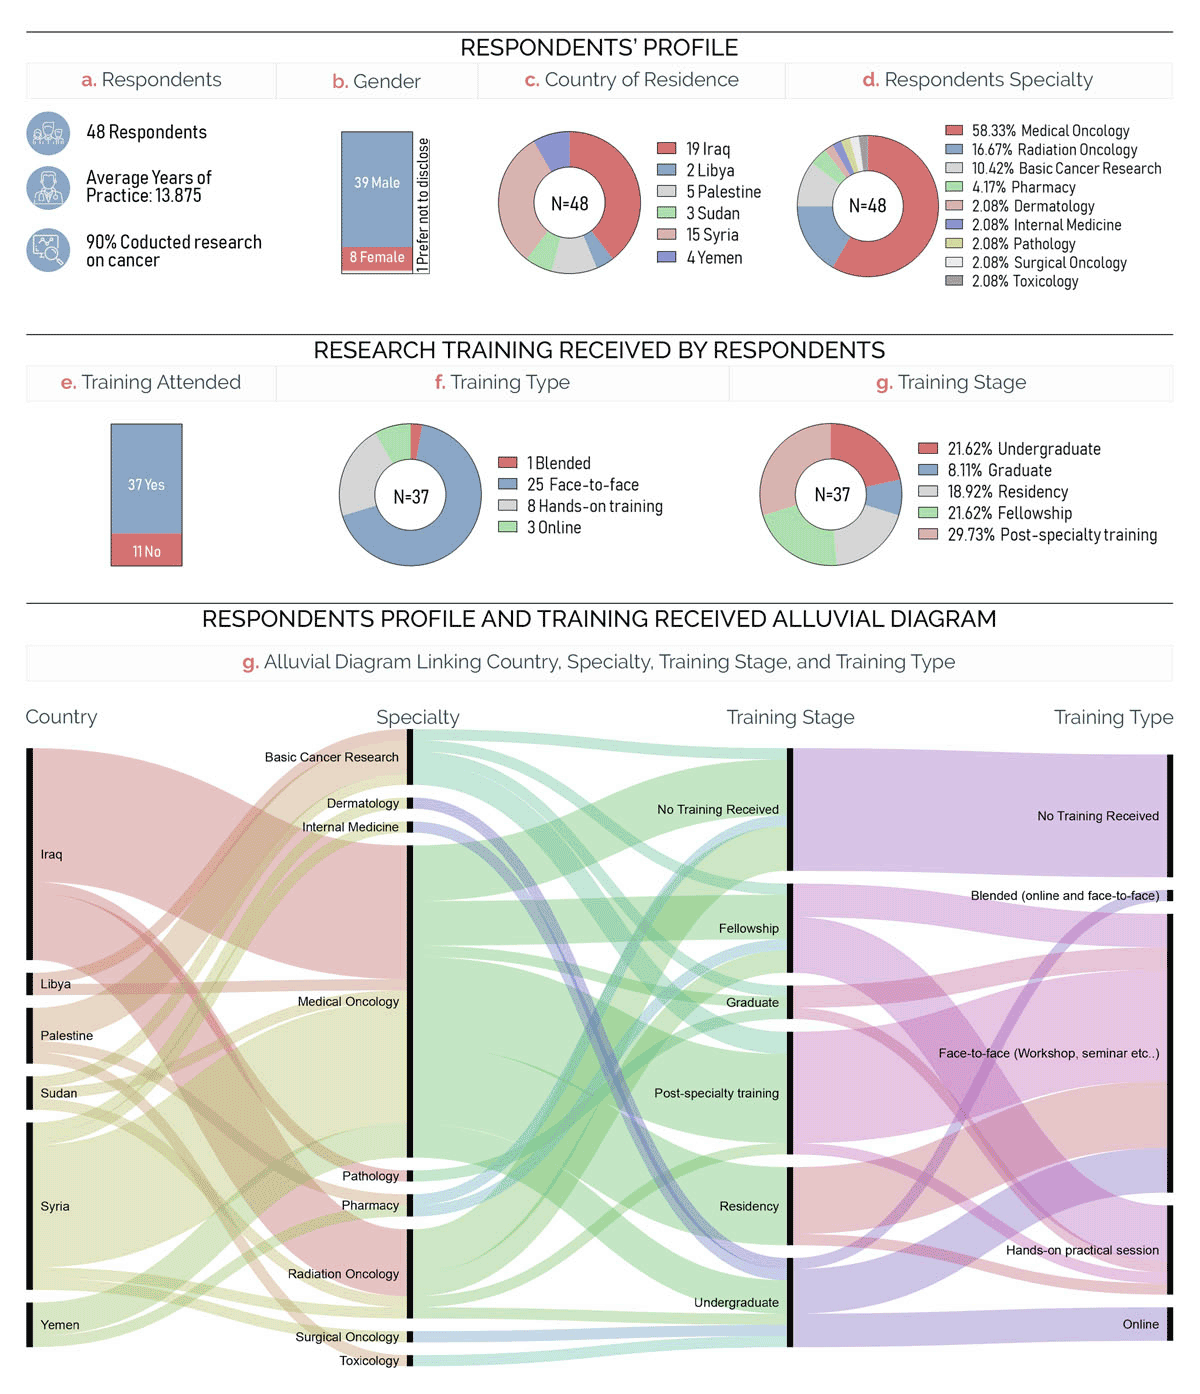
Figure 1
Demographics (a–d) of and training received (e–g) by survey respondents. (h) Alluvial diagram connecting the respondents’ country, specialty, training stage, and training type.
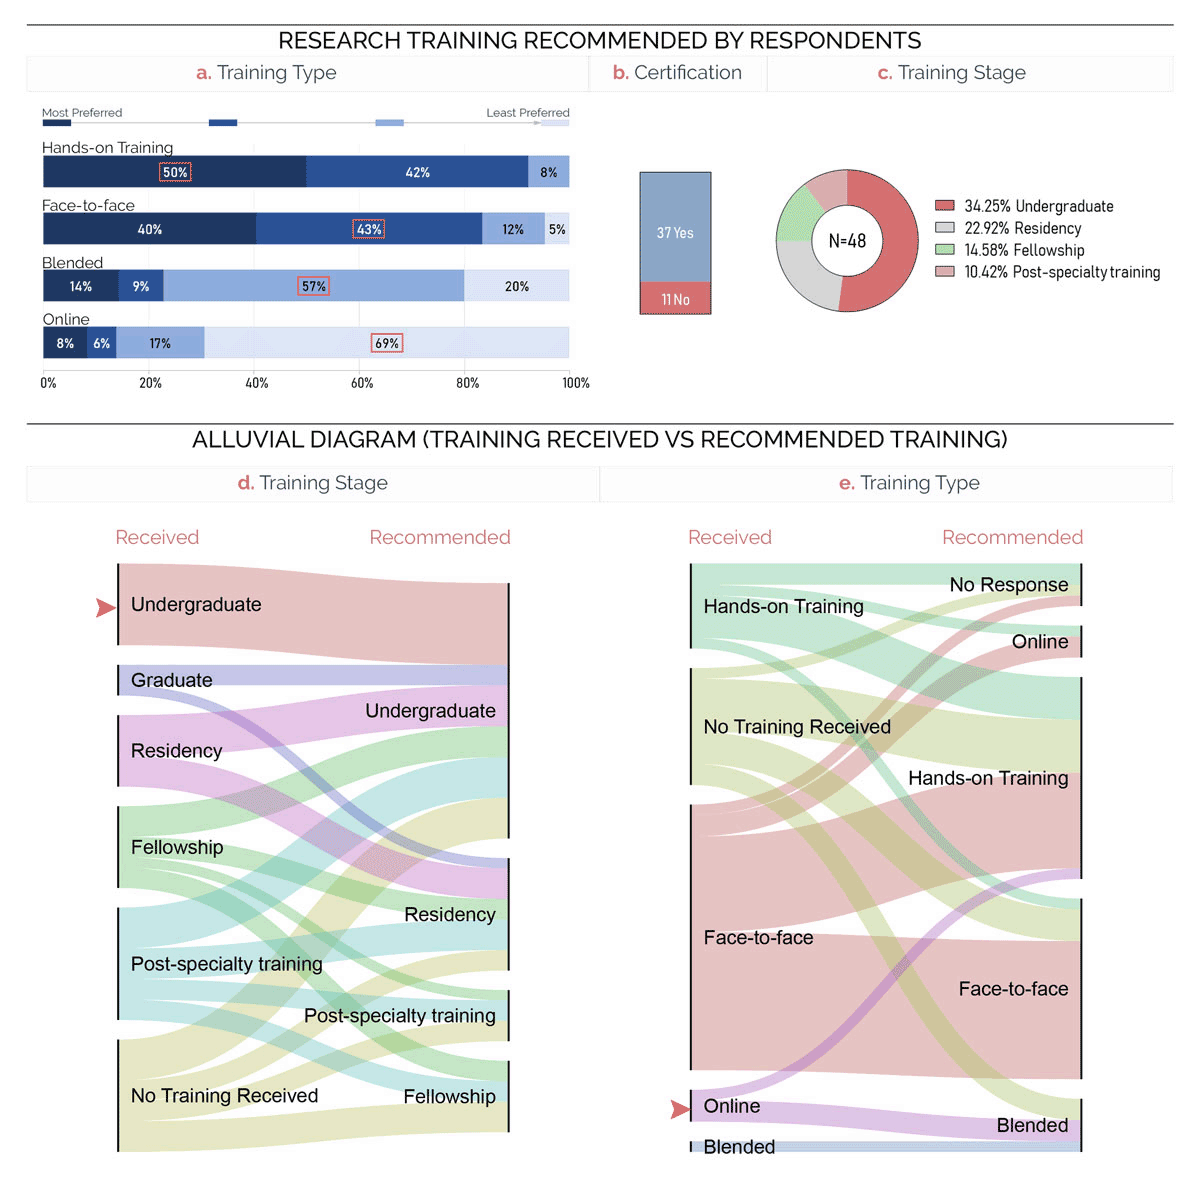
Figure 2
Training type (a), certification (b), and training stage (c) as recommended by survey participants. Alluvial diagram showing the relationship between training stage (d) and type (e) received and recommended by survey participants.
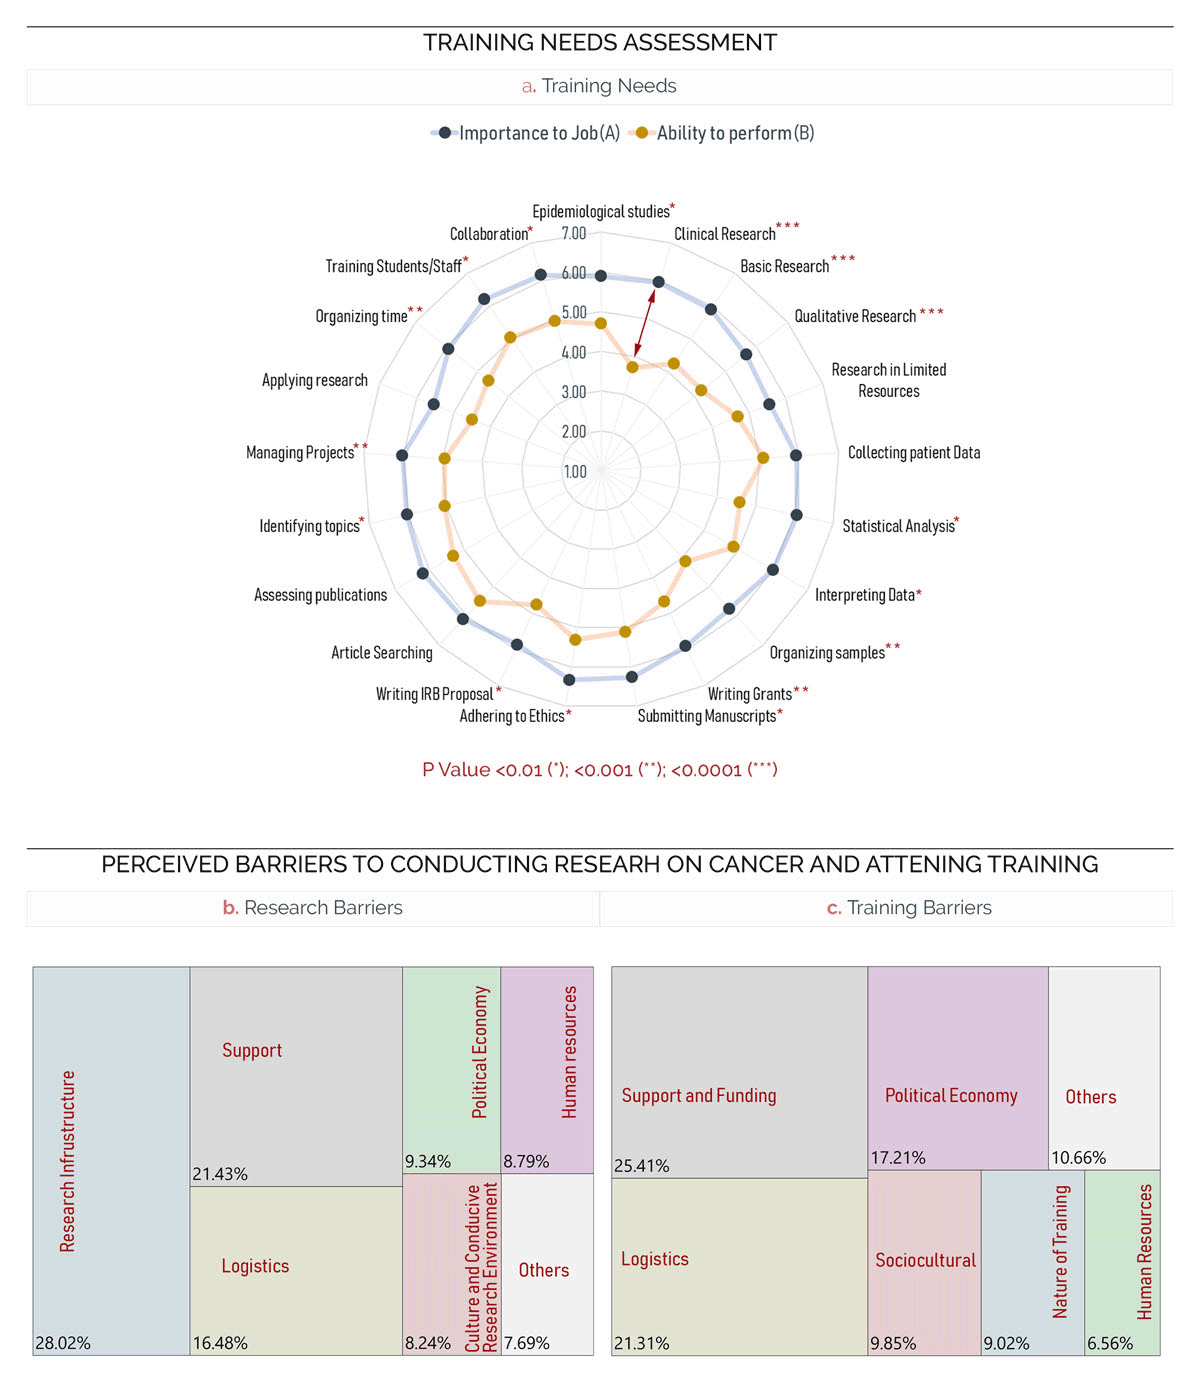
Figure 3
(a) Radar chart highlighting the difference between the importance to job and ability to perform in regard to activities related to cancer research and care. Treemap chart showing the themes mapped from participants’ responses to the research (b) and training (c) barriers.