
Table I
Schedule for Data Collection.
| Prenatal | Birth | 3m | 6m | 12m | 24m | 36m | 48m | |
|---|---|---|---|---|---|---|---|---|
| Clinical Exam | ||||||||
| Anthropometric | × | × | × | × | × | × | × | |
| Physical Exam | × | × | × | × | × | × | × | |
| NCPDTests1 | × | × | × | × | × | × | ||
| Biological Samples | ||||||||
| Umbilical Cord Blood | × | |||||||
| Meconium | × | |||||||
| Tissue samples2 | × | |||||||
| Maternal milk | × | × | ||||||
| Urine (child) | × | × | × | × | × | × | ||
| Urine (mother) | × | |||||||
| Blood (mother) | × | |||||||
| Saliva (child) | × | × | × | × | × | × | × | |
| Questionnaires | ||||||||
| Gestation: 32nd week | × | |||||||
| Birth | × | |||||||
| Follow up | × | × | × | × | × | × | × |
[i] 1 Neuromotor, cognitive and psychologic developmental tests; 2umbilical cord and placenta.
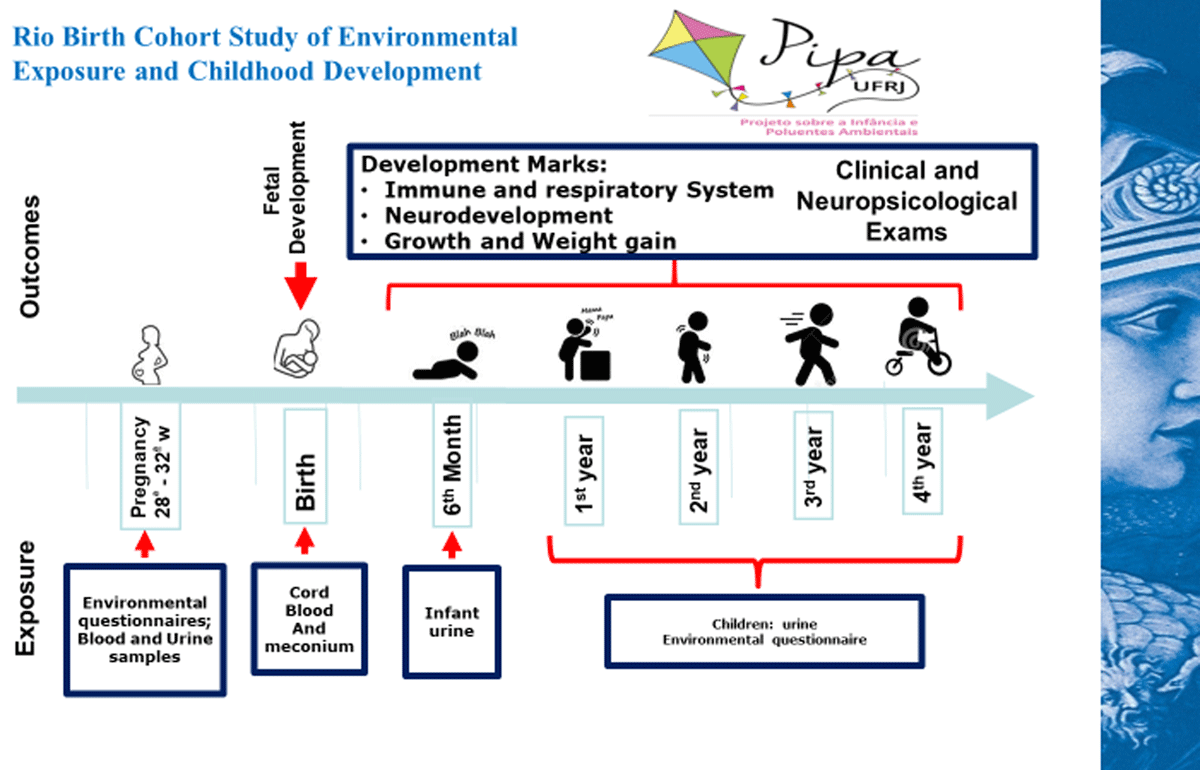
Figure 1
Follow-up endpoints.
Table II
Environmental pollutants, types of sample and biological matrices.
| Biologic Matrix | Environmental Pollutants | Types of sample |
|---|---|---|
| Prenatal: 27th to 32nd week. | ||
| Blood | Metals(1); Organochlorine pesticides; Bisphenol; Polychlorinated biphenyls (PCBs); Phthalates; | Parents |
| Urine | Metals(1) Pyrethroids; Bisphenol; Phthalates. | Parents |
| Birth | ||
| Umbilical Cord Blood | Metals(1) Organochlorine pesticides; Polychlorinated biphenyls (PCBs); | Newborn |
| Meconium | Metals(1) | Newborn |
| Postnatal until 4 years old | ||
| Urine | Metals(1) Pyrethroids; Bisphenol; Phthalates. | Newborn/infant/toddler |
| Maternal Milk (2) | Metals(1) Organochlorine pesticides; Polychlorinated biphenyls (PCBs). | Mother |
[i] (1) Metals: Lead, Arsenic. Cadmium and Mercury.
(2) In the 3rd and 6th follow-up months.
Table III
Recruitment and participation in the PIPA Pilot Study.
|
Table IV
Comparison between the PIPA Pilot Study population data and Rio de Janeiro municipality population data.
| Maternal Characteristics | PIPA Pilot Study | MRJ* | ||||
|---|---|---|---|---|---|---|
| % | (N) | % | (N) | |||
| Maternal age (139)(1) | 15 to 19 years old | 8.6 | (12) | 13.9 | (11194) | |
| 20 to 39 years old | 84.2 | (117) | 82.2 | (66024) | ||
| Up to 40 years old | 7.2 | (10) | 3.9 | (3154) | ||
| Years of Study (137)(1) | Lower than 8 years of study | 7.3 | (10) | 1.5 | (13724) | |
| Higher than 8 years of study | 92.7 | (127) | 82.5 | (64494) | ||
| Ethnicity (135)(1) | White | 23.9 | (34) | 36.6 | (29057) | |
| Non-White | 71.1 | (101) | 63.4 | (50230) | ||
| Newborn Characteristics | PIPA Pilot Study | MRJ* | ||||
| % | (N) | % | (N) | |||
| Gender | Male | 57.3 | (75) | 51.1 | (42,223) | |
| Female | 43.7 | (56) | 48.9 | (40,370) | ||
| BirthWeight (1)** | 1.000–2500 | 9 | (12) | 8.6 | (7,143) | |
| 2500–3999 | 82.7 | (110) | 86.2 | (71,224) | ||
| > 4000 | 8.3 | (11) | 5.1 | (4,234) | ||
| Birth Weight Adequacy for Gestational Age(1)*** | SGA | 9.2 | (11) | 9.3 | (165)**** | |
| AGA | 81.5 | (97) | 74.8 | (1,324)**** | ||
| LGA | 9.2 | (11) | 15.9 | (282)**** | ||
[i] * MRJ: Rio de Janeiro Municipality. Source: MS Datasus/Sinasc–2016.
** Total PIPA number: 133 newborns; Total number RJ: 82.601 newborns.
*** Total PIPA number: 119 newborns.
**** Source: Kale et all, 2018 [25]; Total live births: 1,771; SGA: Small for the gestational age; AGA: adequate for the gestational age; LGA: large for the gestational age.
(1) Incomplete data on the specific covariates.
Table V
Metal levels in mother and umbilical cord blood – Pilot study.
| Metals | Sample | Geometric Mean (95% IC) | Min | Max |
|---|---|---|---|---|
| Pb (µg/dL) | Mother blood | 3.74 (3.40–4.12) | 1.11 | 15.26 |
| Umbilical Cord Blood | 3.85 (3.53–4.19) | 1.43 | 16.03 | |
| Hg (µg/L) | Mother blood | 1.00 (0.85–1.18) | 0.33 | 13.32 |
| Umbilical Cord Blood | 1.11 (0.97–1.27) | 0.35 | 6.38 | |
| Cd (µg/L) | Mother blood | 0.30 (0.29–0.53) | 0.002 | 22.43 |
| Umbilical Cord Blood | 0.41 (0.32–0.52) | 0.004 | 17.41 | |
| As (µg/L) | Mother blood | 10.27 (9.37–11.18) | 0.33 | 36.48 |
| Umbilical Cord Blood | 10.31 (9.75–10.93) | 4.89 | 19.94 |
[i] Metal limits of detection: Pb 0.015 μg/L; Hg 0.007 μg/L; Cd 0.002 μg/L; As 0.003 μg/L.
Table VI
3BPA and 4FBA metabolite detection rates – Mother and child urine.
| Samples | N analysed | 3PBA ng mL-1 Detection | 4FPBA Detection | ||
|---|---|---|---|---|---|
| N | Rate | N | Rate | ||
| Mother Urine | 140 | 67 | 47.9% | 14 | 10% |
| Urine newborn | 34 | 8 | 23.5% | 0 | 0 |
| Urine 1st follow up | 26 | 5 | 19.2% | 0 | 0 |
| Urine 2nd follow up | 50 | 14 | 28% | 0 | 0 |
| Urine 3rd follow up | 56 | 12 | 21.4% | 0 | 0 |
[i] Metabolite limits of detection: 3BPA 0.06 ng mL–1; 4FPBA 0.05 ng mL–1.
Table VII
PIPA Project Risk Points and Responding Strategies.
| Risk points | Responding strategies |
|---|---|
| Management structure | |
| Underestimating of research costs | Permanent search for financial support Careful evaluation of the Pilot Study |
| Underestimating number of required staff High research assistant and interviewer turnover | Permanent hiring and training |
| Laboratory capacity underestimation Absence of laboratorial capacity regarding some specific technical analyses | Searches for other laboratories with similar qualifications Searches for international partnerships |
| Establishment of an infrastructure to attend and monitor the population during the cohort period | Accomplishment of alternative attendance schemes for using non-occupied periods |
| High local government decision makers turnover | Development and maintenance of ongoing collaboration and information nets between the researchers, the maternity and family health center teams |
| Participant recruitment | |
| Living far from Maternity: monetary displacement costs | Monetary provision to help the participants with displacement costs to the Maternity School, during the follow-up period |
| No time to answer the questionnaire and to collect the biological samples | Review of the Enrollment questionnaire and Seminar dynamics to optimize data collection. Maximize participant convenience: data collection efficiency; data collector flexibility. |
| Participant retention | “Health, Environment and Child Development Educational Program” |
| Faults in the follow-up visits | Ongoing sensibilization and contact Establishment of a reliable liaison between the research team and project participants Use of digital tools: social nets, PIPA website, interactive communication Maintain communication: phone calls, messages. Obtain other contact detail information; |
| Data Collection | Daily tracking of participants approaching due dates Reminders through direct communication in each data collection time-point Rescheduling appointments Ongoing interviewer training Recruiting specialized teams to collect biological samples |
| Quality Assurance | |
| Incompleteness of covariate data | Rigorous information system infrastructure Questionnaire information collected directly within the database system, using a single data entry with periodic response verification Periodic data tracking and quality checks |
| Unanimous adaptation of pre-specified data collection and management protocols Collecting data relating to numerous potential confounding variables Careful control through statistical analyses |