
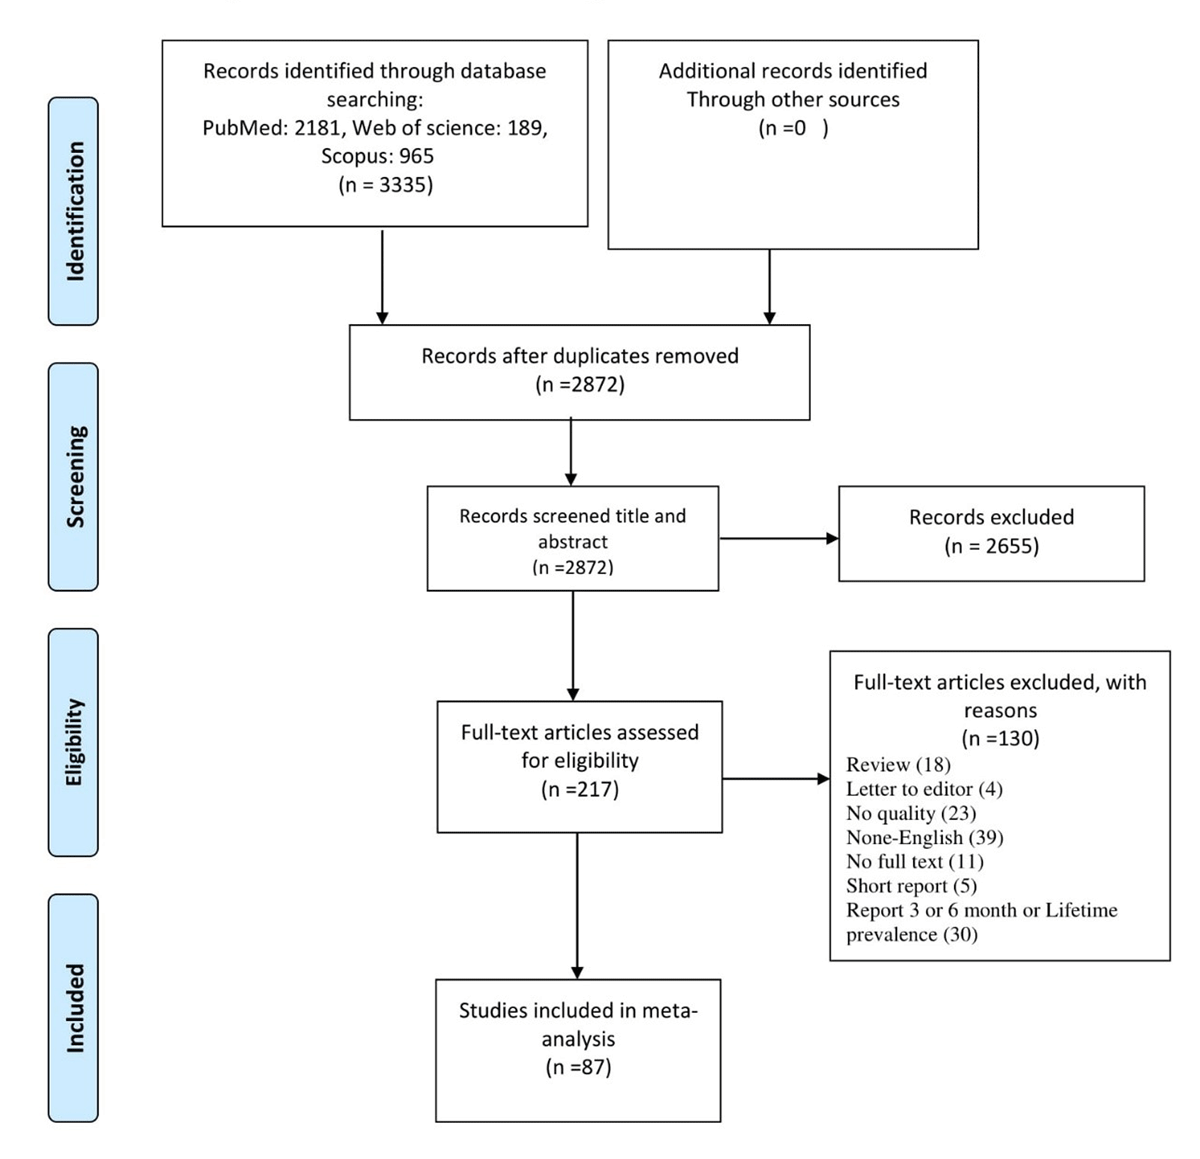
Figure 1
Study flow diagram.
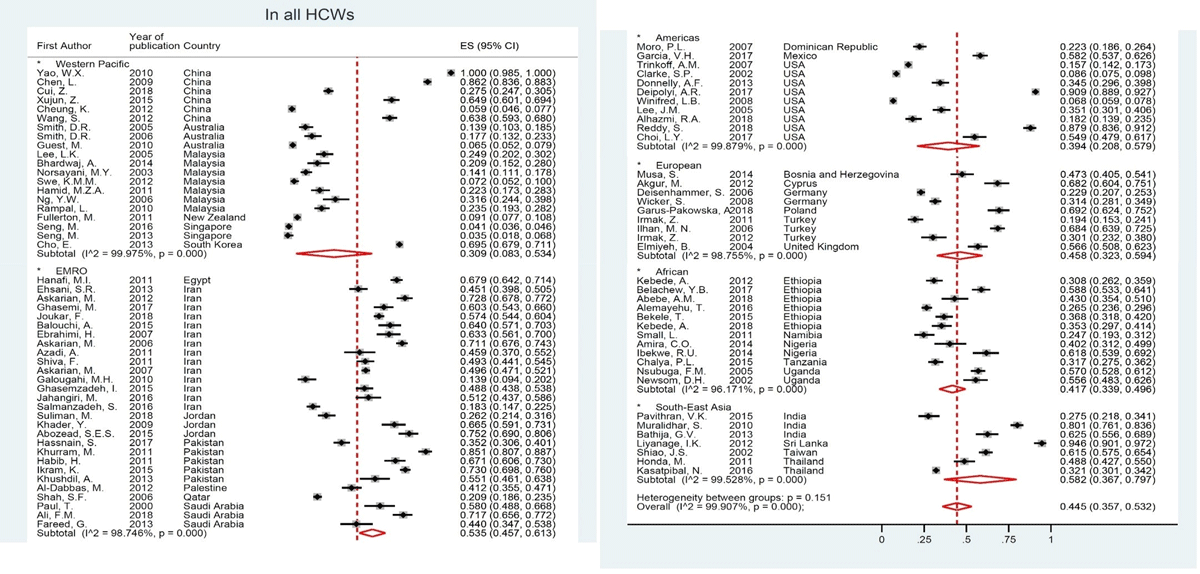
Figure 2
Global Prevalence of Needlestick injuries among health care workers based on WHO region.
Figure 3
Global Prevalence of Needle stick injuries among health care workers based on Countries.
Table 1
Global Prevalence of Needle sticks injuries among health care workers based on SDI status and type of profession.
| All HCWs | In nurses | In physician | In medical students* | |||||||||
|---|---|---|---|---|---|---|---|---|---|---|---|---|
| N | Pooled ES, % (95% CI) | I2, % | N | Pooled ES, % (95% CI) | I2, % | N | Pooled ES, % (95% CI) | I2, % | N | Pooled ES, % (95% CI) | I2, % | |
| High SDI | 26 | 37.6 (28.0, 47.3) | 99.8 | 12 | 28.1 (16.5, 39.6) | 99.8 | 6 | 39.6 (25.0, 54.2) | 97.7 | 7 | 34.2 (16.0, 52.3) | 99.4 |
| High middle SDI | 39 | 44.2 (30.6, 57.8) | 99.9 | 26 | 45.0 (36.4, 53.5) | 98.9 | 10 | 40.7 (21.0, 60.3) | 98.3 | 10 | 34.7 (0.0, 71.0) | 99.9 |
| Low middle SDI | 13 | 61.0 (50.0, 72.1) | 98.5 | 6 | 62.9 (39.2, 86.7) | 99.2 | 5 | 74.5 (63.9, 85.0) | 90.8 | 5 | 70.6 (48.6, 94.7) | 98.5 |
| Low SDI | 9 | 41.6 (35.8, 50.4) | 96.5 | 6 | 43.1 (32.5, 53.6) | 95.0 | 1 | 10.5 (5.6, 18.7) | NA | 0 | – | – |
| Global | 87 | 44.5 (35.7, 53.2) | 99.9 | 50 | 42.9 (35.0, 50.7) | 99.7 | 22 | 46.4 (34.1, 58.8) | 98.8 | 22 | 42.7 (20.7, 64.7) | 99.9 |
[i] * Total Students; SDI: Socio-economic development; N: Number of included studies; HCW: Health care worker; ES: Effect size; CI: Confidence interval.