
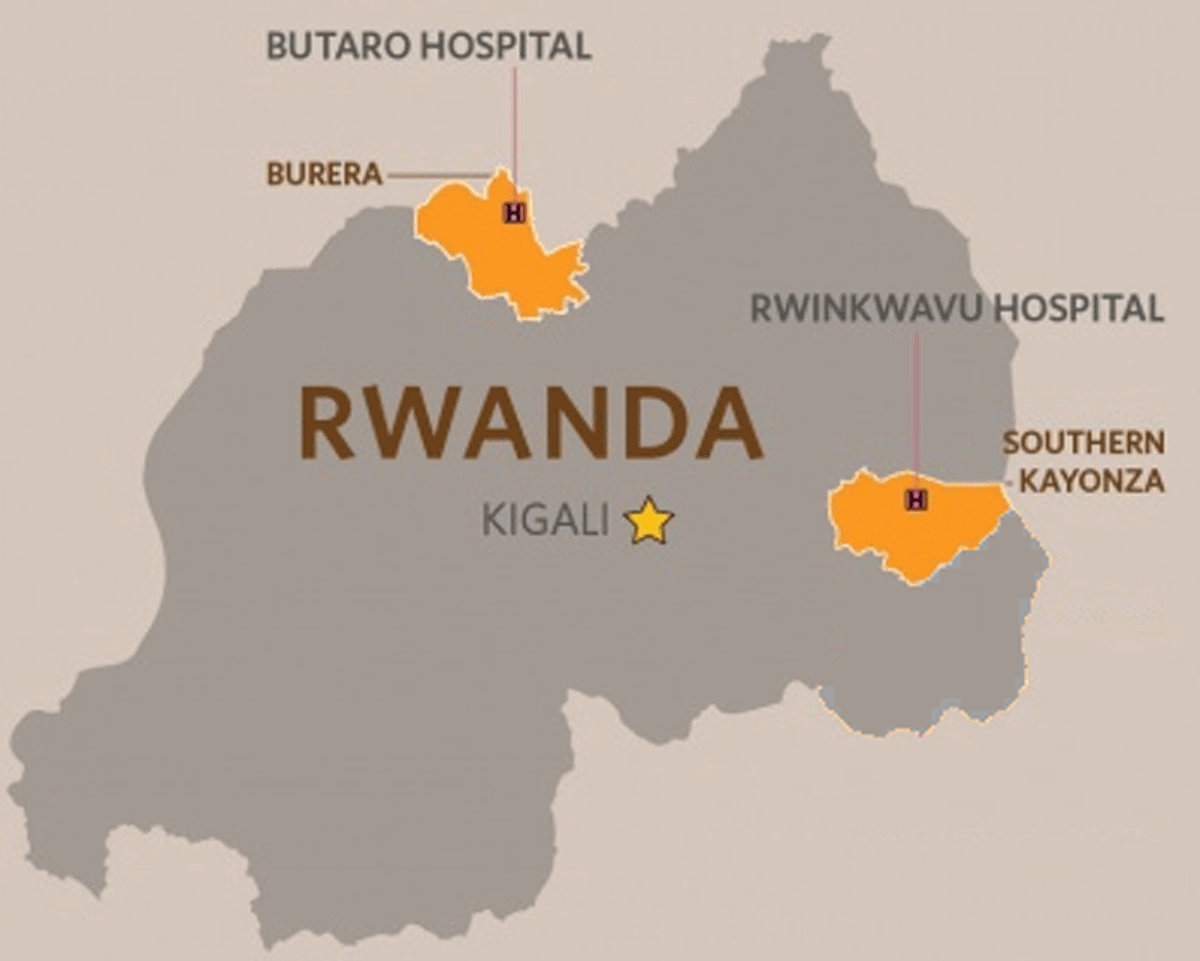
Figure 1
Map of Rwanda with catchment area of Rwinkwavu District Hospital (Southern Kayonza District) highlighted along with the location of the Butaro Cancer Center of Excellence, the primary referral hospital for cancer service.
Table 1
Demographic characteristics of patients enrolled in RDH integrated NCD clinic by primary diagnosis (2012–2014).
| Diabetes (N = 19) | Hypertension (N = 36) | Heart failure(N = 38) | CRD (N = 5) | Oncology (N = 249) | Total (N = 347) | |||||||
|---|---|---|---|---|---|---|---|---|---|---|---|---|
| n | % | n | % | n | % | n | % | n | % | N | % | |
| Age | ||||||||||||
| 0–19 | 3 | 15.8 | 0 | 0.0 | 14 | 36.8 | 2 | 40.0 | 27 | 10.8 | 46 | 13.3 |
| 20–39 | 6 | 31.6 | 6 | 16.7 | 5 | 13.2 | 1 | 20.0 | 65 | 26.1 | 83 | 23.9 |
| 40–59 | 5 | 26.3 | 19 | 52.8 | 10 | 26.3 | 1 | 20.0 | 119 | 47.8 | 154 | 44.4 |
| 60+ | 5 | 26.3 | 11 | 30.6 | 9 | 23.7 | 1 | 20.0 | 38 | 15.3 | 64 | 18.4 |
| Sex | ||||||||||||
| Male | 9 | 47.4 | 10 | 27.8 | 6 | 15.8 | 1 | 20.0 | 63 | 25.3 | 89 | 25.6 |
| Female | 10 | 52.6 | 26 | 72.2 | 32 | 84.2 | 4 | 80.0 | 186 | 74.7 | 258 | 74.4 |
| RDH catchment Resident | ||||||||||||
| No | 5 | 26.3 | 8 | 22.2 | 13 | 34.2 | 2 | 40.0 | 186 | 74.7 | 214 | 61.7 |
| Yes | 14 | 73.6 | 28 | 77.8 | 25 | 65.8 | 3 | 60.0 | 63 | 25.3 | 133 | 38.3 |
Table 1a
Demographic characteristics of patients enrolled in RDH integrated NCD clinic by primary diagnosis in RDH catchment area (2012–2014).
| Diabetes (N = 14) | Hypertension (N = 28) | Heart failure (N = 25) | CRD (N = 3) | Oncology (N = 63) | Total | |||||||
|---|---|---|---|---|---|---|---|---|---|---|---|---|
| n | % | n | % | n | % | n | % | n | % | n | % | |
| Age (n = 133) | ||||||||||||
| 0–19 | 2 | 14.3 | 0 | 0.0 | 8 | 32.0 | 2 | 66.7 | 8 | 12.7 | 20 | 15.0 |
| 20–39 | 4 | 28.6 | 5 | 17.9 | 4 | 16.0 | 0 | 0.0 | 17 | 27.0 | 30 | 22.6 |
| 40–59 | 3 | 21.4 | 14 | 50.0 | 6 | 24.0 | 0 | 0.0 | 28 | 44.4 | 51 | 38.4 |
| 60+ | 5 | 35.7 | 9 | 32.1 | 7 | 28.0 | 1 | 33.3 | 10 | 15.9 | 32 | 24.1 |
| Sex (n = 133) | ||||||||||||
| Male | 6 | 42.9 | 7 | 25.0 | 4 | 16.0 | 0 | 0.0 | 23 | 36.5 | 40 | 30.1 |
| Female | 8 | 57.1 | 21 | 75.0 | 21 | 84.0 | 3 | 100.0 | 40 | 63.5 | 93 | 69.9 |
Table 2
Types of primary diagnoses of patients enrolled in RDH integrated NCD clinic (2012–2014).
| All patients | Catchment area only | |||
|---|---|---|---|---|
| n | % | n | % | |
| Diabetes types (N = 19) | N = 14 | |||
| Type 1 diabetes | 4 | 21 | 2 | 14.3 |
| Type 2 diabetes | 10 | 52.6 | 7 | 50.0 |
| Type not reported | 5 | 26.3 | 5 | 35.7 |
| Heart failure types (N = 38) | N = 22 | |||
| Rheumatic heart disease | 4 | 10.5 | 3 | 13.6 |
| Congenital heart disease | 5 | 13.2 | 3 | 13.6 |
| Hypertensive heart disease | 4 | 10.5 | 2 | 9.1 |
| Cardiomyopathy | 9 | 23.7 | 7 | 31.8 |
| Type not reported | 16 | 42.1 | 7 | 31.8 |
| Cancer (N = 249) | N = 62 | |||
| Breast cancer | 48 | 19.3 | 7 | 11.3 |
| Gynecological cancer | 48 | 19.3 | 14 | 22.6 |
| Cervical cancer | 41 | 85.4 | 13 | 92.9 |
| Endometrial cancer | 4 | 8.3 | 1 | 7.1 |
| Molar pregnancy | 1 | 2.1 | 0 | 0 |
| Choriocarcinoma | 1 | 2.1 | 0 | 0 |
| Vulva cancer | 1 | 2.1 | 0 | 0 |
| Leukemia | 19 | 7.6 | 4 | 6.5 |
| Chronic myelogenous leukemia | 17 | 89.5 | 2 | 50 |
| Chronic lymphocytic leukemia | 1 | 5.3 | 1 | 25 |
| Acute lymphoblastic leukemia | 1 | 5.3 | 1 | 25 |
| Other Cancers | 134 | 53.8 | 37 | 59.7 |
| Thyroid cancer | 3 | 2.2 | 2 | 5.4 |
| Male reproductive cancer | 4 | 3 | 1 | 2.7 |
| Skin cancer | 8 | 6 | 4 | 10.8 |
| Sarcomas | 3 | 2.2 | 2 | 5.4 |
| Multiple myeloma | 2 | 1.5 | 0 | 0 |
| Lung cancer | 1 | 0.7 | 1 | 2.7 |
| Gastrointestinal cancer | 6 | 4.5 | 0 | 0 |
| Head and neck cancer | 4 | 3 | 1 | 2.7 |
| Lymphoma | 6 | 4.5 | 3 | 8.1 |
| Other (not specified) | 97 | 72.4 | 23 | 62.2 |
Table 3
Patient status 12 months after enrollment date into RDH integrated NCD clinic by primary diagnosis (2012–2014).
| Diabetes N = 19 | Hypertension N = 36 | Heart failure N = 38 | CRD N = 5 | Oncology N = 249 | Total N = 347 | |||||||
|---|---|---|---|---|---|---|---|---|---|---|---|---|
| n | % | n | % | n | % | n | % | n | % | N | % | |
| Outcomes | ||||||||||||
| Alive in care | 14 | 73.7 | 27 | 75.0 | 18 | 47.4 | 3 | 60.0 | 204 | 81.6 | 266 | 76.6 |
| Died | 0 | 0.0 | 0 | 0.0 | 1 | 2.6 | 1 | 20.0 | 23 | 9.2 | 25 | 7.2 |
| In remission | 0 | 0.0 | 0 | 0.0 | 0 | 0.0 | 0 | 0.0 | 21 | 8.8 | 21 | 6.1 |
| Lost to follow up | 5 | 26.3 | 9 | 25.0 | 19 | 50.0 | 1 | 20.0 | 1 | 0.4 | 35 | 10.1 |
Table 3a
Patient status 12 months after enrollment date into RDH integrated NCD clinic by primary diagnosis in RDH catchment area (2012–2014).
| Diabetes N = 14 | Hypertension N = 28 | Heart failure N = 25 | CRD N = 3 | Oncology N = 63 | Total N = 133 | |||||||
|---|---|---|---|---|---|---|---|---|---|---|---|---|
| n | % | n | % | n | % | n | % | n | % | n | % | |
| Outcomes | ||||||||||||
| Alive in care | 11 | 78.6 | 20 | 71.4 | 13 | 52.0 | 1 | 33.3 | 53 | 84.1 | 98 | 73.7 |
| Died | 0 | 0.0 | 0 | 0.0 | 1 | 4.0 | 1 | 33.3 | 2 | 3.2 | 4 | 3.0 |
| In remission | 0 | 0.0 | 0 | 0.0 | 0 | 0.0 | 0 | 0.0 | 7 | 11.1 | 7 | 5.3 |
| Lost to follow up | 3 | 21.4 | 8 | 28.6 | 11 | 44.0 | 1 | 33.3 | 1 | 1.6 | 24 | 18.1 |