
Table 1
Socio-demographic characteristics of the street children’s mothers, April, 2019 (n = 107).
| Variables | Frequency | Percent | |
|---|---|---|---|
| Age | ≤20 | 17 | 15.9 |
| ≥21 | 80 | 84.1 | |
| Marital status | Unmarried | 14 | 13.1 |
| Married | 64 | 59.8 | |
| Widow | 12 | 11.2 | |
| Divorced | 16 | 15 | |
| Cohabited | 1 | 0.9 | |
| Religion | Protestant | 56 | 52.3 |
| Orthodox | 42 | 39.3 | |
| Muslim | 4 | 3.7 | |
| Catholic | 1 | 0.9 | |
| No religion | 4 | 3.7 | |
| Ethnicity | Sidama | 66 | 61.7 |
| Wolaita | 17 | 15.9 | |
| Oromo | 7 | 6.5 | |
| Amhara | 10 | 9.3 | |
| Others* | 7 | 6.5 | |
| Education status | No formal education | 53 | 49.4 |
| Primary school | 50 | 46.7 | |
| Secondary school | 4 | 3.7 | |
| Character of dwelling | Street on | 27 | 25.2 |
| Street off | 80 | 74.8 |
[i] * Gedeo, Guraghe, Hadiya, Kembata and Tigre.
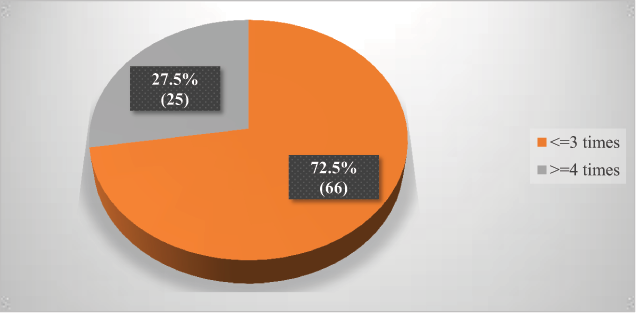
Figure 1
Frequency of ANC follow up during pregnancy of the index child, April, 2019 (n = 91).
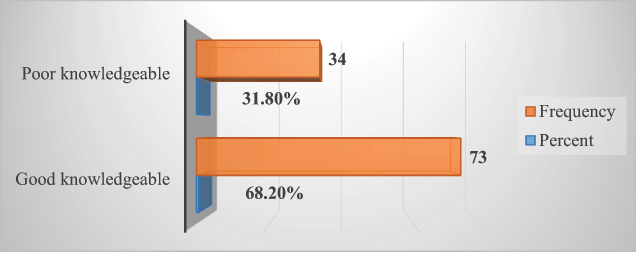
Figure 2
Mothers’ level of knowledge towards vaccination, April, 2019 (n = 107).
Table 2
Responses of the street children’s mothers to the right time to initiate vaccination, April, 2019 (n = 107).
| Responded time of initiation | Frequency | Percent |
|---|---|---|
| Birth to 2 weeks | 65 | 60.7 |
| 2–4 weeks after birth | 24 | 22.4 |
| 4–6 weeks after birth | 10 | 9.3 |
| 6 weeks after birth | 1 | .9 |
| Any time within one year of birth | 4 | 3.7 |
| Don’t know | 3 | 2.8 |
Table 3
Factors associated with vaccination status among street children 9–24 months old in Sidama zone, April, 2019.
| Variables | Vaccinated | COR | AOR (CI) | P-value | ||
|---|---|---|---|---|---|---|
| No | Yes | |||||
| Place of delivery for the index child | Home | 10 (41.7%) | 14 (58.3%) | 0.334 | 0.292 (0.097–0.879) | 0.029** |
| Health facility* | 16 (19.3%) | 67 (80.7%) | 1 | 1 | ||
| Maternal age | ≤20 | 9 (52.9%) | 8 (47.1%) | 0.207 | 0.216 (0.064–0.732) | 0.014** |
| >20* | 17 (18.9%) | 73 (81.1%) | 1 | 1 | ||
| Dwelling character | Street on | 11 (40.7%) | 16 (59.3%) | 0.336 | 0.489 (0.172–1.39) | 0.179 |
| Street off* | 15 (18.8%) | 65 (81.3%) | 1 | 1 | ||
| ANC follow-up | Yes | 18 (19.8%) | 73 (80.2%) | 4.056 | 1.56 (0.435–5.59) | 0.495 |
| No* | 8 (50%) | 8 (50%) | ||||
[i] * Reference category, ** statistically significant association.