
Table 1
Characteristics of migrant and local participants, n (%).
| Overall (n = 6972) | Migrants (n = 1412) | Local patients (n = 5560) | P value | |
|---|---|---|---|---|
| Age* | 0.000 | |||
| 21–35 | 395(5.7) | 163(11.5) | 232(4.2) | |
| 36–50 | 1,549(22.2) | 576(40.8) | 973(17.5) | |
| 51–65 | 5,028(72.1) | 673(47.7) | 4,355(78.3) | |
| Gender | 0.298 | |||
| Male | 3,808(54.6) | 859(60.8) | 2949(53.0) | |
| Female | 3,164(45.4) | 553(39.2) | 2611(47.0) | |
| Marital status | 0.098 | |||
| Married | 6,417(92.0) | 1315(93.1) | 5102(91.8) | |
| Unmarried (Widowed, divorced, or single) | 555(8.0) | 97(6.9) | 458(8.2) | |
| Diabetes* | 0.000 | |||
| With | 1532(22.0) | 215(15.2) | 1,317(23.7) | |
| Without | 5,440(78.0) | 1,197(84.8) | 4,243(76.3) | |
| Insurance* | 0.000 | |||
| Employment insurance | 4,671(67.0) | 482(34.1) | 4,189(75.3) | |
| Resident insurance | 713(10.2) | 47(3.3) | 666(12.0) | |
| Uninsured | 1290(18.5) | 859(60.8) | 431(7.8) | |
| Other | 298(4.3) | 24(1.7) | 274(4.9) | |
| Frequency of hospitalization* | 0.001 | |||
| Once | 5,712(81.9) | 1,201(85.1) | 4,511(81.1) | |
| More than once | 1260(18.1) | 211(14.9) | 1,049(18.9) |
[i] * p < 0.01.
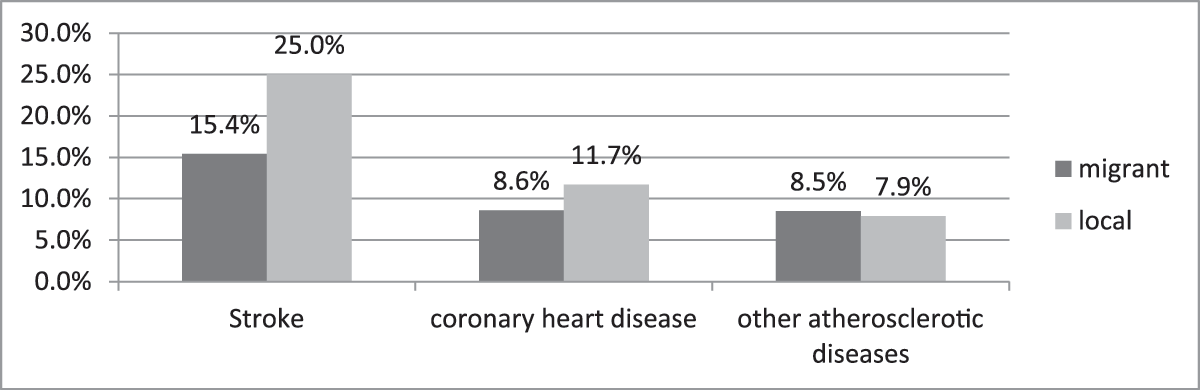
Figure 1
Incidence of atherosclerotic complications in migrant and local groups.
Table 2
Differences in risk factors of atherosclerotic complications among migrant and local populations.
| Stroke (n = 1610) | Coronary heart disease (n = 772) | Other atherosclerotic diseases (n = 557) | |||||||
|---|---|---|---|---|---|---|---|---|---|
| Migrant (n = 218) | Local (n = 1392) | P value | Migrant (n = 122) | Local (n = 650) | P value | Migrant (n = 120) | Local (n = 437) | P value | |
| Age | 0.000 | 0.000 | 0.000 | ||||||
| 21–35 | 11(5.0) | 14(1.0) | 10(8.2) | 5(0.8) | 6(5.0) | 7(1.6) | |||
| 36–50 | 79(36.2) | 157(11.3) | 25(20.5) | 56(8.6) | 37(30.8) | 60(13.7) | |||
| 51–65 | 128(58.7) | 1221(87.1) | 87(71.3) | 589(90.6) | 77(64.2) | 370(84.7) | |||
| Gender | 0.826 | 0.000 | 0.179 | ||||||
| Male | 137(62.8) | 864(62.1) | 91(74.6) | 351(54.0) | 73(60.8) | 235(53.8) | |||
| Female | 81(37.2) | 528(37.9) | 31(25.4) | 299(46.0) | 47(39.2) | 202(46.2) | |||
| Marital status | 0.626 | 0.256 | 0.650 | ||||||
| Married | 199(91.3) | 1251(89.9) | 116(95.1) | 599(92.2) | 115(95.8) | 413(94.5) | |||
| Unmarried (Widowed, divorced, or single) | 19(8.7) | 141(10.1) | 6(4.9) | 51(7.8) | 5(4.2) | 24(5.5) | |||
| Diabetes | 0.002 | 0.012 | 0.020 | ||||||
| With | 39(17.9) | 390(28.0) | 29(23.8) | 231(35.5) | 18(15.0) | 111(25.4) | |||
| Without | 179(82.1) | 1002(72.0) | 93(76.2) | 419(64.5) | 102(85.0) | 326(74.6) | |||
| Insurance | 0.000 | 0.000 | 0.000 | ||||||
| Employment insurance | 79(36.2) | 1043(74.9) | 46(37.7) | 497(76.5) | 30(25.0) | 323(73.9) | |||
| Resident insurance | 3(1.4) | 132(9.5) | 2(1.6) | 79(12.2) | 4(3.3) | 73(16.7) | |||
| Uninsured | 135(61.9) | 152(10.9) | 74(60.7) | 38(5.8) | 86(71.7) | 18(4.1) | |||
| Other | 1(0.5) | 65(4.7) | 38(5.8) | 36(5.5) | 0(0.0) | 23(5.3) | |||
| Frequency of hospitalization | 0.018 | 0.734 | 0.155 | ||||||
| Once | 183(83.9) | 1070(76.9) | 86(70.5) | 468(72.0) | 102(85.0) | 344(78.7) | |||
| More than once | 35(16.1) | 322(23.1) | 36(29.5) | 182(28.0) | 18(15.0) | 93(21.3) | |||
[i] * p < 0.05.
Table 3
Logistic regression analysis of risk factors in migrant and local patients with hypertension.
| Atherosclerotic diseases | Variables | Migrant hypertension patients | Local hypertension patients | |||||
|---|---|---|---|---|---|---|---|---|
| OR | 95%CI | P | OR | 95%CI | P | |||
| Stroke | Age (year) | 21–35 | 1.000 | Reference | 1.000 | Reference | ||
| 36–50 | 2.476 | 1.273–4.814 | 0.008 | 3.199 | 1.809–5.658 | 0.000 | ||
| 51–65 | 3.899 | 2.010–7.562 | 0.000 | 7.031 | 4.061–12.172 | 0.000 | ||
| Gender | Male | 1.000 | Reference | 1.000 | Reference | |||
| Female | 0.827 | 0.599–1.140 | 0.246 | 0.580 | 0.515–0.665 | 0.000 | ||
| Marital status | Married | 1.000 | Reference | 1.000 | Reference | |||
| Unmarried | 1.465 | 0.840–2.554 | 0.179 | 1.454 | 1.170–1.807 | 0.001 | ||
| Diabetes | Without | 1.000 | Reference | 1.000 | Reference | |||
| With | 1.049 | 0.704–1.565 | 0.814 | 1.292 | 1.121–1.489 | 0.000 | ||
| Insurance | Employment insurance | 1.000 | Reference | 1.000 | Reference | |||
| Resident insurance | 0.309 | 0.093–1.032 | 0.056 | 0.733 | 0.596–0.901 | 0.003 | ||
| Uninsured | 0.847 | 0.602–1.193 | 0.343 | 1.765 | 1.419–2.194 | 0.000 | ||
| Other | 0.162 | 0.021–1.238 | 0.079 | 0.973 | 0.726–1.305 | 0.857 | ||
| Frequency of hospitalization | Once | 1.000 | Reference | 1.000 | Reference | |||
| More than once | 1.023 | 0.675–1.550 | 0.915 | 1.391 | 1.194–1.621 | 0.000 | ||
| CHD | Age (year) | 21–35 | 1.000 | Reference | 1.000 | Reference | ||
| 36–50 | 0.818 | 0.380–1.763 | 0.609 | 2.642 | 1.044–6.686 | 0.040 | ||
| 51–65 | 3.089 | 1.512–6.309 | 0.002 | 6.530 | 15.953 | 0.000 | ||
| Gender | Male | 1.000 | Reference | 1.000 | Reference | |||
| Female | 0.421 | 0.267–0.664 | 0.000 | 0.869 | 0.734–1.029 | 0.104 | ||
| Marital status | Married | 1.000 | Reference | 1.000 | Reference | |||
| Unmarried | 0.530 | 0.217–1.292 | 0.162 | 1.003 | 0.735–1.367 | 0.987 | ||
| Diabetes | Without | 1.000 | Reference | 1.000 | Reference | |||
| With | 1.165 | 0.717–1.892 | 0.537 | 1.787 | 1.497–2.132 | 0.000 | ||
| Insurance | Employment insurance | 1.000 | Reference | 1.000 | Reference | |||
| Resident insurance | 0.383 | 0.087–1.678 | 0.203 | 0.930 | 0.719–1.203 | 0.580 | ||
| Uninsured | 0.860 | 0.552–1.339 | 0.504 | 0.790 | 0.555–1.123 | 0.189 | ||
| Other | 0.000 | 0.000– | 0.998 | 1.151 | 0.796–1.664 | 0.455 | ||
| Frequency of hospitalization | Once | 1.000 | Reference | 1.000 | Reference | |||
| More than once | 2.238 | 1.420–3.527 | 0.001 | 1.615 | 1.335–1.954 | 0.000 | ||
| Other atherosclerotic diseases | Age (year) | 21–35 | 1.000 | Reference | 1.000 | Reference | ||
| 36–50 | 1.803 | 0.741–4.389 | 0.194 | 1.986 | 0.894–4.411 | 0.092 | ||
| 51–65 | 3.353 | 1.400–8.028 | 0.007 | 2.728 | 1.272–5.852 | 0.010 | ||
| Gender | Male | 1.000 | Reference | 1.000 | Reference | |||
| Female | 0.742 | 0.493–1.116 | 0.151 | 0.877 | 0.719–1.071 | 0.197 | ||
| Marital status | Married | 1.000 | Reference | 1.000 | Reference | |||
| Unmarried | 0.696 | 0.270–1.794 | 0.454 | 0.641 | 0.419–0.982 | 0.041 | ||
| Diabetes | Without | 1.000 | Reference | 1.000 | Reference | |||
| With | 0.835 | 0.485–1.437 | 0.514 | 1.062 | 0.846–1.332 | 0.606 | ||
| Insurance | Employment insurance | 1.000 | Reference | 1.000 | Reference | |||
| Resident insurance | 1.171 | 0.388–3.533 | 0.780 | 1.423 | 1.086–1.865 | 0.011 | ||
| Uninsured | 1.415 | 0.881–2.272 | 0.151 | 0.517 | 0.318–0.843 | 0.008 | ||
| Other | 0.000 | 0.000– | 0.998 | 1.103 | 0.708–1.718 | 0.666 | ||
| Frequency of hospitalization | On Once | 1.000 | Reference | 1.000 | Reference | |||
| More than once | 1.058 | 0.613–1.827 | 0.839 | 1.095 | 0.860–1.396 | 0.461 | ||
[i] Abbreviations: OR, odds ratio; CI, confidence interval; CHD, coronary heart disease.