
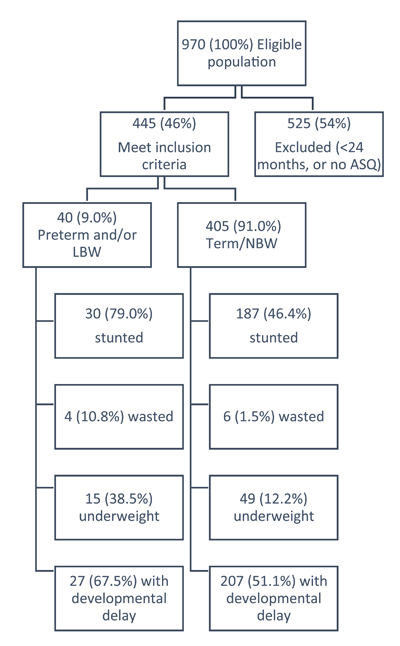
Figure 1
Flow diagram of children eligible for this study, and their nutritional and developmental characteristics, from two datasets of (1) a random sample of children born term/normal birth weight (“UNICEF study”) who were aged 24 to 36 months when data was collected in 2014; and (2) children born preterm and/or low birthweight (“Preterm/LBW study”) who were discharged from the neonatal care unit (NCU) at Rwinkwavu District Hospital (RDH) between October 2011 and October 2013 and were aged 24 to 36 months when data was collected in 2014.
Table 1
Sociodemographic and clinical characteristics of infants born preterm and/or low birth weight (“Preterm/LBW study”) and infants born at term or normal birth weight (NBW) (“UNICEF study”) in Rwanda, at 24–36 months in 2014; N = 445 unless otherwise stated.
| Born preterm and/or LBW | Born term/NBW | |||
|---|---|---|---|---|
| N = 40 | N = 405 | |||
| n | % | n | % | |
| Child age (months) | ||||
| 24–26 | 10 | 25.0 | 82 | 20.3 |
| 27–29 | 8 | 20.0 | 123 | 30.4 |
| 30–32 | 14 | 35.0 | 102 | 25.2 |
| 33–36 | 8 | 20.0 | 98 | 24.2 |
| Child sex | ||||
| Male | 17 | 42.5 | 181 | 44.7 |
| Female | 23 | 57.5 | 224 | 55.3 |
| Province | ||||
| East | 38 | 95.0 | 82 | 20.3 |
| Kigali | 0 | 0.0 | 71 | 17.5 |
| North | 0 | 0.0 | 83 | 20.5 |
| South | 1 | 2.5 | 83 | 20.5 |
| West | 1 | 2.5 | 86 | 21.2 |
| Caregiver’s relationship, N = 437 | ||||
| Mother | 38 | 95.0 | 373 | 94.0 |
| Father | 0 | 0.0 | 13 | 3.3 |
| Other | 2 | 5.0 | 11 | 2.8 |
| Caregiver’s education, N = 424 | ||||
| None completed | 10 | 25.0 | 65 | 16.9 |
| Primary completed | 26 | 65.0 | 294 | 76.6 |
| Secondary or higher completed | 4 | 10.0 | 25 | 6.5 |
| Caregiver’s marital status, N = 394 | ||||
| Not married | 0 | 0.0 | 65 | 18.4 |
| Married | 16 | 40.0 | 226 | 63.8 |
| Living with partner (not married) | 17 | 42.5 | 63 | 17.8 |
| Divorced/widowed | 7 | 17.5 | 0 | 0.0 |
| Household wealth (Ubudehe categories) | ||||
| Extremely poor | 0 | 0.0 | 16 | 4.0 |
| Moderately poor | 9 | 22.5 | 86 | 21.2 |
| Poor | 23 | 57.5 | 206 | 50.9 |
| Not poor | 0 | 0.0 | 1 | 0.3 |
| Unknown or N/A | 8 | 20.0 | 96 | 23.7 |
| Other children in household | ||||
| No other children in household | 8 | 20.0 | 84 | 20.7 |
| 1–3 other children in household | 21 | 52.5 | 257 | 63.5 |
| 4 or more other children in household | 11 | 27.5 | 64 | 15.8 |
| MUAC (mm) [mean, SD], N = 442 | 143.5 | 11.6 | 150 | 11.7 |
| Stunted, N = 441 | ||||
| Normal (z score ≥ –2 SD) | 8 | 21.1 | 216 | 53.6 |
| Moderate (z score < –2 SD) | 30 | 79.0 | 187 | 46.4 |
| Wasted, N = 436 | ||||
| Normal (z score ≥ –2 SD) | 33 | 89.2 | 393 | 98.5 |
| Moderate (z score < –2 SD) | 4 | 10.8 | 6 | 1.5 |
| Underweight, N = 440 | ||||
| Normal (z score ≥ –2 SD) | 24 | 61.5 | 352 | 87.8 |
| Moderate (z score < –2 SD) | 15 | 38.5 | 49 | 12.2 |
| ASQ-3 development status | ||||
| On-track | 13 | 32.5 | 198 | 48.9 |
| Developmental delay | 27 | 67.5 | 207 | 51.1 |
Table 2
Factors associated with developmental delay on ASQ-3 in infants born preterm and/or low birth weight (“Preterm/LBW study”) and infants born at term/normal birth weight (NBW) (“UNICEF study”) in Rwanda, at 24–36 months in 2014; N = 445.
| ASQ Delay, N = 234 | ASQ No delay, N = 211 | p-value | |||
|---|---|---|---|---|---|
| n | % | n | % | ||
| Child age (months) | 0.087 | ||||
| 24–26 | 58 | 63.0 | 34 | 37.0 | |
| 27–29 | 70 | 53.4 | 61 | 46.6 | |
| 30–32 | 53 | 45.7 | 63 | 54.3 | |
| 33–36 | 53 | 50.0 | 53 | 50.0 | |
| Child sex | 0.121 | ||||
| Male | 96 | 48.5 | 102 | 51.5 | |
| Female | 138 | 55.9 | 109 | 44.1 | |
| Province | 0.210 | ||||
| East | 70 | 58.3 | 50 | 41.7 | |
| Kigali | 39 | 54.9 | 32 | 45.1 | |
| North | 43 | 51.8 | 40 | 48.2 | |
| South | 35 | 41.7 | 49 | 58.3 | |
| West | 47 | 54.0 | 40 | 46.0 | |
| Caregiver’s relationship, N = 437 | 0.288 | ||||
| Mother | 215 | 52.3 | 196 | 47.7 | |
| Father | 5 | 38.5 | 8 | 61.5 | |
| Other | 9 | 69.2 | 4 | 30.8 | |
| Caregiver’s education, N = 424 | 0.691 | ||||
| None completed | 42 | 56.0 | 33 | 44.0 | |
| Primary completed | 163 | 50.9 | 157 | 49.1 | |
| Secondary or higher completed | 16 | 55.2 | 13 | 44.8 | |
| Caregiver’s marital status, N = 394 | 0.464 | ||||
| Not married | 36 | 55.4 | 29 | 44.6 | |
| Married | 118 | 48.8 | 124 | 51.2 | |
| Living with partner (not married) | 44 | 55.0 | 36 | 45.0 | |
| Divorced/widowed | 5 | 71.4 | 2 | 28.6 | |
| Household wealth (Ubudehe categories) | 0.368 | ||||
| Extremely poor | 11 | 68.8 | 5 | 31.3 | |
| Moderately poor | 45 | 47.4 | 50 | 52.6 | |
| Poor | 120 | 52.4 | 109 | 47.6 | |
| Not poor | 0 | 0.0 | 1 | 100.0 | |
| Ubudehe unknown or N/A | 58 | 55.8 | 46 | 44.2 | |
| Other children in household | 0.827 | ||||
| No other children in household | 51 | 55.4 | 41 | 44.6 | |
| 1–3 other children in household | 144 | 51.8 | 134 | 48.2 | |
| 4 and more children in household | 39 | 52.0 | 36 | 48.0 | |
| Prematurity and/or low birth weight | 0.048 | ||||
| Yes | 27 | 67.5 | 13 | 32.5 | |
| No | 207 | 51.1 | 198 | 48.9 | |
| MUAC (mean, SD) | 148.0 | 11.6 | 151.0 | 11.8 | 0.007 |
| Stunted, N = 441 | 0.002 | ||||
| Normal (z score ≥ –2 SD) | 102 | 45.5 | 122 | 54.5 | |
| Moderate (z score < –2 SD) | 131 | 60.4 | 86 | 39.6 | |
| Wasted, N = 436 | 0.018 | ||||
| Normal (z score ≥ –2 SD) | 222 | 52.1 | 204 | 47.9 | |
| Moderate (z score < –2 SD) | 9 | 90.0 | 1 | 10.0 | |
| Underweight, N= 440 | 0.003 | ||||
| Normal (z score ≥ –2 SD) | 188 | 50.0 | 188 | 50.0 | |
| Moderate (z score < –2 SD) | 45 | 70.3 | 19 | 29.7 | |
Table 3
Multivariable logistic regression model with odds ratios (OR), p-value and confidence intervals (CI) for developmental delay as measured by ASQ.
| ASQ Screen for Developmental Delay | ||||||
|---|---|---|---|---|---|---|
| Full | Adjusted | |||||
| OR | 95% CI | p-value | OR | 95% CI | p-value | |
| Child age (months) | ||||||
| 24–26 | Ref | Ref | Ref | Ref | Ref | Ref |
| 27–29 | 0.71 | [0.41–1.26] | 0.244 | 0.71 | [0.40–1.24] | 0.229 |
| 30–32 | 0.57 | [0.32–1.01] | 0.055 | 0.55 | [0.31–0.99] | 0.045 |
| 33–36 | 0.63 | [0.35–1.15] | 0.134 | 0.61 | [0.34–1.10] | 0.098 |
| Child sex | ||||||
| Male | Ref | Ref | Ref | |||
| Female | 1.36 | [0.91–2.02] | 0.132 | |||
| Interaction: prematurity and/or low birth weight (LBW) and stunting | ||||||
| Not preterm and/or LBW and not stunted | Ref | Ref | Ref | |||
| Not preterm and/or LBW but stunted | 1.89 | [1.23–2.91] | 0.004 | 2.05 | [1.37–3.07] | <0.001 |
| Preterm and/or LBW but not stunted | 15.93 | [0.87–290.44] | 0.062 | 16.13 | [0.89–291.97] | 0.060 |
| Preterm and/or LBW and stunted | 1.38 | [0.60–3.21] | 0.451 | 1.68 | [0.75–3.78] | 0.206 |
| MUAC (mean, SD) | 0.99 | [0.98–1.01] | 0.522 | |||
| Wasted | ||||||
| Normal (z score ≥ –2 SD) | Ref | Ref | Ref | Ref | Ref | Ref |
| Moderate (z score < –2 SD) | 4.10 | [0.65–25.91] | 0.134 | 5.79 | [0.98–34.39] | 0.053 |
| Underweight | ||||||
| Normal (z score ≥ –2 SD) | Ref | Ref | Ref | |||
| Moderate (z score < –2 SD) | 1.33 | [0.67–2.66] | 0.415 | |||