
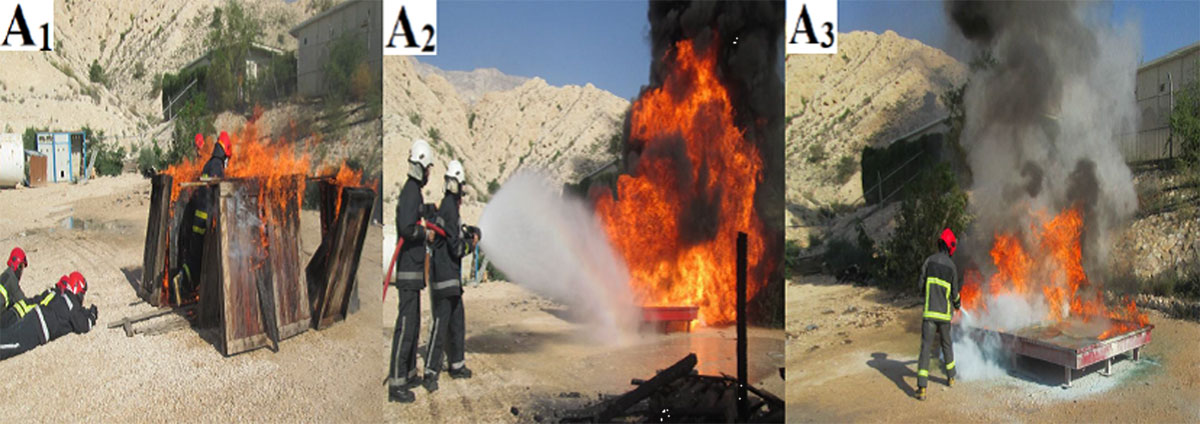
Figure 1
A1) Passing through the live-fire, A2) Extinguishing fire using water, A3) Shutting off fire with fire extinguisher.
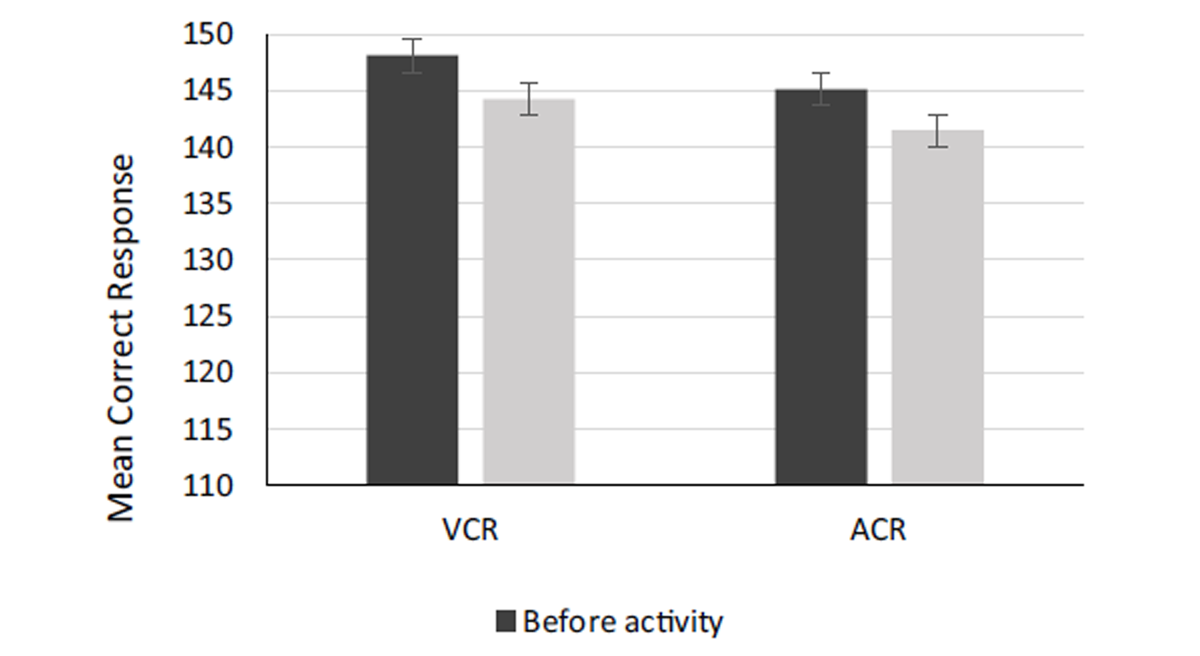
Figure 2
Mean VCR and ACR scores before and after the experiment. VCR and ACR stand for visual correct response (VCR) and auditory correct response (ACR) in the continuous performance test.
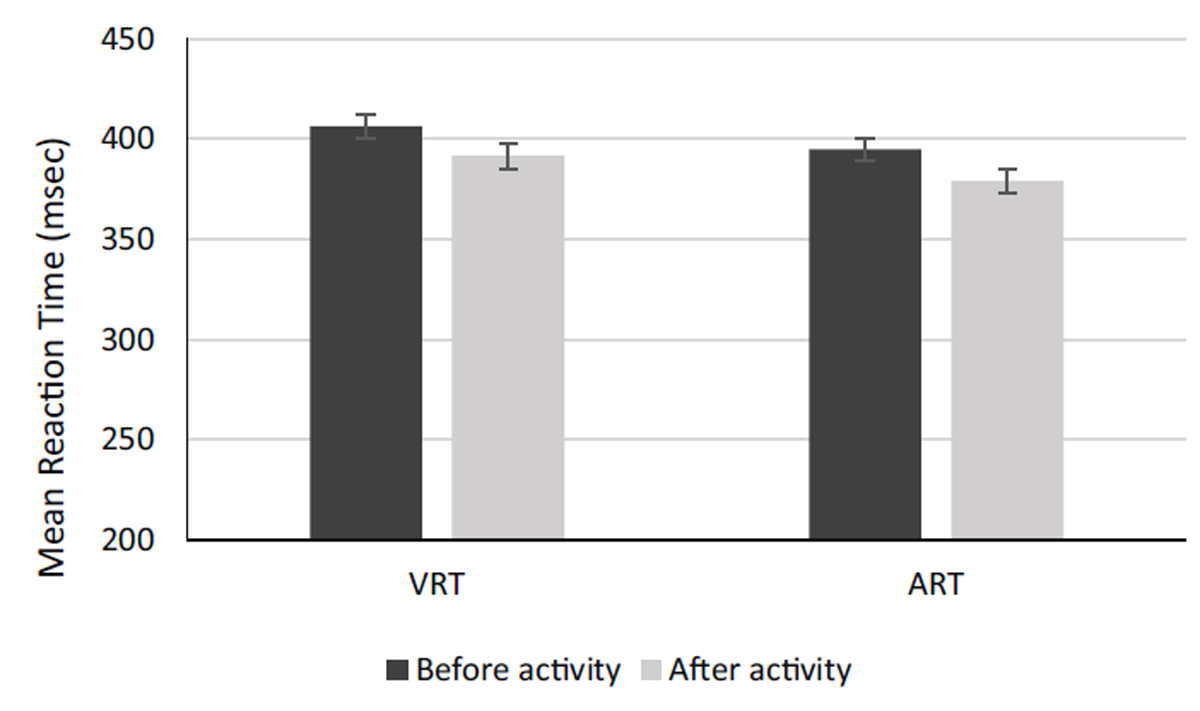
Figure 3
Means of VRT and ART scores before and after the experiment. VRT and ART stand for visual reaction time (VRT) and auditory reaction time (ART) in the continuous performance test.
Table 1
Paired comparison of visual continuous performance test (VCPT) and auditory continuous performance test (ACPT) before and after the experiment.
| Cognitive function test | Mean Difference | SE | p value |
|---|---|---|---|
| (before -VRT vs. after -VRT) | 17.11 | 2.31 | <0.05 |
| (before -ART vs. after -ART) | 16.77 | 2.04 | <0.05 |
| (after -VRT vs. after -ART) | 11.66 | 0.90 | <0.05 |
| (before -VCR vs. after -VCR) | 4.00 | 0.35 | <0.05 |
| (before -ACR vs. after -ACR) | 3.66 | 0.45 | <0.05 |
| (after -VCR vs. after -ACR) | 2.61 | 0.25 | <0.05 |
[i] Note: SE = standard error; VCR = visual correct response; VRT = visual reaction time; ACR = auditory correct response; ART = auditory reaction rime.
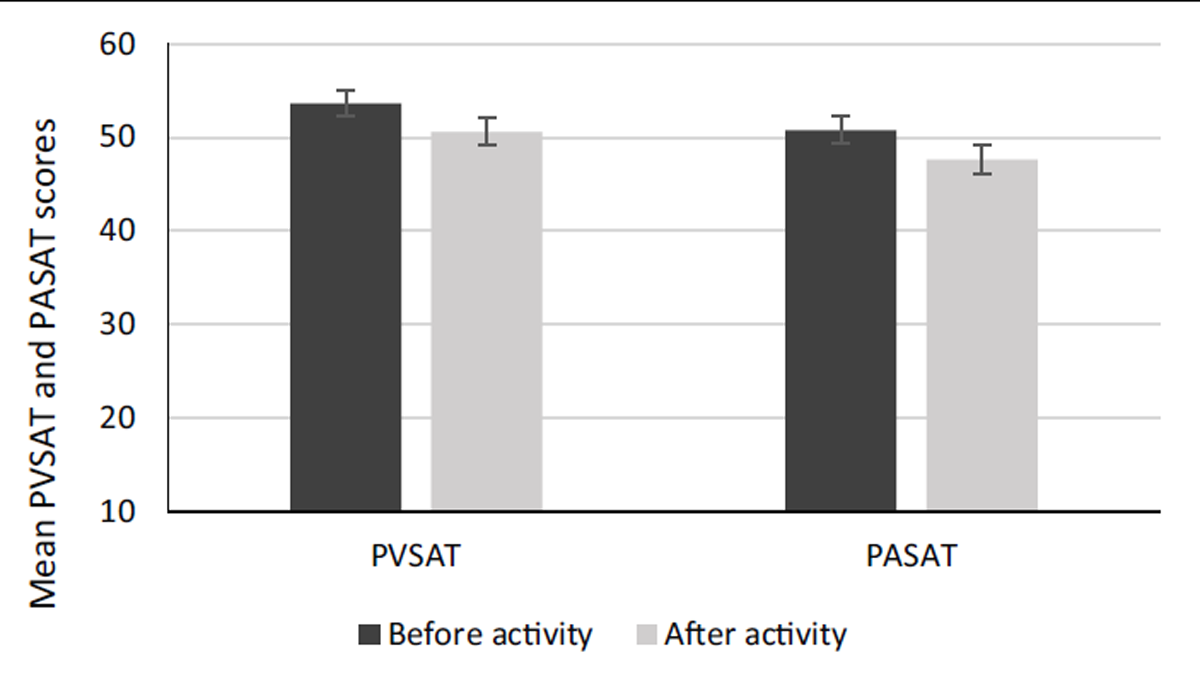
Figure 4
Means of PVSAT and PASAT scores before and after the experiment.
Table 2
Paired comparison of paced visual serial addition test (PVSAT) and paced auditory serial addition test (PASAT) before and after the experiment.
| Cognitive function test | Mean Difference | SE | P value |
|---|---|---|---|
| (before -PVSAT vs. after -PVSAT) | 3.05 | 0.23 | <0.05 |
| (before -PASAT vs. after -PASAT) | 3.22 | 0.26 | <0.05 |
| (after -PVSAT vs. after -PASAT) | 2.77 | 0.20 | <0.05 |
[i] Note: SE = standard error.