
Table 1
Distribution descriptive for prevalence of hypertension and its related factors in 182 countries.
| N (missing) | Min | Max | Percentiles | Mean | SD | |||
|---|---|---|---|---|---|---|---|---|
| 25 | 50 | 75 | ||||||
| Prevalence (%) | ||||||||
| Male | 182(0) | 15.0 | 45.0 | 21.0 | 23.0 | 28.0 | 25.0 | 5.9 |
| Female | 182(0) | 9.0 | 38.0 | 19.0 | 21.0 | 24.0 | 21.7 | 5.0 |
| Total | 182(0) | 13.0 | 41.0 | 20.0 | 22.0 | 25.0 | 23.4 | 5.2 |
| HDI | 182(0) | 0.352 | 0.949 | 0.579 | 0.733 | 0.811 | 0.700 | 0.153 |
| Life expectancy at birth | 182(0) | 50.1 | 83.7 | 66.0 | 73.5 | 77.0 | 71.5 | 8.1 |
| Expected years of schooling | 182(0) | 5.0 | 20.4 | 10.9 | 13.2 | 15.0 | 13.0 | 2.8 |
| Mean years of schooling | 182(0) | 1.4 | 13.4 | 6.1 | 8.7 | 11.1 | 8.4 | 3.1 |
| GNI per capita | 182(0) | 587.0 | 129916.0 | 3433.3 | 10492.5 | 23517.0 | 17072.3 | 18601.5 |
| Alcohol (%) | ||||||||
| Male | 180(2) | 0.0 | 25.0 | 4.0 | 11.0 | 16.0 | 10.4 | 6.6 |
| Female | 180(2) | 0.0 | 7.0 | 1.0 | 2.0 | 3.0 | 2.2 | 1.8 |
| Total | 180(2) | 0.0 | 15.0 | 2.3 | 6.0 | 9.0 | 6.2 | 4.0 |
| Physical inactivity (%) | ||||||||
| Male | 155(27) | 4.0 | 60.0 | 16.0 | 24.0 | 32.0 | 23.7 | 10.4 |
| Female | 155(27) | 6.0 | 73.0 | 23.0 | 33.0 | 42.0 | 32.7 | 13.2 |
| Total | 155(27) | 5.0 | 65.0 | 19.0 | 29.0 | 37.0 | 28.2 | 11.4 |
| Salt/sodium intake (%) | ||||||||
| Male | 180(2) | 4.0 | 16.0 | 7.0 | 9.0 | 11.0 | 9.2 | 2.5 |
| Female | 180(2) | 4.0 | 14.0 | 7.0 | 8.5 | 10.0 | 8.4 | 2.2 |
| Total | 180(2) | 4.0 | 15.0 | 7.0 | 9.0 | 10.0 | 8.8 | 2.3 |
| Tobacco use (%) | ||||||||
| Male | 143(39) | 1.0 | 77.0 | 21.0 | 30.0 | 41.0 | 32.1 | 14.0 |
| Female | 144(38) | 0.0 | 44.0 | 2.0 | 6.0 | 18.0 | 9.8 | 9.5 |
| Total | 142(40) | 4.0 | 47.0 | 14.0 | 21.0 | 27.0 | 21.2 | 9.1 |
Table 2
The Spearman’s correlations analysis between prevalence (%) and HDI in different populations.
| Factor | Spearman’s rho | Male | Female | Total |
|---|---|---|---|---|
| HDI | Correlation Coefficient | 0.385** | –0.017 | 0.215** |
| P | <0.001 | 0.815 | 0.004 | |
| N | 182 | 182 | 182 | |
| Life expectancy at birth | Correlation Coefficient | 0.314** | –0.077 | 0.150* |
| P | <0.001 | 0.299 | 0.043 | |
| N | 182 | 182 | 182 | |
| Expected years of schooling | Correlation Coefficient | 0.406** | 0.065 | 0.262** |
| P | <0.001 | 0.385 | <0.001 | |
| N | 182 | 182 | 182 | |
| Mean years of schooling | Correlation Coefficient | 0.414** | 0.062 | 0.262** |
| P | <0.001 | 0.403 | <0.001 | |
| N | 182 | 182 | 182 | |
| GNI per capita | Correlation Coefficient | 0.319** | –0.078 | 0.152* |
| P | <0.001 | 0.296 | 0.041 | |
| N | 182 | 182 | 182 | |
| Alcohol rate | Correlation Coefficient | 0.517** | 0.313** | 0.456** |
| P | <0.001 | 0.000 | <0.001 | |
| N | 180 | 180 | 180 | |
| Physical inactivity rate | Correlation Coefficient | 0.262** | –0.106 | 0.086 |
| P | 0.001 | 0.189 | 0.290 | |
| N | 155 | 155 | 155 | |
| Salt/sodium intake rate | Correlation Coefficient | 0.273** | 0.177* | 0.223** |
| P | <0.001 | 0.018 | 0.003 | |
| N | 180 | 180 | 180 | |
| Tobacco use rate | Correlation Coefficient | 0.254** | 0.251** | 0.371** |
| P | 0.002 | 0.002 | <0.001 | |
| N | 143 | 144 | 142 |
[i] Note: ** Correlation is significant at the 0.01 level (2-tailed). * Correlation is significant at the 0.05 level (2-tailed).
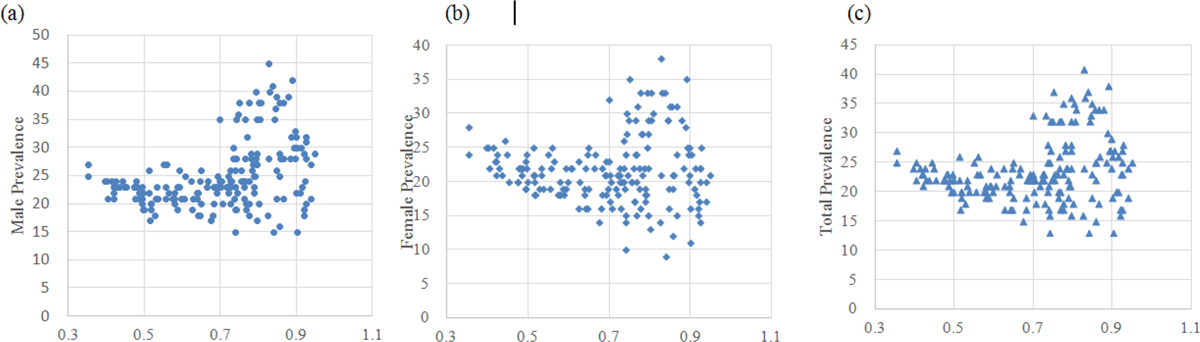
Figure 1
Scatter plots of HDI and prevalence in male, female, and total population.
Table 3
Estimates from general additive models among three populations.
| Source | Male | Female | Total | |||
|---|---|---|---|---|---|---|
| Parameter Estimate | P | Parameter Estimate | P | Parameter Estimate | P | |
| Model 1 | ||||||
| Intercept | 14.590 | <0.0001 | 21.194 | <0.0001 | 18.155 | <0.0001 |
| Linear(HDI) | 14.838 | <0.0001 | 0.689 | 0.7681 | 7.501 | 0.0019 |
| Spline(HDI) | 1.000 | <0.0001 | 1.000 | <0.0001 | 1.000 | 0.0002 |
| R Square | 0.245 | 0.095 | 0.148 | |||
| Model 2 | ||||||
| Intercept | 13.180 | <0.0001 | 25.946 | <0.0001 | 18.446 | <0.0001 |
| Alcohol rate | 0.482 | <0.0001 | 1.251 | <0.0001 | 0.689 | <0.0001 |
| Physical inactivity rate | –.002 | 0.9749 | –0.030 | 0.3512 | –0.015 | 0.7180 |
| Salt/sodium intake rate | 0.107 | 0.6006 | 0.730 | 0.0001 | 0.253 | 0.1879 |
| Tobacco use rate | 0.078 | 0.0150 | 0.248 | <0.0001 | 0.167 | 0.0004 |
| Linear(HDI) | 4.831 | 0.2627 | –20.084 | <0.0001 | –6.118 | 0.1321 |
| Spline(HDI) | 1.000 | 0.0010 | 1.000 | 0.0002 | 1.000 | 0.0030 |
| R Square | 0.474 | 0.485 | 0.428 | |||
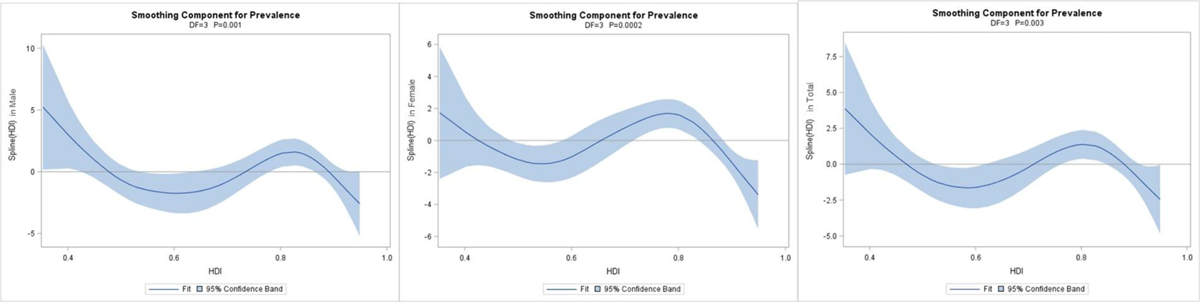
Figure 2
Smoothing components of spline HDI and prevalence in male, female, and total population in model 2.