
Table 1
Socio demographic and economic characteristics of mothers who gave birth at public and private hospitals in Hawassa city hospitals, Southern Ethiopia 2017, (n = 300).
| Variables | Frequency | Percentage | |
|---|---|---|---|
| Age | 18–22 | 68 | 22.7 |
| 23–27 | 100 | 33.3 | |
| 28–32 | 99 | 33.0 | |
| 33–37 | 25 | 8.3 | |
| 38–45 | 8 | 2.7 | |
| Religion | Orthodox Christian | 86 | 28.7 |
| Protestant | 145 | 48.3 | |
| Muslim | 56 | 18.7 | |
| Catholic | 2 | .7 | |
| Jehovah witness | 3 | 1.0 | |
| otherΩ | 8 | 2.7 | |
| Ethnicity | Sidama | 106 | 35.3 |
| Wolayta | 45 | 15.0 | |
| Amara | 62 | 20.7 | |
| Oromo | 78 | 26.0 | |
| Other© | 9 | 3.0 | |
| Marital status | Single | 9 | 3.0 |
| Divorced | 3 | 1.0 | |
| Widowed | 1 | .3 | |
| Married | 287 | 95.7 | |
| Occupation of the mother | House wife | 137 | 45.7 |
| Government employed | 73 | 24.3 | |
| NGO employed | 14 | 4.7 | |
| Private | 44 | 14.7 | |
| Student | 25 | 8.3 | |
| Other® | 7 | 2.3 | |
| Occupation of spouse | Farmer | 55 | 18.3 |
| Government employee | 115 | 38.3 | |
| NGO employee | 20 | 6.7 | |
| Private | 95 | 31.7 | |
| Student | 5 | 1.7 | |
| Other€ | 10 | 3.3 | |
| Residency | Urban | 233 | 77.7 |
| Rural | 67 | 22.3 | |
| Monthly income | Extreme poor | 60 | 20.0 |
| Under poverty | 24 | 8.0 | |
| Above poverty | 216 | 72.0 | |
| Educational status of mother | Illiterate | 48 | 16.0 |
| Read and write | 7 | 2.3 | |
| Primary school complete | 66 | 22.0 | |
| Secondary school complete | 64 | 21.3 | |
| Above secondary school | 21 | 7.0 | |
| Graduated from college or university | 94 | 31.3 |
[i] OtherΩ: waqfetah, Traditional believer. Other©: Silte, kaffa. Other®: pension, merchant. other€: pension.
Table 2
Obstetric characteristics of mothers who gave birth at public and private hospitals in Hawassa city hospitals, Southern Ethiopia 2017, (n = 300).
| Variables | Frequency | Percentage (%) | |
|---|---|---|---|
| Para | Nulipara | 30 | 10.0 |
| Multipara | 265 | 88.3 | |
| Grandpara | 5 | 1.7 | |
| Pregnancy | Planned | 280 | 93.3 |
| Unplanned | 20 | 6.7 | |
| Gestational age | Pre-term | 26 | 8.7 |
| Term | 267 | 89.0 | |
| Post term | 7 | 2.3 | |
| ANC follow up | Yes | 285 | 95.0 |
| No | 15 | 5.0 | |
| Number of ANC visit | No visit | 15 | 5 |
| 1 | 6 | 2 | |
| 2 | 34 | 11.3 | |
| 3 | 43 | 14.3 | |
| 4 | 150 | 50 | |
| More than four | 52 | 17.3 | |
| Referral status | Refer | 90 | 30.0 |
| Not refer | 210 | 70.0 | |
| Day of admission | Working day | 233 | 77.7 |
| Other day | 67 | 22.3 | |
| Time of admission | Morning | 112 | 37.3 |
| Midday | 69 | 23.0 | |
| Evening | 86 | 28.7 | |
| Night | 33 | 11.0 | |
| Previous pregnancy complication | Yes | 72 | 24.0 |
| No | 228 | 76.0 | |
| Types of previous pregnancy complication | c/s scar | 36 | 12 |
| still birth/neonatal loss | 27 | 9 | |
| Over weight baby | 4 | 1.3 | |
| Other◈ | 5 | 1.7 | |
| Types of c/s | Elective c/s | 42 | 14 |
| Emergency c/s | 106 | 35.3 | |
| Maternal preference of mode of delivery | Caesarean section | 38 | 12.7 |
| Spontaneous vaginal delivery | 262 | 87.3 |
[i] Other◈: Hypertension, obstructed labor.
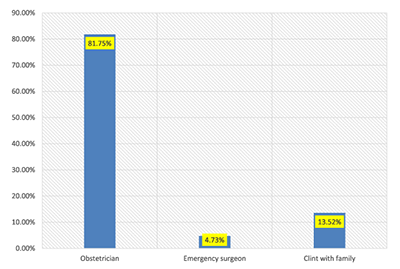
Figure 1
Decision for caesarean section delivery in Hawassa city hospitals.
Table 3
Factors associated with caesarean section delivery among mothers who gave birth at public and private hospitals in Hawassa city hospitals, Southern Ethiopia, 2017 (n = 300).
| Characteristic/s | C/S delivery | OR (95% CI) | P-Value | |||
|---|---|---|---|---|---|---|
| Yes | No | Crude | Adjusted | |||
| Age | 18–32 | 130 | 137 | 0.79 (0.38–1.63) | ||
| 33–45 | 18 | 15 | 1.00 | |||
| Residency | Urban | 118 | 115 | 1.27 (0.73–2.18) | ||
| Rural | 30 | 37 | 1.00 | |||
| Marital status | Married | 144 | 143 | 2.27 (0.68–7.52) | ||
| Not married | 4 | 9 | 1.00 | |||
| Monthly Income | Above poverty | 115 | 101 | 1.76 (1.05–2.94)* | 3.78 (1.86–7.69)** | 0.00 |
| Under poverty | 33 | 51 | 1.00 | 1.00 | ||
| ANC follow-up | Yes | 139 | 146 | 0.64 (0.22–1.83) | ||
| No | 9 | 6 | 1.00 | |||
| Pregnancy | Planned | 142 | 138 | 2.40 (0.89–6.43) | ||
| Un planned | 6 | 14 | 1.00 | |||
| GA | Term | 133 | 134 | 1.19 (0.58–2.46) | ||
| Pre/post-term | 15 | 18 | 1.00 | |||
| Day of admission | Working day | 110 | 123 | 0.68 (0.39–1.18) | ||
| Weekend | 38 | 29 | 1.00 | |||
| Previous pregnancy complication | Yes | 55 | 17 | 4.69 (2.56–8.59)* | 4.63 (2.15–9.97)** | 0.000 |
| No | 93 | 135 | 1.00 | 1.00 | ||
| Condition of mother | Stable | 141 | 147 | 0.68 (0.21–2.20) | ||
| Unstable | 7 | 5 | 1.00 | |||
| Parthograph follow up | Yes | 105 | 43 | 1.00 | 1.00 | |
| No | 143 | 9 | 0.15 (0.72–0.33)* | 0.12 (0.04–0.32)** | 0.000 | |
| Amniotic fluid | Rupture | 30 | 28 | 1.13 (0.64–1.99) | ||
| Intact | 118 | 124 | 1.00 | |||
| Current obstetrics problem | Yes | 50 | 26 | 2.48 (1.44–4.25)* | 8.15 (4.25–15.62)** | 0.000 |
| No | 98 | 126 | 1.00 | 1.00 | ||
| Number of senior | Two | 40 | 25 | 1.88 (1.07–3.23)* | 0.57 (0.06–5.47) | 0.63 |
| More than two | 108 | 127 | 1.00 | 1.00 | ||
| Payment for delivery | Yes | 39 | 20 | 2.36 (1.30–4.29)* | 4.55 (0.44–47.34) | 0.20 |
| No | 109 | 132 | 1.00 | 1.00 | ||
| Parity | Prime Para | 18 | 12 | 1.62 (0.75–3.48) | ||
| Multi Para | 130 | 140 | 1.00 | |||
| Types of hospital | Public | 109 | 131 | 0.45 (0.25–0.80)* | 0.56 (0.28–1.07) | |
| Private | 39 | 21 | 1.00 | |||
[i] * P-value ≤ 0.25.
** Adjusted for socio-demographic characteristics and some concepts of Mode of delivery.
Table 4
Factors associated with maternal preference for caesarean section delivery among who gave birth at public and private hospitals in Hawassa city hospitals, Southern Ethiopia 2017, (n = 300).
| Characteristics | Maternal Preference C/S delivery | OR (95% CI) | P-Value | |||
|---|---|---|---|---|---|---|
| Yes | No | Crude | Adjusted | |||
| Age | 18–32 | 35 | 232 | 1.51 (0.19–2.29) | ||
| 33–45 | 3 | 30 | 1.00 | |||
| Residency | Urban | 35 | 198 | 0.27 (0.08–0.89)* | 2.45 (0.61–10.12) | 0.204 |
| Rural | 3 | 64 | 1.00 | 1.00 | ||
| Marital status | Married | 36 | 251 | 0.79 (0.17–3.70) | ||
| Not married | 2 | 11 | 1.00 | |||
| Monthly Income | Above poverty | 33 | 183 | 2.85 (1.07–7.57)* | 2.24 (0.69–7.26) | 0.178 |
| Under poverty | 5 | 79 | 1.00 | 1.00 | ||
| ANC follow-up | Yes | 36 | 249 | 0.94 (0.20–4.34) | ||
| No | 2 | 13 | 1.00 | |||
| Pregnancy | Planned | 36 | 244 | 1.33 (0.29–5.96) | ||
| Un planned | 2 | 18 | 1.00 | |||
| GA | Term | 36 | 231 | 2.42 (0.55–10.50) | 1.99 (0.37–10.72) | 0.42 |
| Pre/post-term | 2 | 31 | 1.00 | 1.00 | ||
| Previous Pregnancy complication | Yes | 25 | 47 | 8.80 (4.19–18.45)* | 10.02 (4.50–22.33)** | 0.000 |
| No | 13 | 215 | 1.00 | 1.00 | ||
| Parthograph follow up | Yes | 23 | 225 | 0.25 (0.12–0.53)* | 0.25 (0.10–0.62)** | 0.002 |
| No | 15 | 37 | 1.00 | 1.00 | ||
| Amniotic fluid | Rupture | 4 | 54 | 0.45 (0.15–1.33) | ||
| Intact | 34 | 208 | 1.00 | |||
| Current obstetrics problem | Yes | 11 | 128 | 0.43 (0.20–0.89)* | 0.53 (0.22–1.29) | 0.164 |
| No | 27 | 134 | 1.00 | 1.00 | ||
| Payment for delivery | Yes | 9 | 50 | 1.32 (0.59–2.96) | ||
| No | 29 | 212 | 1.00 | |||
| Parity | Prime Para | 2 | 28 | 0.46 (0.17–2.03) | ||
| Multi Para | 36 | 234 | 1.00 | |||
[i] * P-value ≤ 0.25.
** Adjusted for socio demographic characteristic/s and some concepts of maternal.