
Table 1
Site-wise distribution of HAV and HEV infection in nationwide surveillance in Bangladesh.
| Surveillance Sites | Enrolled patients | Sample tested | HAV, n (%) | HEV, n (%) | Divisions |
|---|---|---|---|---|---|
| Narshindi | 52 | 52 | 11 (21.2) | 4 (7.7) | Dhaka |
| Habiganj | 204 | 204 | 77 (37.8) | 11 (5.4) | Sylhet |
| Cox’s Bazar | 83 | 83 | 11 (13.3) | 4 (4.8) | Chittagong |
| Naogaon | 70 | 67 | 21 (31.3) | 20 (29.9) | Rajshahi |
| Patuakhali | 33 | 33 | 13 (39.4) | 5 (15.2) | Barisal |
| Thakurgaon | 40 | 40 | 8 (20.0) | 4 (10.0) | Rangpur |
| Shatkhira | 232 | 232 | 5 (2.2) | 8 (3.5) | Khulna |
| DMCH, Dhaka | 195 | 195 | 14 (7.2) | 19 (9.7) | Dhaka |
| UAMCH, Dhaka | 85 | 73 | 19 (26.0) | 26 (35.6) | Dhaka |
| BITID, Chittagong | 22 | 19 | 12 (63.2) | 2 (10.5) | Chittagong |
| Total | 1016 | 998 | 191 (19.1) | 103 (10.3) |
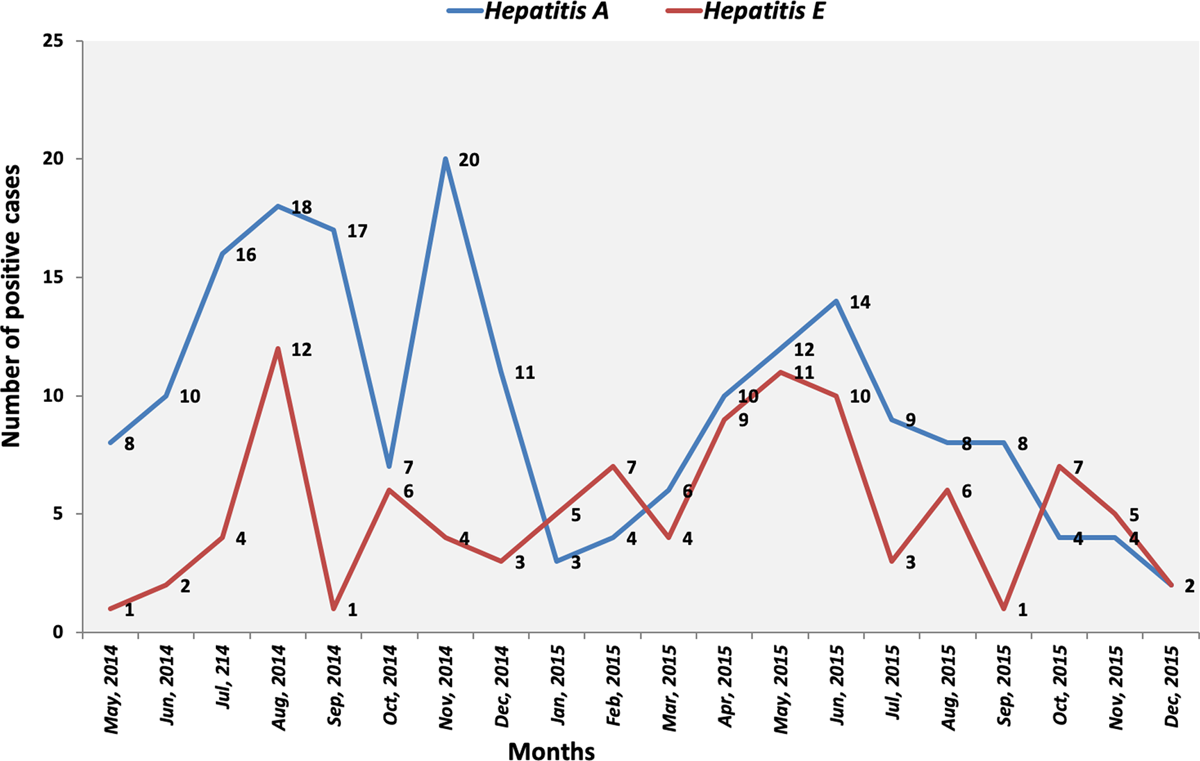
Figure 1
Hepatitis A and Hepatitis E positive patients (in percentage) across the study period.
Table 2
Clinical features of patients (N = 998).
| Characteristics | Overall, n (%) | HAV, n (%) | HEV, n (%) |
|---|---|---|---|
| Jaundice | 998 (100.0) | 191 (100.0) | 103 (100.0) |
| Anorexia | 944 (92.9) | 165 (86.4) | 98 (95.2) |
| Nausea | 814 (80.1) | 154 (80.6) | 84 (81.6) |
| Vomiting | 585 (57.6) | 91 (47.6) | 62 (60.2) |
| Fever | 767 (75.5) | 154 (80.6) | 76 (73.8) |
| Abdominal pain | 797 (78.4) | 134 (70.2) | 82 (79.6) |
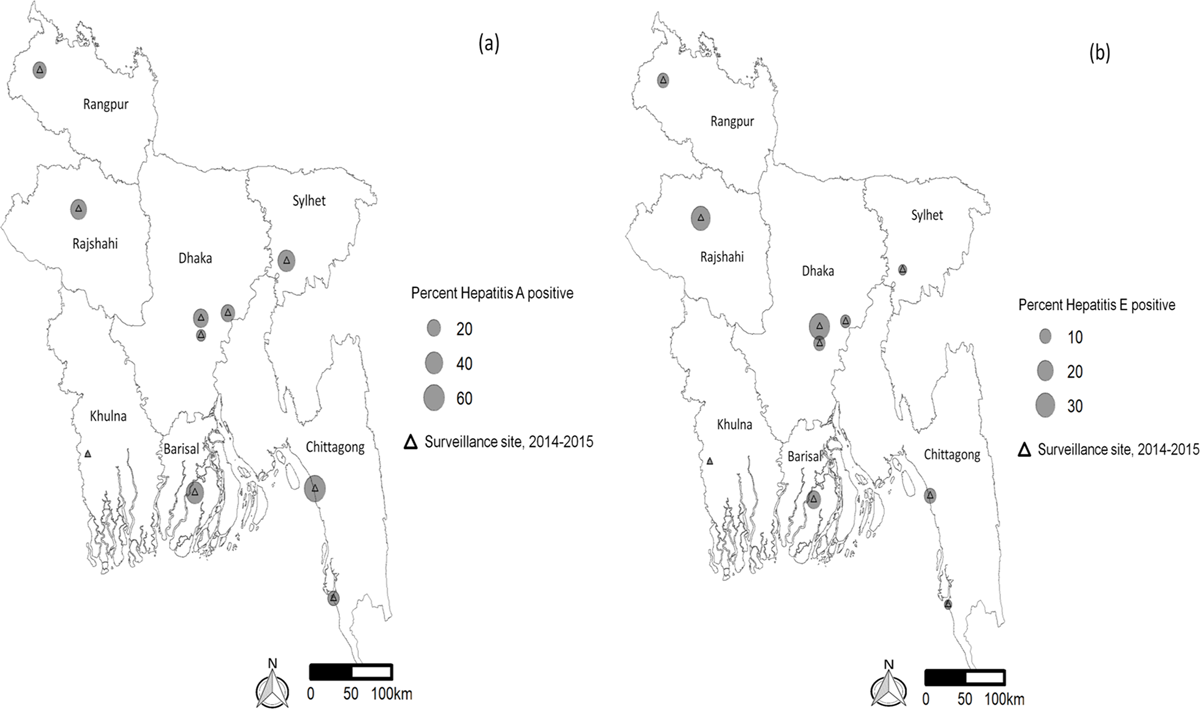
Figure 2
Map of surveillance sites in Bangladesh, showing the percentage of Hepatitis A and Hepatitis E cases among the enrolled febrile illness cases.
Table 3
Demographic characteristics of hepatitis patients in nationwide surveillance in Bangladesh (N = 998).
| Characteristics | Samples tested, n (%) | HAV, n (%) | P-value | HEV, n (%) | P-value |
|---|---|---|---|---|---|
| Age | |||||
| 0–5 | 38 (3.8) | 26 (13.6) | <0.001 | 1 (1.0) | 0.003 |
| 6–14 | 133 (13.3) | 90 (47.1) | 5 (4.9) | ||
| 15–60 | 753 (75.5) | 73 (38.2) | 93 (90.3) | ||
| 60+ | 74 (7.4) | 2 (1.1) | 4 (3.9) | ||
| Median age (IQR) | 26 (18-40) | 12 | 25 | ||
| Gender | |||||
| Male | 681 (68.2) | 112 (58.6) | 0.004 | 76 (73.8) | 0.201 |
| Female | 317 (31.8) | 79 (41.4) | 27 (26.2) | ||
| Occupation | |||||
| Housewife/unemployed | 241 (24.2) | 12 (6.3) | <0.001 | 19 (18.5) | 0.019 |
| Agricultural work | 109 (10.9) | 8 (4.2) | 10 (9.7) | ||
| Businessman | 92 (9.2) | 8 (4.2) | 10 (9.7) | ||
| Informal worker | 127 (12.7) | 7 (3.7) | 15 (14.6) | ||
| Service | 92 (9.2) | 7 (3.7) | 19 (18.5) | ||
| Students | 269 (26.9) | 106 (55.5) | 27 (26.2) | ||
| Others (Baby/child) | 68 (6.8) | 43 (22.5) | 3 (2.9) | ||
| Education | |||||
| No formal schooling | 130 (13.0) | 10 (5.2) | <0.001 | 7 (6.8) | 0.007 |
| Primary and JSC | 547 (54.8) | 101 (52.9) | 58 (56.3) | ||
| SSC and above | 251 (25.2) | 30 (15.7) | 36 (35.0) | ||
| Others (child, not completed primary level) | 70 (7.0) | 50 (26.2) | 2 (1.9) | ||
| Total | 998 (100.0) | 191 (100.0) | 103 (100.0) |
Table 4
Multivariate logistic regression analysis to find out the association of HAV and HEV infection.
| Characteristics | Hepatitis A | Hepatitis E | ||
|---|---|---|---|---|
| cOR1 (95% CI) | aOR1 (95% CI) | cOR1 (95% CI) | aOR1 (95% CI) | |
| Age (year) | ||||
| 0–5 | 1.00 | 1.00 | 0.7 (0.1, 6.1) | 1.1 (0.1, 18.6) |
| 6–14 | 1.0 (0.4, 2.1) | 1.6 (0.5, 5.2) | 1.00 | 1.00 |
| 15–60 | 0.1*(0.0, 0.1) | 0.3 (0.1, 1.2) | 3.6*(1.4, 9.0) | 4.3*(1.4, 13.1) |
| 60+ | 0.0*(0.0, 0.1) | 0.1*(0.2, 0.9) | 1.5 (0.4, 5.6) | 2.9 (0.6, 13.6) |
| Gender | ||||
| Male | 1.00 | 1.00 | 1.00 | – |
| Female | 1.69*(1.2, 2.3) | 1.8*(1.1, 2.8) | 0.7 (0.5, 1.2) | – |
| Occupation | ||||
| Housewife/unemployed | 1.00 | 1.00 | 1.00 | 1.00 |
| Agricultural work | 1.5 (0.6, 3.8) | 2.4 (0.9, 6.6) | 1.2 (0.5, 2.6) | 1.1 (0.4, 3.0) |
| Businessman | 1.8 (0.7, 4.6) | 3.3*(1.1, 9.4) | 1.4 (0.6, 3.2) | 1.3 (0.5, 3.4) |
| Informal worker | 1.1 (0.4, 2.9) | 1.3 (0.4, 3.8) | 1.6 (0.8, 3.2) | 1.7 (0.7, 4.2) |
| Service | 1.6 (0.6, 4.1) | 3.2*(1.0, 9.5) | 3.0*(1.5, 6.1) | 2.8*(1.1, 7.1) |
| Students | 12.4*(6.6, 23.3) | 8.9*(3.7, 21.5) | 1.3 (0.7, 2.4) | 1.8 (0.8, 4.1) |
| Others (Baby/child) | 32.8*(15.3, 70.3) | 5.8*(1.4, 23.8) | 0.5 (0.2, 1.9) | 1.7 (0.3, 10.2) |
| Education | ||||
| No formal schooling | 1.00 | 1.00 | 1.00 | 1.00 |
| Primary and JSC | 2.7*(1.4, 5.4) | 0.6 (0.2, 1.3) | 2.1 (0.9, 4.7) | 2.1 (0.9, 4.9) |
| SSC and above | 1.6 (0.8, 3.4) | 0.4*(0.1, 1.0) | 2.9*(1.3, 6.8) | 1.9 (0.7, 5.0) |
| Others (child, not completed primary level) | 30.0*(13.1, 68.6) | 1.7 (0.4, 6.9) | 0.5 (0.1, 2.6) | 1.3 (0.1, 14.2) |
[i] 1 aOR, adjusted odds ratio; cOR, crude odds ratio.