
Table 1
Characteristics of respondents for 4 years from baseline (2014) to endline (2017).
| Baseline N = 461 (%) | Midline I N = 592 (%) | Midline II N = 685 (%) | Endline N = 693 (%) | |
|---|---|---|---|---|
| ANC Services | ||||
| More than 4 times | 191 (41.4) | 348 (58.8) | 285 (41.6) | 370 (53.4) |
| Less than 4 times | 270 (58.6) | 244 (41.2) | 400 (58.4) | 323 (46.6) |
| Respondent Age (Mean ± SD) | 29.7 ± 7.2 | 29.4 ± 6.9 | 29.2 ± 7.2 | 29.5 ± 7.0 |
| Monthly Income USD (Mean ± SD) | 49.4 ± 83.8 | 57.2 ± 55.2 | 45.4 ± 78.1 | 58.0 ± 75.6 |
| Number of Household | ||||
| ≤6 | 424 (70.4) | 380 (61.1) | 481 (67.8) | 442 (61.5) |
| 7–10 | 161 (26.7) | 224 (36.0) | 211 (29.8) | 257 (35.7) |
| ≥11 | 17 (29) | 18 (2.9) | 17 (2.4) | 20 (2.8) |
| Writing Skills | ||||
| Yes | 376 (62.5) | 412 (66.2) | 448 (62.7) | 442 (61.5) |
| No | 226 (37.5) | 210 (33.8) | 267 (37.3) | 227 (38.5) |
| Education | ||||
| Preschool | N/A | 29 (4.8) | 44 (6.3) | 44 (6.3) |
| Primary School | N/A | 60 (9.9) | 50 (7.2) | 60 (8.6) |
| Secondary School | N/A | 435 (71.8) | 504 (72.5) | 498 (71.3) |
| ≥Higher Education | N/A | 82 (13.2.5) | 97 (14.0) | 96 (13.8) |
| Number of Pregnancies (Mean ± SD) | 3.7 ± 2.1 | 4.4 ± 2.4 | 3.9 ± 2.2 | 4.2 ± 2.4 |
| Number of Births (Mean ± SD) | 3.5 ± 2.1 | 4.1 ± 2.3 | 2.6 ± 2.1 | 3.9 ± 2.3 |
Table 2
Decision tree model’s goodness of fit.
| Midline I (2015) | Midline II (2016) | Endline (2017) | ||||
|---|---|---|---|---|---|---|
| Train | Validation | Train | Validation | Train | Validation | |
| Misclassification | 0.348 | 0.380 | 0.388 | 0.388 | 0.385 | 0.395 |
| Average Squared Error | 0.224 | 0.239 | 0.231 | 0.234 | 0.234 | 0.242 |
Table 3
Variable importance rank of decision tree model.
| Rank | Midline I (2015) | Midline II (2016) | Endline (2017) | |||
|---|---|---|---|---|---|---|
| Variable | Importance | Variable | Importance | Variable | Importance | |
| 1 | Hand-washing | 1.000 | MCH Promotion by Signboard | 1.000 | Distance | 1.000 |
| 2 | Writing Skills | 0.891 | Income | 0.970 | Abortion | 0.940 |
| 3 | Satisfaction with Health Facility | 0.869 | Abortion | 0.894 | Knowledge of Exclusive Breastfeeding | 0.806 |
| 4 | Age | 0.782 | ||||
| 5 | Awareness of Intervention | 0.621 | ||||
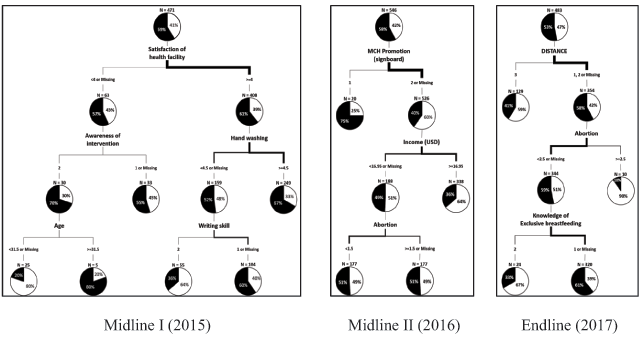
Figure 1
The result of decision tree nodes from midline I (2015) to endline (2017).