
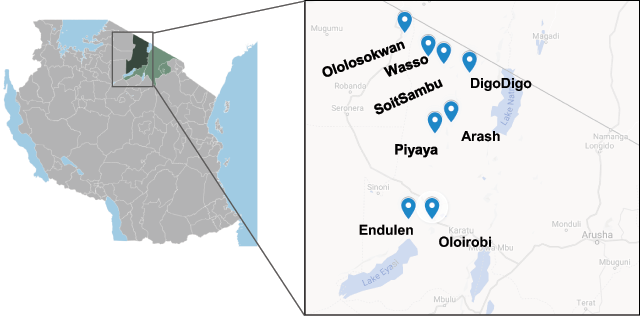
Figure 1
Clinical Site Locations. Highlighted in dark green is the Ngorongoro district of the Arusha province of Tanzania (the remainder of which is shaded in light green). This figure was made using Google Custom Maps and an image from Wikipedia (ZH – Own work, CC BY-SA 3.0. https://commons.wikimedia.org/w/index.php?curid=15893018).
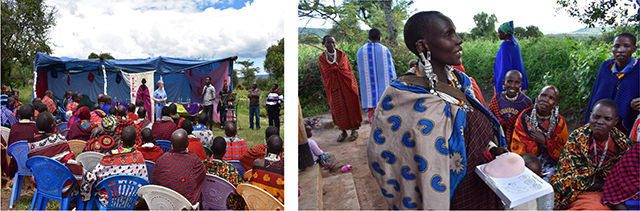
Figure 2
Interactive nature of the educational presentations. At the marketplace presentations, participants were encouraged to engage with the educational materials and ask questions.
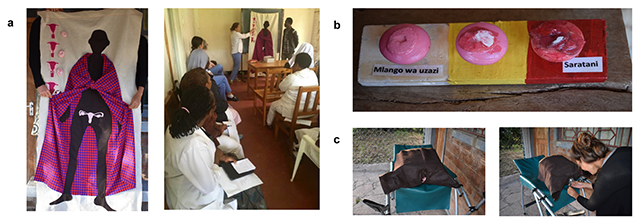
Figure 3
Depicting anatomy, pathophysiology, and the pelvic exam in a culturally sensitive manner. a. Anatomy was shown in situ superimposed on a human figure to help orient the women as we found that isolated pictures of organs in the human body which are “hidden” in the body did not register with the women. The uterus and cervix were discussed in terms of pregnancy and delivery as this is a familiar process to these women. b. The healthy cervix was shown alongside treatable pre-cancer and invasive cancer. The women held props made from doorknobs with painted clay “lesions,” which represented the progression from normal to invasive cervical cancer. c. A pelvic model made from felt and a cardboard box facilitated demonstration of the speculum exam. Women were also allowed to hold the speculum in order to demystify this tool.
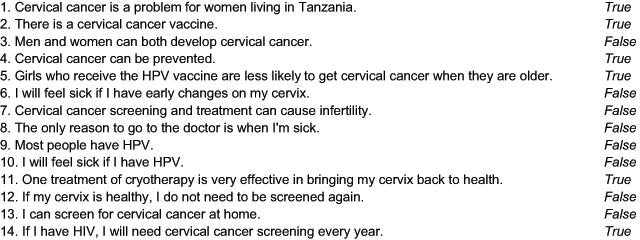
Figure 4
Educational Screening Quiz. The statements were designed after observations of local beliefs and utilization of the local health care clinic.
Table 1
Baseline Perceptions, % Correct.
| Statement | Maasai (n = 17) | Non-Maasai (n = 15) | HCWs (n = 34) |
|---|---|---|---|
| 1. Cervical cancer is a problem for women living in Tanzania. | 76.5 | 93.3 | 85.3 |
| 2. There is a cervical cancer vaccine. | 41.2 | 80 | 94.1 |
| 3. Men and women can both develop cervical cancer. | 29.4 | 33.3 | 67.6 |
| 4. Cervical cancer can be prevented. | 35.3 | 86.7 | 100 |
| 5. Girls who receive the HPV vaccine are less likely to get cervical cancer when they are older. | 23.5 | 53.3 | 82.4 |
| 6. I will feel sick if I have early changes on my cervix. | 76.5 | 40 | 50 |
| 7. Cervical cancer screening and treatment can cause infertility. | 64.7 | 53.3 | 76.5 |
| 8. The only reason to go to the doctor is when I’m sick. | 5.8 | 53.3 | 55.9 |
| 9. Most people have HPV. | 5.8 | 66.7 | 47.1 |
| 10. I will feel sick if I have HPV. | 41.2 | 26.7 | 32.4 |
| 11. One treatment of cryotherapy is very effective in bringing my cervix back to health. | 29.4 | 93.3 | 35.3 |
| 12. If my cervix is healthy, I do not need to be screened again. | 70.6 | 46.7 | 85.3 |
| 13. I can screen for cervical cancer at home. | 94.1 | 86.7 | 82.4 |
| 14. If I have HIV, I will need cervical cancer screening every year. | 35.3 | 66.7 | 67.6 |
[i] HCWs = health care workers.
Table 2
After the educational intervention, a significant improvement in quiz scores was seen in all groups.
| n | Pre Score Mean (%) | Post Score Mean (%) | Improvement (%) | P value | |
|---|---|---|---|---|---|
| Maasai | 17 | 44.3 | 65.7 | 21.4 | <0.001 |
| Non-Maasai | 15 | 61.9 | 73.3 | 11.4 | <0.05 |
| Health Care Workers | 34 | 68.9 | 84.9 | 16 | <0.001 |
[i] Paired T test analyses demonstrated a significant improvement in quiz scores after the educational intervention among all groups. Score mean indicates average percentage scored correct.
Table 3
Characteristics of Sample Screened for CACX, Post-Intervention.
| Characteristics | Value |
|---|---|
| Participants, n | 200 |
| Ethnicity, n (%) | |
| Maasai | 115 (58) |
| Non-Maasai | 85 (42) |
| Mean age (SD) | 37.6 (2.7) |
| Site, n (%) | |
| Arash | 25 (12.5) |
| DigoDigo | 36 (18.0) |
| Endulen | 4 (2.0) |
| Oloirobi | 33 (16.5) |
| Olosokwan | 4 (2.0) |
| Piyaya | 40 (20.0) |
| SoitSambu | 27 (13.5) |
| Wasso | 31 (15.5) |
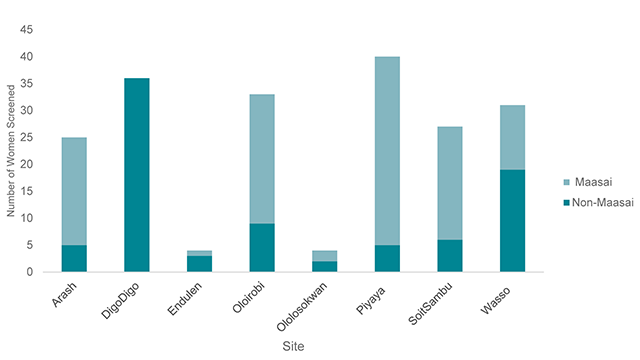
Figure 5
Distribution of Maasai Screened for CACX Post-Intervention Varied by Site.