
Table 1
Demographic characteristics of the 200 study participants.
| Socio-demographic characteristics | Asymptomatic malaria group | Control group | χ2 | p-value |
|---|---|---|---|---|
| n = 100 | n = 100 | |||
| Age (Years) | 19 (19.0) | 19 (19.0) | 0.00 | 1.00 |
| 2–< 5 | 81 (81.0) | 81 (81.0) | ||
| 5–9 | ||||
| Sex | ||||
| Male | 41 (41.0) | 41 (41.0) | ||
| Female | 59 (59.0) | 59 (59.0) | 0.00 | 1.00 |
| Family social class | ||||
| Upper | 10 (16.0) | 2 (2.0) | ||
| Middle | 16 (16.0) | 33 (33.0) | 15.73 | 0.00* |
| Lower | 82 (82.0) | 57 (57.0) | ||
| Household size | ||||
| Small | 79 (79.0) | 80 (80.0) | ||
| Large | 21 (21.0) | 20 (20.0) | 0.00 | 0.97 |
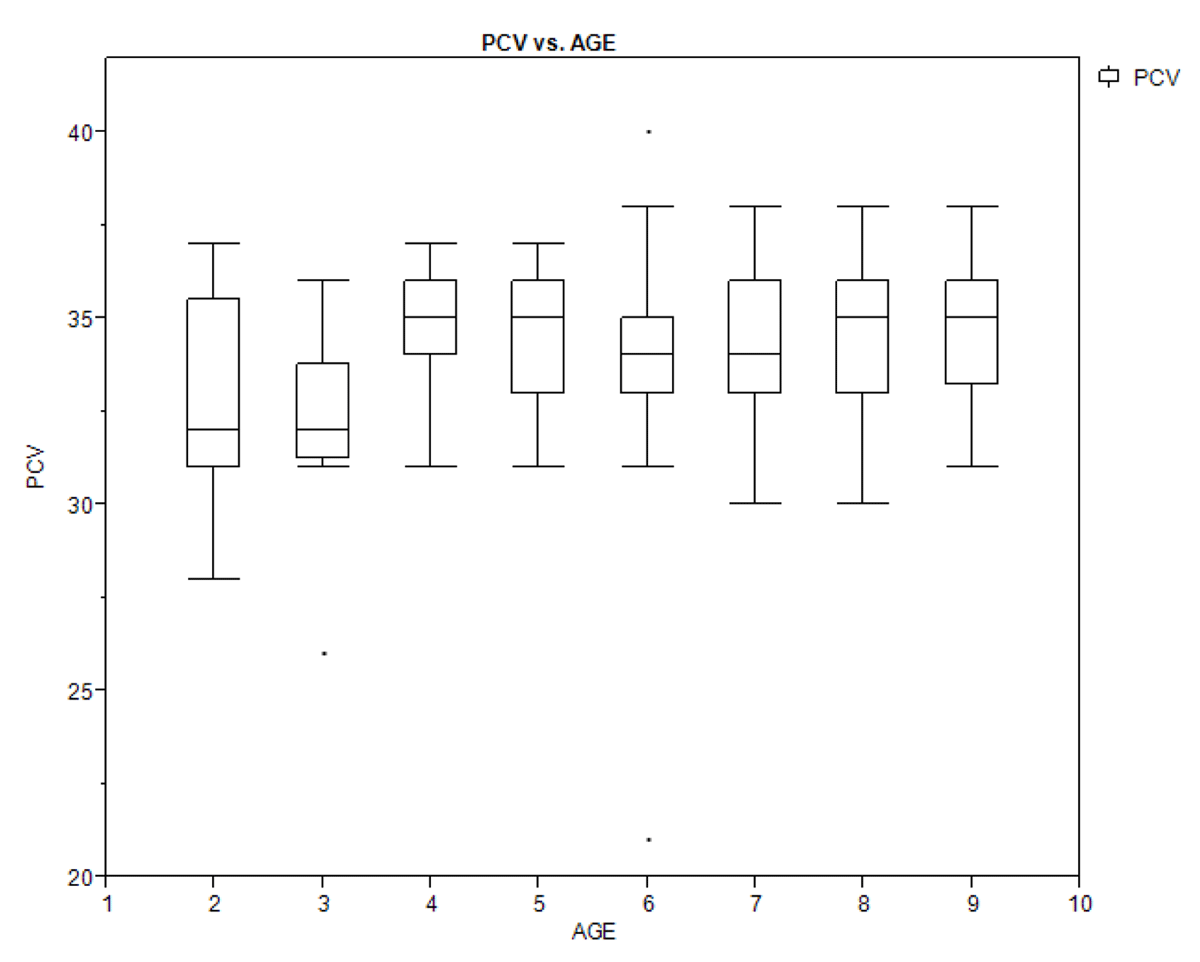
Figure 1A
Box plot showing the relationship between age of the children and their packed cell volume.
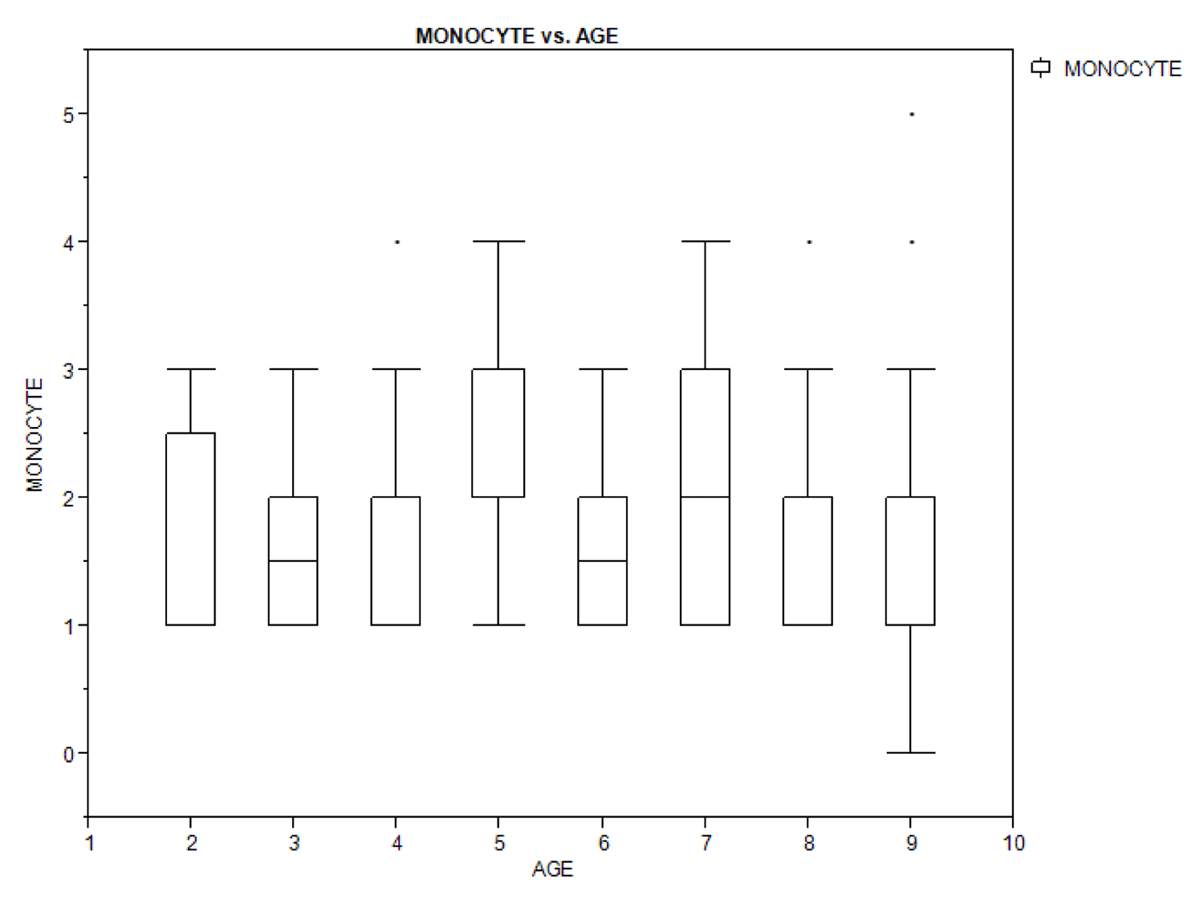
Figure 1B
Box plot showing the relationship between age of the children and their monocyte count.
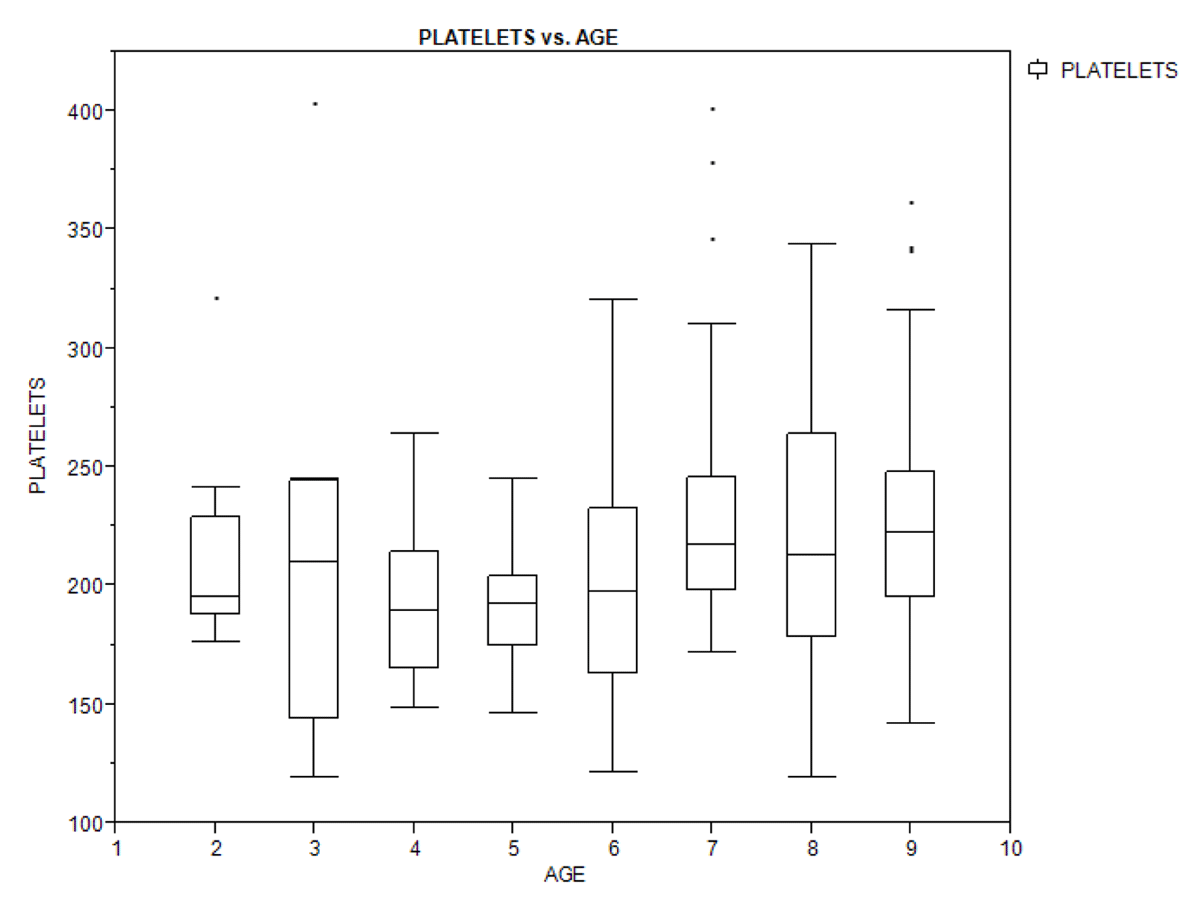
Figure 1C
Box plot showing the relationship between age of the children and their platelets (thrombocyte) count.
Table 2
Haematologic parameters of the 200 study participants (ASMP versus malaria negative controls) in children with splenomegaly and those with no splenomegaly.
| Haematologic parameters | Subjects | Splenomegaly | ||
|---|---|---|---|---|
| Asymptomatic malaria group | Control group | Present | Absent | |
| n = 100 | n = 100 | n = 31 | n = 169 | |
| Haematocrit (%) | ||||
| Mean | 34.42 | 34.15 | 34.30 | 34.30 |
| SD [±] | 2.30 | 2.10 | 2.10 | 2.30 |
| 95% CL | –0.35, 0.89 | –0.85, 0.86 | ||
| p-value | 0.39 | 1.00 | ||
| Thrombocyte count (×109/L) | ||||
| Mean | 203.64 | 230.91 | 217.50 | 217.20 |
| SD [±] | 45.90 | 57.40 | 62.50 | 52.00 |
| 95% CL | –41.76, –12.79 | –20.45, 20.94 | ||
| p-value | 0.00* | 0.98 | ||
| Monocyte count (×109/L) | ||||
| Mean | 2.25 | 1.34 | 1.81 | 1.79 |
| SD [±] | 0.90 | 0.50 | 1.01 | 0.90 |
| 95% CL | 0.70, 1.12 | –0.33, 0.35 | ||
| p-value | 0.00* | 0.94 | ||
[i] p-value* – significant.
Table 3
Bivariate analysis of the haematologic parameters of the 200 study participants (ASMP versus malaria negative controls).
| Haematologic parameters | Subjects | χ2 | OR | p-value | |
|---|---|---|---|---|---|
| ASMP | Control group | ||||
| n = 100 | n = 100 | ||||
| Haematocrit (%) | |||||
| Anaemia | 2 (2.0) | 1 (1.0) | * | 2.0 | 0.56 |
| Normal haematocrit | 98 (98.0) | 99 (99.0) | |||
| Thrombocyte count (×109/L) | |||||
| Thrombocytopaenia | 13 (13.0) | 2 (2.0) | * | 7.3 | 0.003 |
| Normal thrombocyte count | 87 (87.0) | 98 (98.0) | |||
| Monocyte count (×109/L) | |||||
| Monocytosis | 77 (77.0) | 33 (33.0) | 39.11 | 6.8 | 0.00 |
| Normal monocyte | 23 (23.0) | 67 (67.0) | |||
[i] * Fisher’s Exact Test.
Table 4
Bivariate analysis of the haematologic parameters of the 200 study participants (splenomegaly versus no splenomegaly).
| Haematologic parameters | Splenomegaly | χ2 | OR | p-value | |
|---|---|---|---|---|---|
| Present | Absent | ||||
| n = 31 (%) | n = 169 (%) | ||||
| Haematocrit (%) | |||||
| Anaemia | 0 (0.0) | 3 (1.8) | *0.56 | 0.9 | 1.00 |
| Normal haematocrit | 31 (100.0) | 166 (98.2) | |||
| Thrombocyte count (× 109/L) | |||||
| Thrombocytopaenia | 1 (3.2) | 14 (8.3) | *0.97 | 0.4 | 0.33 |
| Normal thrombocyte count | 30 (96.8) | 155 (91.7) | |||
| Monocyte count (× 109/L) | |||||
| Monocytosis | 17 (54.8) | 93 (55.0) | 0.00 | 1.0 | 1.00 |
| Normal monocyte | 14 (45.2) | 76 (45.0) | |||
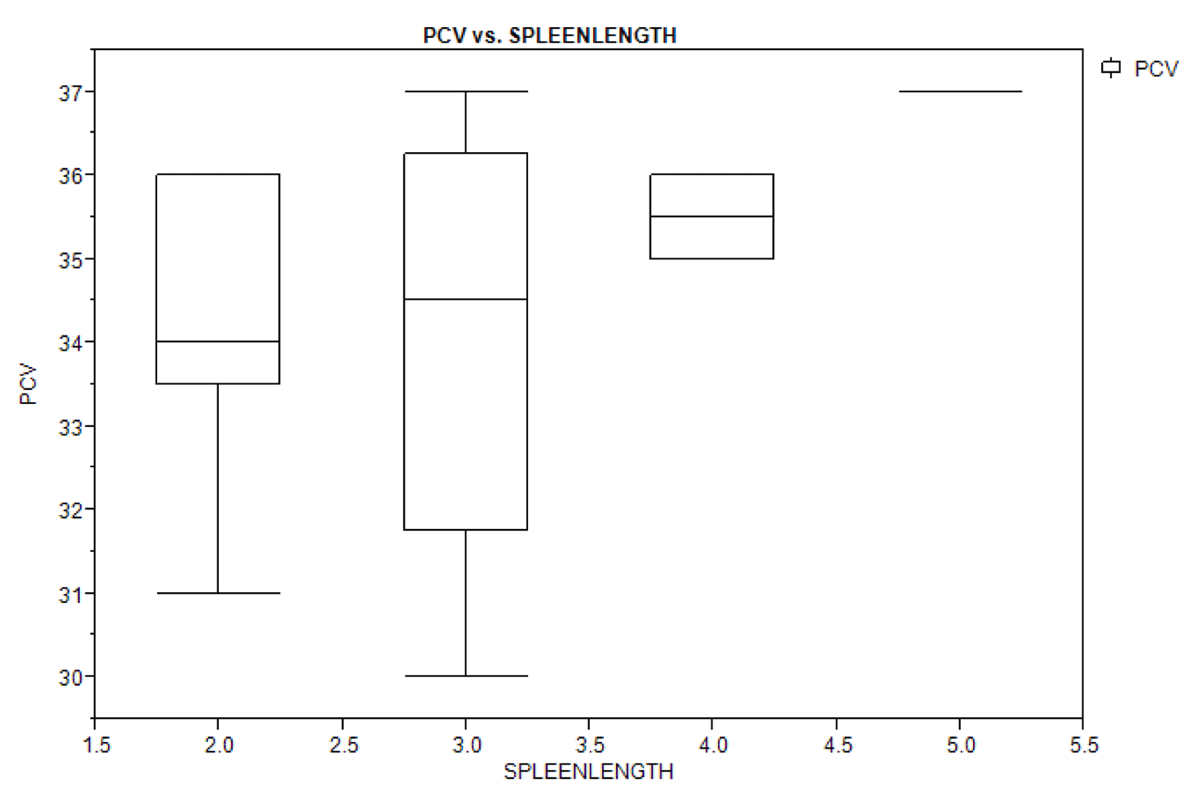
Figure 2A
Box plot showing the relationship between spleen length and packed cell volume of the study population.
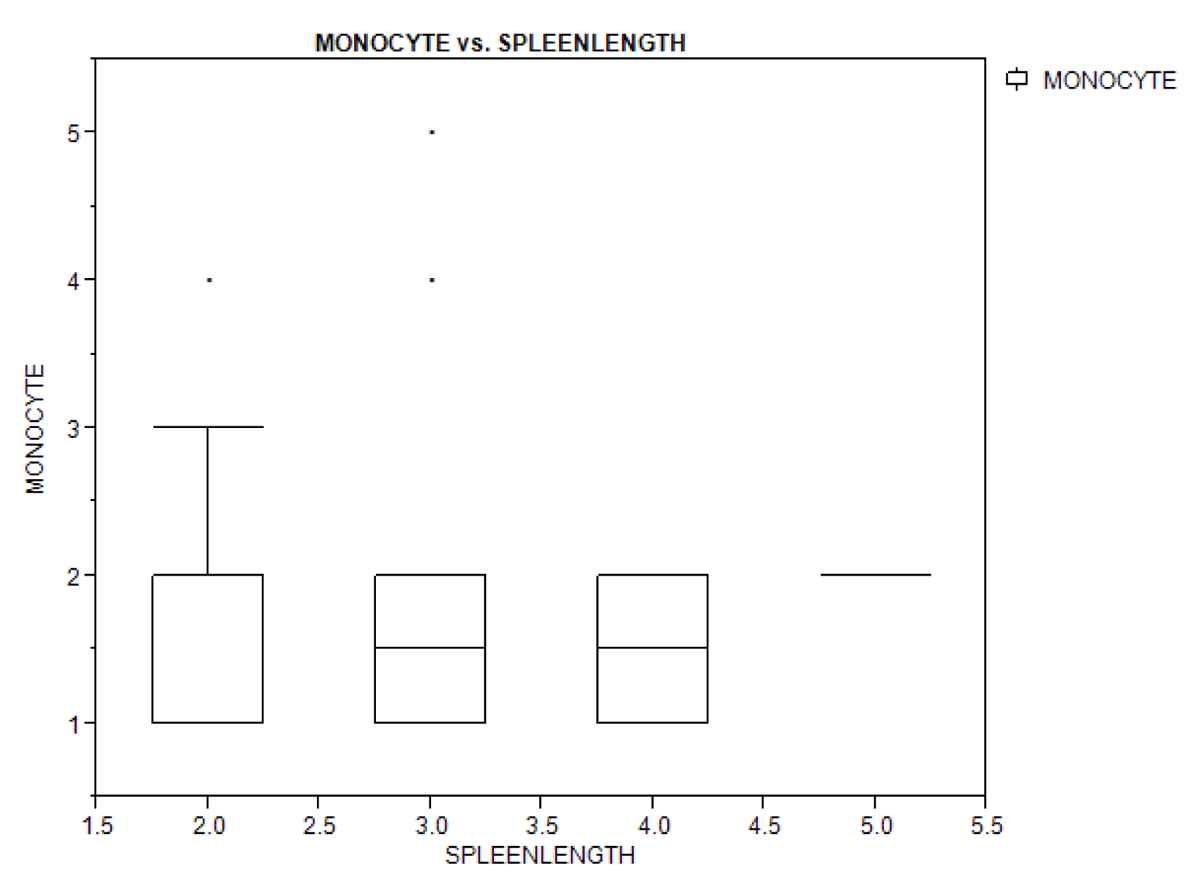
Figure 2B
Box plot showing the relationship between spleen length and monocyte count of the study population.
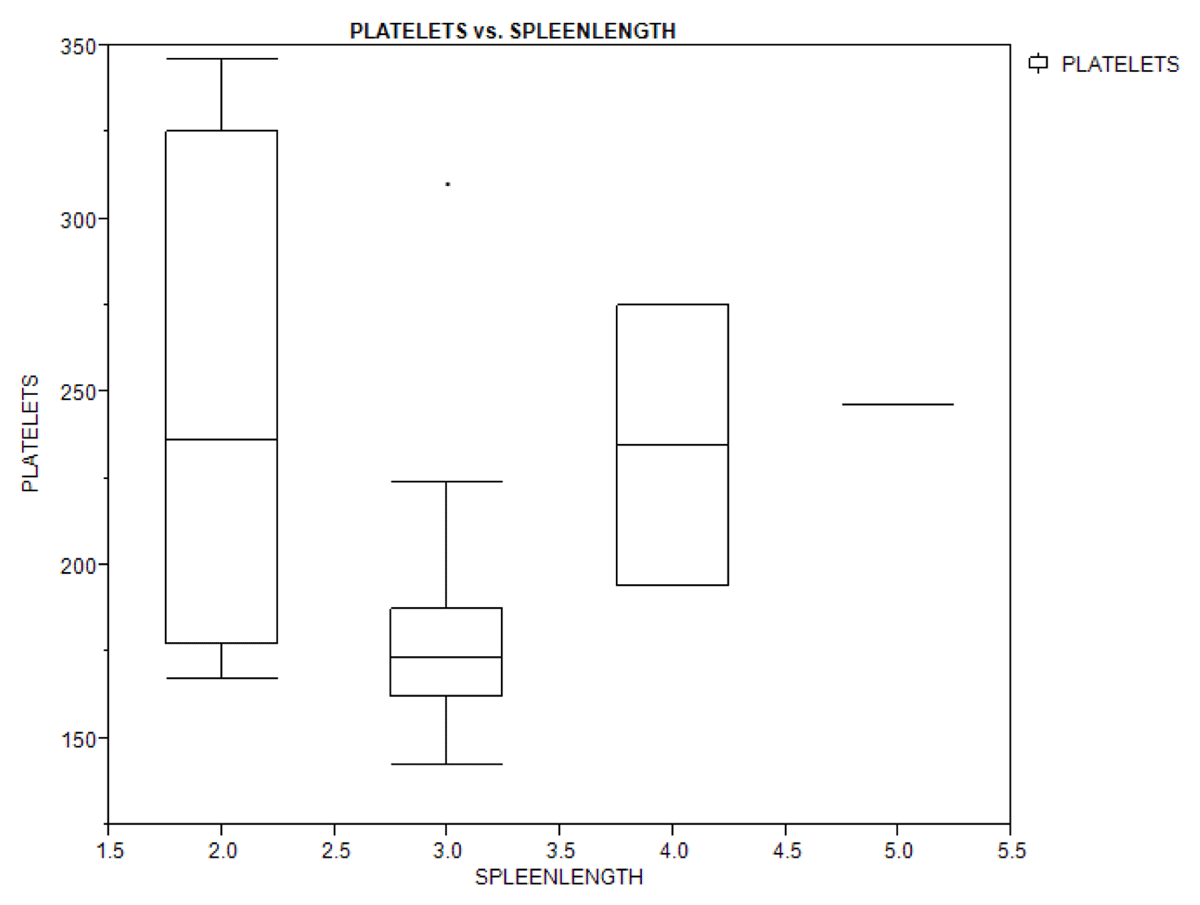
Figure 2C
Box plot showing the relationship between spleen length and platelets count of the study population.