
Table 1
Demographics of study participants.
| Characteristic | No. | % |
|---|---|---|
| Age groups | ||
| 25 to 40 | 145 | 39 |
| 40 to 50 | 86 | 23.1 |
| Above 50 | 134 | 36 |
| Sex | ||
| Male | 161 | 43.3 |
| Female | 181 | 48.7 |
| Education | ||
| University degree level | 206 | 56.6 |
| Below university degree level | 158 | 43.4 |
| Job related to health care | ||
| No | 301 | 83.6 |
| Yes | 59 | 16.4 |
| Currently employed | ||
| No | 123 | 33.1 |
| Yes | 244 | 65.6 |
| Monthly Income | ||
| Below middle income ($2000 or less) | 164 | 48.8 |
| Above middle income (more than $2000) | 71 | 21.1 |
| Prefer not to say | 101 | 30.1 |
| Insurance | ||
| No | 79 | 21.5 |
| Yes | 288 | 78.5 |
| Regular physician check-ups | ||
| No | 181 | 49.5 |
| Yes | 183 | 50.0 |
| I don’t know | 2 | 0.5 |
| Family or close friends had CRC history | ||
| No | 246 | 66.1 |
| Yes | 105 | 28.2 |
| I don’t know | 16 | 4.3 |
Table 2
Awareness of the risk factors of CRC as per the awareness module of the CAM questionnaire.
| Risk Factors | No. | % |
|---|---|---|
| Age | ||
| 20-year-old | 4 | 1.1 |
| 40-year-old | 55 | 15.1 |
| 60-year-old (correct answer) | 115 | 31.6 |
| Unrelated to age | 186 | 51.1 |
| I don’t know | 4 | 1.1 |
| Drinking alcohol | ||
| Yes | 191 | 52.8 |
| No | 73 | 20.2 |
| I don’t know | 98 | 27.1 |
| Not eating fruits and vegetables | ||
| Yes | 157 | 42.7 |
| No | 130 | 35.3 |
| I don’t know | 81 | 22.0 |
| Eating red meat | ||
| Yes | 237 | 64.4 |
| No | 67 | 18.2 |
| I don’t know | 64 | 17.4 |
| Low fiber diet | ||
| Yes | 208 | 56.7 |
| No | 72 | 19.6 |
| I don’t know | 87 | 23.7 |
| Having a family member with CRC | ||
| Yes | 195 | 53.6 |
| No | 103 | 28.3 |
| I don’t know | 66 | 18.1 |
| Being 70 years old | ||
| Yes | 155 | 42.5 |
| No | 101 | 27.7 |
| I don’t know | 109 | 29.9 |
| Absence of physical activity | ||
| Yes | 131 | 36.5 |
| No | 139 | 38.7 |
| I don’t know | 89 | 24.8 |
| Presence of bowel disease | ||
| Yes | 221 | 62.1 |
| No | 49 | 13.8 |
| I don’t know | 86 | 24.2 |
| Having diabetes | ||
| Yes | 94 | 26.0 |
| No | 150 | 41.6 |
| I don’t know | 117 | 32.4 |
| Smoking | ||
| Yes | 217 | 60.8 |
| No | 75 | 21.0 |
| I don’t know | 65 | 18.2 |
| Obesity | ||
| Yes | 213 | 58.0 |
| No | 66 | 18.0 |
| I don’t know | 88 | 24.0 |
Table 3
Awareness of warning signs of CRC as per the CAM questionnaire.
| Risk Factors | No | % |
|---|---|---|
| Anal bleed | ||
| Yes | 249 | 68.2 |
| No | 36 | 9.8 |
| I don’t know | 80 | 22 |
| Pain in abdomen | ||
| Yes | 225 | 61.6 |
| No | 68 | 18.6 |
| I don’t know | 72 | 19.7 |
| Change in bowel habits | ||
| Yes | 205 | 56.3 |
| No | 74 | 20.3 |
| I don’t know | 85 | 23.3 |
| Bowel not emptying | ||
| Yes | 151 | 42.1 |
| No | 94 | 26.2 |
| I don’t know | 114 | 31.7 |
| Blood in your stools | ||
| Yes | 237 | 65.3 |
| No | 54 | 14.9 |
| I don’t know | 72 | 19.8 |
| Pain in your back passage | ||
| Yes | 167 | 46 |
| No | 83 | 22.9 |
| I don’t know | 113 | 31.1 |
| Lump in anus | ||
| Yes | 212 | 58.6 |
| No | 58 | 16 |
| I don’t know | 92 | 25.4 |
| Anemia/fatigue | ||
| Yes | 143 | 39.3 |
| No | 104 | 28.6 |
| I don’t know | 117 | 32.1 |
| Unexplained weight loss | ||
| Yes | 216 | 59.2 |
| No | 54 | 14.8 |
| I don’t know | 95 | 26 |
Table 4
Multiple logistic regression showing adjusted associations between below factors and awareness of necessity of CRC screening.
| 95% Confidence Interval for Odds Ratio | ||||
|---|---|---|---|---|
| Factors | Odds Ratio | Lower Limit | Upper Limit | P-value |
| Sex (Reference male) | 1.607 | 0.934 | 2.765 | 0.087 |
| Family or close friends had CRC history | 1.454 | 0.938 | 2.253 | 0.095 |
| Risk Factors Awareness | 2.221 | 1.023 | 4.820 | 0.044 |
| Warning Signs Awareness | 1.196 | 0.670 | 2.134 | 0.545 |
| Age above 50 years | 2.376 | 1.362 | 4.147 | 0.002 |
| Level of Education | 0.777 | 0.454 | 1.332 | 0.359 |
| Smoking Status | 0.897 | 0.542 | 1.485 | 0.673 |
| Regular Physician Check-Ups | 3.167 | 1.884 | 5.323 | 0.000 |
| Employment Status | 1.640 | 0.885 | 3.041 | 0.116 |
| Job related to healthcare | 1.022 | 0.492 | 2.123 | 0.953 |
| Method of awareness about cancer (family doctor) | 2.384 | 1.209 | 4.700 | 0.012 |
| Method of awareness about cancer (TV) | 0.613 | 0.355 | 1.059 | 0.079 |
Table 5
Multiple logistic regression showing adjusted associations between below factors and undergoing past CRC screening.
| 95% Confidence Interval for Odds Ratio | ||||
|---|---|---|---|---|
| Factors | Odds Ratio | Lower Limit | Upper Limit | P-value |
| Lived in a different country | 1.147 | 0.467 | 2.818 | 0.765 |
| Sex (Reference male) | 0.570 | 0.229 | 1.416 | 0.226 |
| Marital Status | 0.727 | 0.232 | 2.276 | 0.584 |
| Job Related to Healthcare | 1.097 | 0.341 | 3.536 | 0.876 |
| Insurance or NSSF | 2.586 | 0.765 | 8.742 | 0.126 |
| Family or Close Friends Having CRC | 3.364 | 1.452 | 7.795 | 0.005 |
| Warning Sign Awareness | 2.565 | 1.050 | 6.266 | 0.039 |
| Risk Factor Awareness | 0.556 | 0.203 | 1.523 | 0.254 |
| Age above 50 years | 4.223 | 1.708 | 10.442 | 0.002 |
| Employment Status | 0.403 | 0.152 | 1.070 | 0.068 |
| Level of Education | 0.651 | 0.263 | 1.611 | 0.353 |
| Smoking Status | 0.880 | 0.376 | 2.062 | 0.769 |
| Regular Physician Check-Ups | 2.059 | 0.762 | 5.563 | 0.155 |

Figure 1
Previously screened participants’ reasons for choosing a) FOBT over Colonoscopy and b) Colonoscopy over FOBT.
Table 6
Multiple logistic regression showing adjusted associations between below factors and willingness to undergo CRC screening in the future among those who have never been previously screened.
| 95% Confidence Interval for Odds Ratio | ||||
|---|---|---|---|---|
| Factors | Odds Ratio | Lower Limit | Upper Limit | P-value |
| Sex (Reference male) | 0.960 | 0.548 | 1.682 | 0.886 |
| Marital Status | 1.329 | 0.693 | 2.548 | 0.393 |
| Job related to healthcare | 0.874 | 0.412 | 1.855 | 0.726 |
| Insurance or NSSF | 0.601 | 0.307 | 1.175 | 0.136 |
| Regular Physician Check-Ups | 2.477 | 1.430 | 4.291 | 0.001 |
| Employment status | 1.124 | 0.588 | 2.147 | 0.724 |
| Level of Education | 1.256 | 0.694 | 2.273 | 0.451 |
| Smoking Status | 0.827 | 0.482 | 1.419 | 0.490 |
| Risk Factor Awareness | 2.641 | 1.217 | 5.732 | 0.014 |
| Warning Sign Awareness | 0.889 | 0.472 | 1.676 | 0.717 |
| Age above 50 years | 0.891 | 0.484 | 1.639 | 0.710 |
| Knowing family/friends with CRC | 1.364 | 0.748 | 2.488 | 0.311 |
| Lived in a different country | 0.972 | 0.531 | 1.780 | 0.927 |
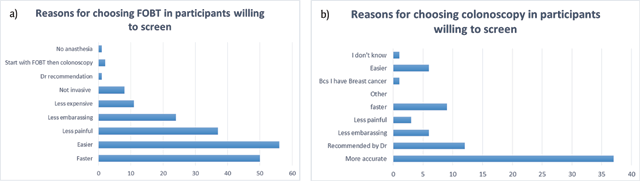
Figure 2
Reasons for choosing a) FOBT b) Colonoscopy among previously unscreened participants who are willing to undergo screening in the future.

Figure 3
Reasons for not choosing Colonoscopy among previously unscreened participants who are willing to undergo screening in the future.