
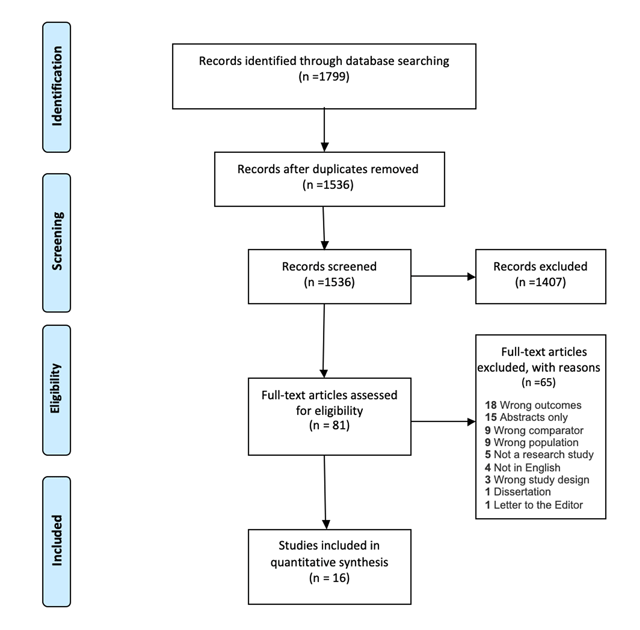
Figure 1
Prisma diagram for search strategy.
Table 1
Descriptive data of included studies.
| Author, Year | Country | Design | Population | Sample Size | Sampling Strategy | Response Rate (%) | Type of Occupational Health Exposure | Limitations (Per Authors) |
|---|---|---|---|---|---|---|---|---|
| Mathewos et al., 2013 | Ethiopia | Cross-sectional | Doctor, nurses, laboratory technician, health officer, Anesthetics, Midwives and Physiotherapists | 195 | Random | NR | Bloodborne pathogen and body fluid | NR |
| Aminde et al., 2015 | Cameroon | Cross-sectional | Nurses | 80 | Convenience | 94 | Bloodborne pathogen | Cross-sectional design, small sample size |
| Ogoina et al., 2014 | Nigeria | Cross-sectional predictive correlational | Nurses, physicians and laboratory scientist | 290 | Convenience | 76 | Bloodborne pathogen, Body fluid | Measurement Error, Recall Bias |
| Manyele et al., 2008 | Tanzania | Cross-sectional | Nurses, Physicians, medical attendants | 430 | Randomly selected | NR | Bloodborne pathogen, body fluid | NR |
| Ndejjo et al., 2015 | Uganda | Cross-sectional descriptive | Nurses, Physicians, Midwives, clinical officers | 200 | Random | NR | Bloodborne pathogen | Recall Bias, cross sectional study, one facility which limits generalizability |
| Kumakech et al., 2011 | Uganda | Cross-sectional descriptive | Nurses, Physicians, Midwives, Medical lab techs and students (nursing and medical) | 224 | Stratified systematic sampling | 58.3 | Bloodborne pathogen, Body fluid | Measurement Error, Recall Bias, Involvement of students |
| Aluko et al., 2016 | Nigeria | Cross-sectional | Nurses, Physicians, Nursing Assistants | 290 | Stratified sampling and simple random sampling | 93 | General | Cross sectional design, response bias, lack of generalizability |
| Engelbrecht et al., 2015 | South Africa | Cross-sectional descriptive | Nurses, Physicians, Nursing Assistants, Allied health professionals (Social workers, physiotherapists, radiographers and dieticians) | 513 | Purposive, stratified quota | 46 | Bloodborne pathogen, Body fluid | Selection Bias, non-probability sampling |
| Efetie et al., 2009 | Nigeria | Cross-sectional survey | Physicians | 72 | Convenience | 72 | Bloodborne pathogen | Selection Bias, small sample size |
| Phillips et al., 2007 | Cameroon, Ethiopia, Ghana, Kenya, Madagascar, Malawi, Mozambique, Nigeria, Rwanda, South Africa, Sudan Tanzania, Uganda, Zambia | Cross-sectional | Physicians (Surgeons) | 84 | Convenience | 76 | Bloodborne pathogen, Body fluid | NR |
| Bekele et al., 2014 | Ethiopia | Cross-sectional descriptive | Physicians (Surgeons) | 98 | Convenience | 75 | Bloodborne pathogens | Measurement Error, Recall Bias, Too small sample size |
| Nwankwo et al., 2011 | Nigeria | Cross-sectional | Physicians (trainee surgeons) | 184 | Convenience | 80 | Bloodborne pathogens | NR |
| De Silva et al., 2009 | South Africa | Cohort | Physicians, Surgical Assistants | 30 | Random | 41 | Bloodborne pathogen, body fluid | Small sample size |
| Karani et al., 2011 | South Africa | Cross-sectional | Physicians(Interns) | 53 | Convenience | 83 | Bloodborne pathogen, Body fluid | Too small sample size, Recall bias of participants. Limited to MDs only. |
| Ogendo et al., 2008 | Kenya | Cross-sectional | Surgeons and first assistants | 346 | Convenience | NR | Bloodborne pathogen | Selection Bias, Measurement Error |
[i] Note: NR = Not reported.
Table 2
Prevalence of needlestick injuries and muco-cutaneous exposures to blood and bloodborne pathogens experienced by healthcare workers in Sub-Saharan Africa.
| Author, Year | Primary Outcome | Primary outcome prevalence (%) | Independent Variable | Factors related to knowledge | Factors related to attitudes | Factors related to practices | Factors related to access |
|---|---|---|---|---|---|---|---|
| Aluko et al., 2016 | Knowledge, attitudes and practices on occupational exposures, risk and history of injury and prophylaxis | Perceived susceptibility to needle stick injuries 94.5%, body fluid contact 92.4% | None | 57.6% had high knowledge of occupational hazards, 42.6% low knowledge of occupational hazards, 58% acquired through professional training, 67% aware of job aids, 93% aware of PEP | 80% had positive attitudes towards occupational hazards and preventive safety practices; Reasons for non-compliance with safety equipment: 6% report waste of time, 1% report uncomfortable as | 96% report wearing gloves for routine clinical practice, 94% reporting safe sharps disposal, 52% always comply with standard safety precautions | 41% report lack of safety equipment as a reason for non-compliance with safety equipment |
| Aminde et al., 2015 | Knowledge of PEP for HIV | 68% lifetime HIV occupational exposure: 24% both needlestick and splash exposure, 63% needlestick only; 1-year incidence: 54% had 1 exposure, 32% had 2 to 3, 15% >4 exposures | Demographics, length of service, previous formal training, hospital policies and source of knowledge | 84% had heard about PEP, 99% correctly identified the appropriate first aid measure, 30% correctly stated expanded 3 drug regimen for PEP and only 25% knew correct duration for therapy; Reasons for no PEP: 9% unaware of need, 16% unaware of hospital PEP policy | 86% perceived they were at risk HIV acquisition, 18% did not receive PEP because believed no susceptibility to HIV | Recapping needles 37% | 2% PEP no available |
| Bekele et al., 2014 | Hepatitis B vaccination | 78% prevalence of needle stick injury, 23% received HBV vaccine | Demographics | 19% report not vaccinating due to not knowing vaccine available in Ethiopia | 94% believed Surgeons should get HBV vaccination, 49% report reason for not vaccination was “I didn’t give it much thought in the past”, 14% report not vaccinating because it was time consuming, 8% report not vaccinating because they believed it was not useful as a Surgeon | 24% HBV vaccination rate, of those 75% (18/24) received all doses; 39% double gloved during procedures, 57% inconsistent double gloving, 4% never double gloved | 14% report not vaccinating due to cost |
| De Silva et al., 2009 | Risk of blood splashes to the eyes during surgery | 45% of visors had blood splashes, of these 68% (15/22) had macroscopic splashes, 73% (16/22) had microscopic splashes | Major/minor surgery, emergency/elective surgery, surgeon/assistant, use of special equipment | NR | NR | No significant differences identified | NR |
| Efetie et al., 2009 | Prevalence of needlestick injuries | 90% lifetime needle stick injuries | Type of hospital, Physician rank | NR | NR | 16% from recapping; 51% recapped needles by hand, 56% indicating regular use of sharps containers; 9% took appropriate action after needlestick injury, 52% didn’t report needlestick injury, 9% (6/68) took ARV; 92% indicate double-gloving | 69% indicated presence of sharps disposal containers, 37% reported needlestick policy at work |
| Engelbrecht et al., 2015 | Health and safety practices, prevention of blood and air-borne diseases | 21% needlestick injury or exposure to body fluids (2 years) | Demographics, occupation, trust in management | Lack of training reported: 24% on use of PPE, 21% prevention of needlestick injuries | NR | 57% recap needles, 29% washed gloves, 20% didn’t wash hands between patients | Infection control hazards present in all three hospitals observed (i.e. no soap, sharps containers overflowing, N95 masks not available, etc.) |
| Karani et al., 2011 | Accidental exposure to blood or body fluids | 55% exposure to blood or body fluids (1 year), 72% (21/29) were percutaneous exposures, 24% (8/29) were mucosal exposures | None | NR | NR | 88% (23/26) compliance with PEP prophylaxis when HIV positive exposure. PEP discontinued due to intolerance of medication side effects | NR |
| Kumakech et al., 2011 | Occupational exposure to HIV (percutaneous injury and muco-cutaneous contamination) | 39% needlestick injury (1 year), 3% scalpel cut injuries (1 year), 58% muco-cutaneous exposure (1 year) | Demographics, predisposing factors to exposure | 32% poor clinical knowledge contributed to NSI | NR | 12% recapping needles; 10% being less careful; 2% improper sharps disposal; 47% reported exposure; 5% PEP initiated and completed | NR |
| Manyele et al., 2008 | Availability of information on occupational health and safety (OHS), availability of qualified OHS supervisors, quantify hazardous activities in the hospital, distribution of accidents in hospitals | Needle stick injuries 52.9%, blood splashes 21.7% (timeframe not reported) | None | 33% report seminars and workshops as highest source of information about OHS | NR | Hazardous activities identified included injection, cleaning, patient care, bedding, dressing of wounds, medication and operation. | Hospitals in Kagera, Lindi, and Mawenzi had accessibility of antiseptics to less than 30% of health service providers. |
| Mathewos et al., 2013 | Knowledge level of the HCWs about PEP for HIV | 33.8% exposed to HIV risky conditions (lifetime) | None | 63.1% had adequate knowledge about PEP for HIV, 48.7% received this in formal training, 60.5% reported that PEP is efficient and 50.7% knew when to initiate PEP | 98.5% agreed on the importance of PEP for HIV, 78.5% believed it can reduce probability of being infected | Of the exposed, 74.2% (49/66) took PEP; of those who took PEP, 79.5% (39/449) completed PEP | 88.2% reported availability of PEP guidelines in the hospital. |
| Ndejjo et al., 2015 | Biological and non-biological occupational hazards | 21.5% sharp-related injuries, 17% cuts and wounds, 10.5% direct contact with contaminated specimens/biohazards, 9% airborne diseases, 7.5% infectious diseases, 7.5% other bloodborne pathogen, vector-borne disease, and bioterrorism (time not reported) | Demographics, provider specialty, overtime work, type of facility, alcohol consumption and sleep | NR | 97.0% were screened for HIV | Biological hazards associated with not wearing necessary PPE (AOR = 2.34, p = 0.006), working overtime (AOR = 2.65, p = 0.007), and experiencing work related pressure (AOR = 8.54, p = 0.001); 79.5% washed their hands before and after every procedure; 68.5% washed after handling soiled materials; 46% washed when evidently dirty; 53.5% washed after using the toilet; 44.3% (35/79) of those exposed wore all necessary PPE | Availability of medical waste disposal (92.0%); safety tools and equipment (90.0%); PPE provided by hospital (53.5%) |
| Nwankwo et al., 2011 | Percutaneous injuries and accidental exposure to patient’s blood; knowledge of universal precautions and post-exposure prophylaxis | 68% accidental blood exposure (6 months); of those 64% (89/140) needlestick injuries, 24% (33/140) blood splashes and non-sharp, 10% (14/140) operating instrument injuries, 3% (4/140) from surgical blades | Demographics, surgical specialty, Physician rank | 42% adequate knowledge of universal precautions and PEP | NR | Post-exposure practices: 54% wash with water and clean with spirit, 6% cleaned with hypochlorite solution, 72% disregarded exposure, 1% took ART | NR |
| Ogendo et al., 2008 | Blood splashes on eyewear | 53.1% contamination rate protective eyewear, 5.2% of surgeons and 3.5% assistants utilized eye protection | Demographics, use of power tools | NR | Reasons for not wearing goggles: 33% uncomfortable, 26% unavailable, 17% misting, 2% using headlamp or prescription glasses, 2% forgot or unaware | Longer surgeries and use of power tools had more splashes | NR |
| Ogoina et al., 2014 | Needle stick injuries, cut by sharps, blood splashes and skin contact with blood | 84.4% had > = 1 exposure (1 year): 44.7% needlestick injury, 32.8% cuts by sharps, 33.9% blood splashes, and 75.8% skin contact with blood | Demographics | 48.6% had training in infection control | NR | NR | NR |
| Phillips et al., 2007 | Bloodborne pathogen exposure, body fluid exposure, access and use of protective equipment | 91% percutaneous injury in the last year, mean 3.1 exposures80% > = 1 blood and body fluid exposure in the last year, mean 4.2 exposures | None | NR | NR | 39% vaccinated against HBV; 40% used hands-free technique for passing sharps; 31% used blunt suture needles; 82% typically wear a gown during surgery, 35% reported wearing a gown during most recent exposure; 29% report wearing eye protection. | 89% had access to PEP |
[i] Note: NR = Not reported, NA = Not applicable, AOR = Adjusted odds ratio.