
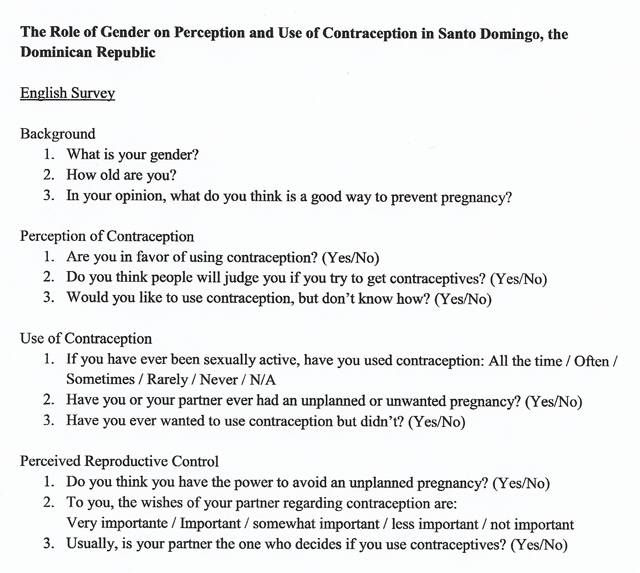
Figure 1
Quantitative cross-sectional survey administered in the Dominican Republic.
Table 1
Demographic information of survey participants.
| Characteristic | Overall | Male | Female |
|---|---|---|---|
| Gender N (%) | |||
| Male | 43 (30.1) | – | – |
| Female | 100 (69.9) | – | – |
| Age | |||
| Mean (SD) | 49.27 (16.09) | 53.49 (16.13) | 47.45 (15.8) |
| Median | 52.0 | 55 | 49.5 |
| Range | 18–86 | 18–86 | 18–78 |
| Age group N (%) | |||
| 18–24 | 12 (8.4) | 2 (4.7) | 10 (10) |
| 25–44 | 38 (26.6) | 9 (20.9) | 29 (29) |
| 45–64 | 66 (46.2) | 22 (51.2) | 44 (44) |
| 65+ | 27 (18.9) | 10 (23.3) | 17 (17) |
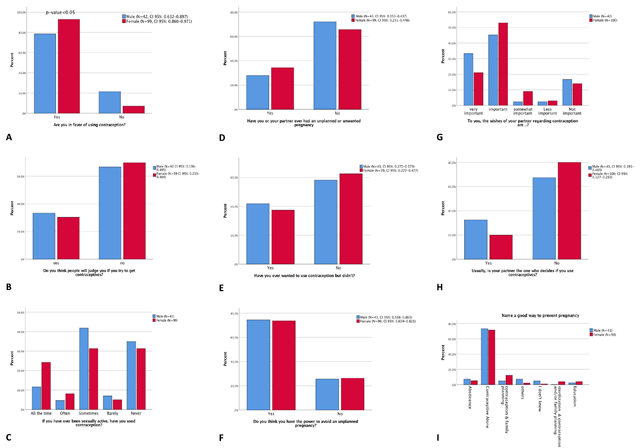
Figure 2
Survey responses breakdown by genders. (A)–(I) are bar charts survey responses showing in percent and grouped in genders. Cross tabulation with chi-Square analyses were performed on genders and each question to show association. The 95% confidence intervals of proportions who responded “yes” to dichotomous questions were reported for both genders.
Table 2
Correlation between responses to whether in favor of contraception use and responses to other questions from all participants.
| In favor of using contraception (N = 125) | Not in favor of using (N = 16) | p-value | |
|---|---|---|---|
| Name a good way to prevent pregnancy | <0.001 | ||
| Abstinence | 6 (4.9%) | 2 (13.3%) | |
| Contraceptive alone | 95 (77.9%) | 5 (33.3%) | |
| Contraception & family planning | 12 (9.8%) | 2 (13.3%) | |
| Others | 3 (2.5%) | 2 (13.3%) | |
| I don’t know | 0 (0.0%) | 2 (13.3%) | |
| Education | 2 (1.6%) | 2 (13.3%) | |
| Sterilization & contraception and/or family planning | 4 (3.3%) | 0 (0.0%) | |
| If you have ever been sexually active, have you used contraception? | 0.001 | ||
| Use All the Time | 29 (23.4%) | 0 (0.0%) | |
| Often | 8 (6.5%) | 2 (12.5%) | |
| Sometimes | 48 (38.7%) | 1 (6.3%) | |
| Rarely | 7 (5.6%) | 1 (6.3%) | |
| Never | 32 (25.8%) | 12 (75.0%) | |
| Do you think you have the power to avoid an unplanned pregnancy? | 0.003 | ||
| Yes | 98 (78.4%) | 7 (43.8%) | |
| No | 27 (21.6%) | 9 (56.3%) | |
| To you, the wishes of your partner regarding contraception are…? | 0.002 | ||
| Very Important | 32 (25.6%) | 3 (20.0%) | |
| Important | 68 (54.4%) | 3 (20.0%) | |
| Somewhat Important | 9 (7.2%) | 1 (6.7%) | |
| Less Important | 3 (2.4%) | 1 (6.7%) | |
| Not important | 13 (10.4%) | 7 (46.7%) | |
[i] Cross tabulation with Chi-Square analyses were performed between responses “Are you in favor of using contraception?” and responses to other questions given by all participants (N = 143).
Table 3
Age study on survey responses from female participants.
| Age group | p-value | ||||
|---|---|---|---|---|---|
| 18–24 (N = 10) | 25–44 (N = 29) | 45–64 (N = 44) | 65+ (N = 17) | ||
| Do you think people will judge you if you try to get contraceptives? | 0.015 | ||||
| Yes | 1 (10.0%) | 10 (34.5%) | 9 (20.9%) | 10 (58.8%) | |
| No | 9 (90.0%) | 19 (65.5%) | 34 (79.1%) | 7 (41.2%) | |
| Missing | 0 | 0 | 1 | 0 | |
| If you have ever been sexually active, have you used contraception? | 0.023 | ||||
| All the time | 4 (40.0%) | 7 (25.0%) | 8 (18.2%) | 5 (29.4%) | |
| Often | 0 (0.0%) | 5 (17.9%) | 2 (4.5%) | 1 (5.9%) | |
| Sometimes | 4 (40.0%) | 12 (42.9%) | 14 (31.8%) | 1 (5.9%) | |
| Rarely | 1 (10.0%) | 1 (3.6%) | 3 (6.8%) | 0 (0.0%) | |
| Never | 1 (10.0%) | 3 (10.7%) | 17 (38.6%) | 10 (58.8%) | |
| Missing | 0 | 1 | 0 | 0 | |
| Have you ever wanted to use contraception, but did not? | <0.001 | ||||
| Yes | 8 (80.0%) | 14 (50.0%) | 15 (34.1%) | 0 (0.0%) | |
| No | 2 (20.0%) | 14 (50.0%) | 29 (65.9%) | 17 (100.0%) | |
| Missing | 0 | 1 | 0 | 0 | |
| To you, the wishes of your partner regarding contraception are…? | 0.006 | ||||
| Very important | 1 (10.0%) | 4 (13.8%) | 11 (25.0%) | 5 (29.4%) | |
| Important | 4 (40.0%) | 21 (72.4%) | 23 (52.3%) | 5 (29.4%) | |
| Somewhat important | 4 (40.0%) | 2 (22.2%) | 3 (33.3%) | 0 (0.0%) | |
| Less Important | 0 (0.0%) | 0 (0.0%) | 2 (4.5%) | 1 (5.9%) | |
| Not important | 1 (10.0%) | 2 (6.9%) | 5 (11.4%) | 6 (35.3%) | |
| What do you think is a good way to prevent pregnancy? | 0.056 | ||||
| Abstinence | 0 (0.0%) | 0 (0.0%) | 3 (7.0%) | 2 (11.8%) | |
| Contraceptive alone | 6 (60.0%) | 25 (89.3%) | 31 (72.1%) | 8 (47.1%) | |
| Contraception & family planning | 3 (30.0%) | 3 (10.7%) | 4 (9.3%) | 2 (11.8%) | |
| Others | 1 (10.0%) | 0 (0.0%) | 1 (2.3%) | 0 (0.0%) | |
| I don’t know | 0 (0.0%) | 0 (0.0%) | 1 (2.3%) | 0 (0.0%) | |
| Sterilization and contraception and/or family planning | 0 (0.0%) | 0 (0.0%) | 1 (2.3%) | 3 (17.6%) | |
| Education | 0 (0.0%) | 0 (0.0%) | 2 (4.7%) | 2 (11.8%) | |
[i] Cross tabulation with Chi-Square analyses were performed between age groups and survey responses among female participants (N = 100).
Table 4
Correlation between responses to whether in favor of contraception and responses to other questions among male participants.
| Favor Contraception (N = 33) | Not Favor Contraception (N = 9) | p-value | |
|---|---|---|---|
| Usually, is your partner the one who decides if you use contraceptives? | 0.017 | ||
| Yes | 14 (42.4%) | 0 (0.0%) | |
| No | 19 (57.6%) | 9 (100.0%) | |
| To you, the wishes of your partner regarding contraception are…? | 0.004 | ||
| Very important | 12 (36.4%) | 2 (25.0%) | |
| Important | 18 (54.5%) | 1 (12.5%) | |
| Somewhat important | 0 (0.0%) | 1 (12.5%) | |
| Less important | 1 (3.0%) | 0 (0.0%) | |
| Not important | 2 (6.1%) | 4 (50.0%) | |
| If you have ever been sexually active, have you used contraception? | 0.001 | ||
| All the time | 5 (15.2%) | 0 (0.0%) | |
| Often | 2 (6.1%) | 0 (0.0%) | |
| Sometimes | 18 (54.5%) | 0 (0.0%) | |
| Rarely | 2 (6.1%) | 3 (7.1%) | |
| Never | 6 (18.2%) | 14 (33.3%) | |
[i] Cross tabulation with Chi-Square analyses were performed between responses to “Are you in favor of using contraception?” and responses to all other questions given by male participants (N = 43).