
Table 1
Demographic data of quantitative community member interviewees.
| Characteristics | Frequency (n = 82) | Percentage (%) |
|---|---|---|
| Sex | ||
| Male | 42 | 51.85 |
| Female | 40 | 49.38 |
| Education | ||
| Primary | 14 | 17.07 |
| Secondary | 40 | 48.78 |
| Tertiary | 28 | 34.15 |
| Age | ||
| Median (IQR) | 28.5 (21–41.75) | – |
| Relationship Status | ||
| Single | 32 | 39.02 |
| Married | 45 | 54.88 |
| Other (religious worker, divorced) | 5 | 6.10 |
| Occupation | ||
| Secondary school student | 17 | 20.73 |
| Tertiary school student | 7 | 8.54 |
| Farmer | 16 | 19.51 |
| Small business owner | 10 | 12.20 |
| Private employee | 20 | 24.39 |
| Government employee | 8 | 9.76 |
| Religious worker | 4 | 4.88 |
| Religion | ||
| Non-Catholic Christian | 42 | 51.22 |
| Catholic | 32 | 39.02 |
| Islamic | 3 | 3.66 |
| Other | 5 | 6.10 |
[i] IQR: interquartile range.
Table 2
Knowledge of community members regarding basic blood donation requirements.
| Type of Question | Question | Correct (%) | Wrong (%) |
|---|---|---|---|
| Multiple Choice | |||
| What is the minimum age eligible for blood donation? | 4.88 | 95.12 | |
| What is the minimum weight eligible for blood donation? | 36.59 | 63.41 | |
| How often can a person donate blood? | 69.51 | 30.49 | |
| Is there a best blood type for donors? What is it? | 54.22 | 45.78 | |
| What is the maximum volume of blood that one person can donate at one time? | 18.29 | 81.71 | |
| Yes/No | |||
| Can pregnant women donate blood? | 96.34 | 3.66 | |
| Can women who are menstruating donate blood? | 84.15 | 15.85 | |
| Can breastfeeding mothers donate blood? | 85.37 | 14.63 | |
| Can people with diabetes donate blood? | 90.24 | 9.76 | |
| Can people who smoke donate blood? | 32.93 | 67.07 | |
Table 3
Demographic characteristics associated with knowledge regarding blood donation.
| Characteristic | Pass (%) | Fail (%) | p-value |
|---|---|---|---|
| Sex | |||
| Male | 71.43 | 28.57 | 0.788 |
| Female | 68.89 | 31.11 | |
| Education | |||
| Primary, Secondary | 63.08 | 36.92 | 0.024* |
| Tertiary | 86.21 | 13.79 | |
| Age | |||
| Median | 30.5 | 24.00 | 0.114 |
| Relationship Status | |||
| Single | 59.46 | 40.54 | 0.106 |
| Married, Divorced | 75.47 | 24.53 | |
| Occupation | |||
| Student | 54.17 | 45.83 | 0.046* |
| Farmer | 66.67 | 33.33 | 0.717 |
| Small business owner | 78.95 | 21.05 | 0.351 |
| Private employee | 66.67 | 33.33 | 0.687 |
| Government employee | 100 | 0.00 | 0.052 |
| Religious worker | 100 | 0.00 | 0.183 |
[i] P-values < 0.05 (*) were considered statistically significant.
Table 4
Demographic features of qualitative subjects.
| Characteristic | Community Members (n = 24) | Health Professionals (n = 20) |
|---|---|---|
| Age (median) | 17–66 (31) | 23–47 (30.5) |
| Sex | ||
| Male | 11 | 5 |
| Female | 13 | 15 |
| Profession (n) | Farmer (6) | Nurse (2) |
| Secondary School Student (5) | Intern Doctor (14) | |
| Tertiary School Student (4) | Attending Physician (4) | |
| Small Business Owner (4) | ||
| Business Employee (4) | ||
| Religious Worker (1) | ||
| Experience | – | <1–22 years* |
[i] * Intern doctors all had experience of <1 year, while the other health professionals ranged from 3–22 years.
Table 5
Key themes elicited from community member qualitative interviews.
| Category | Theme | Excerpt |
|---|---|---|
| Attitudes towards Blood Donation | Positive Attitude | “… blood donation is very good for people’s health, like in the main hospital, we can use [it] for those ones who don’t have blood… it increases the lifespan of someone.” [14] |
| Motivations of Blood Donation | Altruism, Obtain Blood in the Future | “…do this [donate blood] in order to save someone’s life. Like tomorrow, you donate and maybe your mother will fall sick. You will show your card you used for donating blood and your mother will be given some blood.” [34] |
| Deterrents towards Blood Donation | Lack of Food Security, Sickness | “No food because us students do [not have] cash. So the small [money] we have, we have to use it for other things. So someone who has donated blood has to eat a lot of greens, fruits…sometimes you can’t get.” [34] |
| Blood Donation Safety | Safe Blood Donation Procedures | “I don’t think I can get any diseases in the blood donation process because every person who goes to donate blood, they get a new needle to get their blood, unless maybe the person who is doing the blood donation process has an intention of infecting… But the process of blood donation is clean and safe because everyone gets a new needle and once they are done donating, it is disposed…” [46] |
| Low Community Donation Rates | Lack of Information and Community Outreach Programs | “Yes, given an opportunity…one can go and donate, but going to the hospital is what is hard. If they could bring those outreaches, maybe to the market, communities…” [37] |
[i] The specific participant’s study identification number is represented in brackets.
Table 6
Key themes elicited from health professional qualitative interviews.
| Category | Theme | Excerpt |
|---|---|---|
| Transfusion Transmissible Infections | Prolonged Screening | “…we had numbers of patients, most of them with [hemoglobin] below 5, and they needed blood, but there was no blood in the hospital. Most of the blood was not screened, and the screening system from Mbale already failed and we were now sending our samples to Nakesero Kampala. We even lost some patients…” [8] |
| Indications for Transfusion | Clinical Features: Pallor, Acute Bleeding | “Most times we just do it clinically because most of the patients we receive them late in the night…if we see a patient is really paper white…we just take off a sample of blood to do our investigations the next day, but then we go ahead and transfuse these patients.” [11] |
| Clinical History: Sickle Cell Disease | “So history you will be able to know if this patient is a known sickler…if it is a sickler, history of already known sickler, the chances of transfusing this patient are already increased.” [6] | |
| Prioritizing Patient Populations | Highest Priority: Children, Pregnant Mothers; Lowest Priority: Elderly, Patients with Terminal Illnesses | “…occasionally [I] look at who is likely to benefit the blood transfusion more …[you] have a woman who is severely pale with severe malignancy. Then you have a baby who is severely pale from malaria. Benefits. I give blood here to this baby, she is likely to benefit from it. Someone who has a malignant process… probably their prognosis is poor…” [12] |
| Absence of Blood Units Available for Transfusion | Referral to Larger Hospital | “…we contact the head of the blood bank in Soroti, ask them how soon do we hope to get blood [from Mbale]. If it is not within that day, then we shall request the mother to look for funds and take the child to Mbale where they can do the transfusion.” [4] |
[i] The specific participant’s study identification number is represented in brackets.
Table 7
Characteristics of patients receiving blood transfusions.
| Characteristic | Number of Blood Transfusions | Percentage (%) |
|---|---|---|
| Sex | ||
| Female | 208 | 55.76 |
| Male | 165 | 44.24 |
| Age (years) | ||
| ≤5 | 124 | 33.24 |
| 6–10 | 77 | 20.64 |
| 11–20 | 53 | 14.21 |
| 21–30 | 48 | 12.87 |
| 31–50 | 46 | 12.33 |
| ≥51 | 25 | 6.70 |
| Blood Group | ||
| A | 112 | 30.03 |
| B | 82 | 21.98 |
| AB | 20 | 5.36 |
| O | 159 | 42.63 |
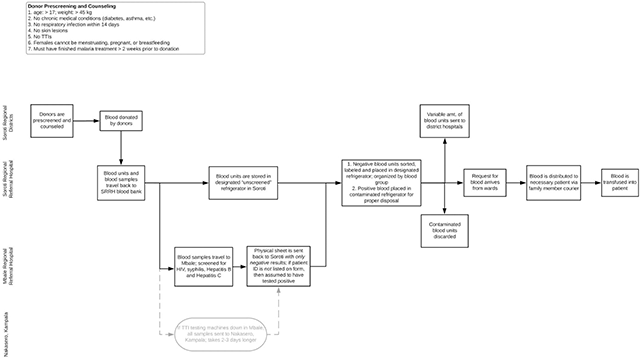
Figure 1
Process map of a unit of blood from donation to transfusion.