
Table 1
Age and sex distribution of study participants from the textile industry.
| Age (years) | Sex | Total | Chi-square, p-value | |
|---|---|---|---|---|
| Male | Female | |||
| Frequency(%) | Frequency(%) | n (%) | ||
| 22 to 35 | 61 (53.5) | 53 (46.5) | 114 (43) | |
| 36 to 49 | 30 (47.6) | 33 (52.4) | 63 (23.8) | 20.1, <0.001 |
| >49 | 70 (79.5) | 18 (20.5) | 88 (33.2) | |
| Total | 161 (60.8) | 104 (39.2) | 265 (100) | |
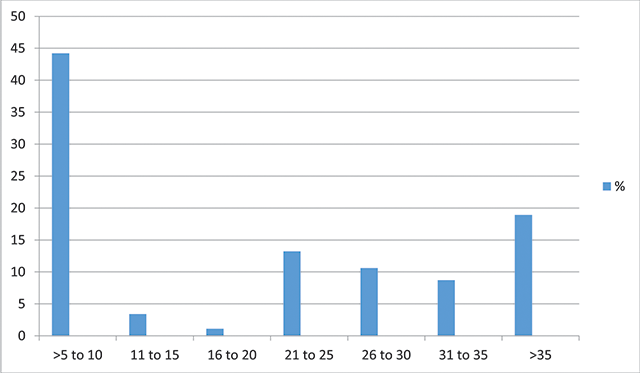
Figure 1
Work experience of the study participants.
Table 2
Distribution of textile industry workers.
| Department (sound intensity in dB) | Frequency(n) | Percent (%) |
|---|---|---|
| Drawing frame (77) | 23 | 8.7 |
| Finishing (81–85) | 16 | 6 |
| Loom shade (95–100) | 213 | 80.3 |
| Preparation (85–87) | 11 | 4 |
| Sizing (85–87) | 2 | 1 |
| Total | 265 | 100 |
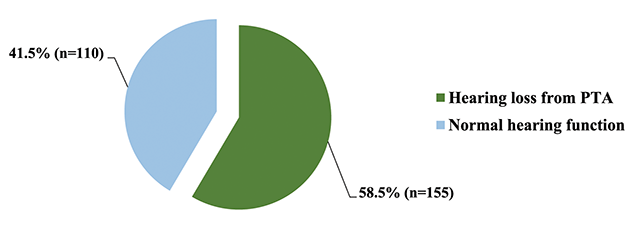
Figure 2
The prevalence of NIHL among textile industry workers.
Table 3
The prevalence of NIHL among textile industry workers by age and sex.
| Specific variable | Have hearing loss | Normal hearing | X2, p-value |
|---|---|---|---|
| Age (years) | |||
| 22 to 35 | 46 (40.4) | 68 (59.6) | |
| 36 to 49 | 41 (65.1) | 22 (34.9) | |
| More than 49 | 68 (77.3) | 20 (22.7) | 29.3, <0.001 |
| Sex | |||
| Male | 101 (62.7) | 60 (37.3) | |
| Female | 54 (51.9) | 50 (48.1) | 3.04, 0.081 |
| Total | 155 (58.5) | 110 (41.5) |
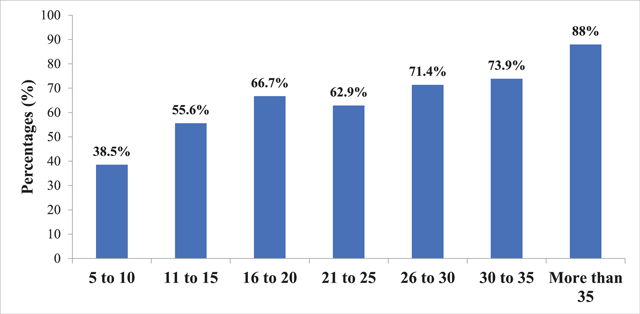
Figure 3
The prevalence of NIHL among textile industry workers by duration of exposure to excessive noise.
Table 4
Frequency distribution table showing lateralization of hearing loss, notch presence, side of notch, and frequency at which notch is present.
| Item | Frequency (n) | Percent (%) |
|---|---|---|
| Side of hearing loss | ||
| Left | 26 | 16.7 |
| Right | 22 | 14.2 |
| Both | 107 | 69.1 |
| Presence of notch | ||
| Yes | 90 | 58.1 |
| No | 65 | 41.9 |
| Side of notch | ||
| Right | 21 | 23.3 |
| Left | 29 | 32.3 |
| Both | 40 | 44.4 |
| Frequency at which notch present | ||
| 3000Hz | 9 | 10 |
| 4000Hz | 43 | 47.7 |
| 6000Hz | 38 | 42.3 |
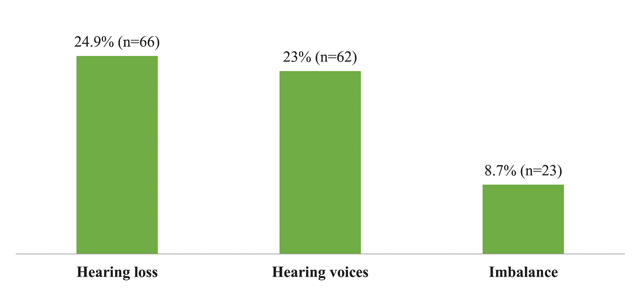
Figure 4
Common symptoms reported by textile industry workers.