
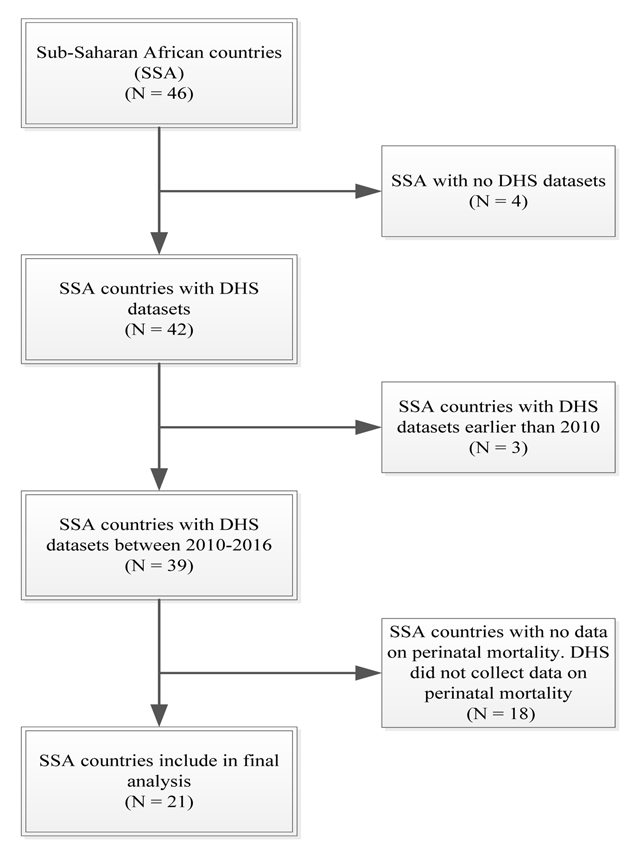
Figure 1
Flow chart for country selection.
Table 1
Countries of the different sub-regions in SSA and their mortality indicators.
| Country | Year of DHS | Number of stillbirths | Number of early neonatal deaths | Number of pregnancies of 7+ months’ |
|---|---|---|---|---|
| Eastern Africa | ||||
| Burundi | 2016 | 313 | 215 | 13835 |
| Ethiopia | 2016 | 130 | 236 | 11071 |
| Kenya | 2014 | 126 | 146 | 9484 |
| Malawi | 2015 | 236 | 378 | 17485 |
| Mozambique | 2011 | 127 | 320 | 11831 |
| Rwanda | 2014 | 125 | 114 | 8129 |
| Uganda | 2016 | 251 | 330 | 15437 |
| Tanzania | 2015 | 187 | 214 | 10163 |
| Zambia | 2013 | 180 | 247 | 13563 |
| Zimbabwe | 2015 | 77 | 140 | 6437 |
| Western Africa | ||||
| Gambia | 2013 | 89 | 151 | 7995 |
| Ghana | 2014 | 81 | 140 | 5776 |
| Liberia | 2013 | 70 | 129 | 6572 |
| Niger | 2012 | 225 | 229 | 13571 |
| Nigeria | 2013 | 396 | 925 | 32224 |
| Senegal | 2016 | 133 | 102 | 6206 |
| Sierra Leone | 2013 | 100 | 377 | 12298 |
| Southern Africa | ||||
| Lesotho | 2014 | 74 | 84 | 3184 |
| Namibia | 2013 | 39 | 77 | 4843 |
| Central Africa | ||||
| Angola | 2015 | 104 | 292 | 13380 |
| Equatorial Guinea | 2011 | 22 | 79 | 2709 |
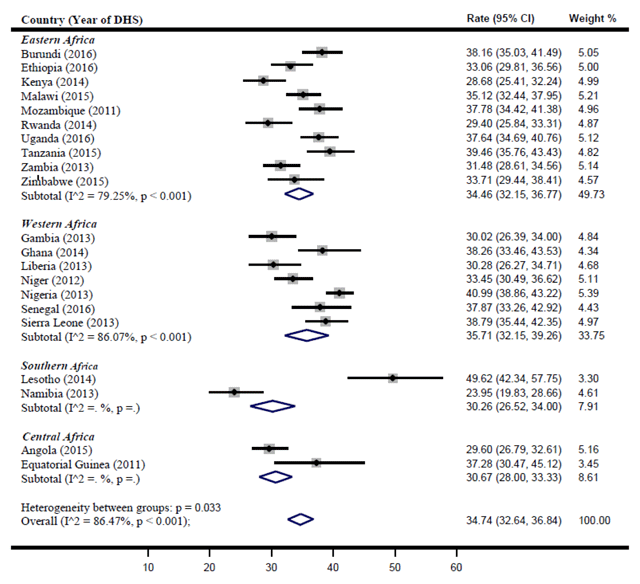
Figure 2
Perinatal mortality rate per 1000 births in the 4 sub-regions of SSA.