
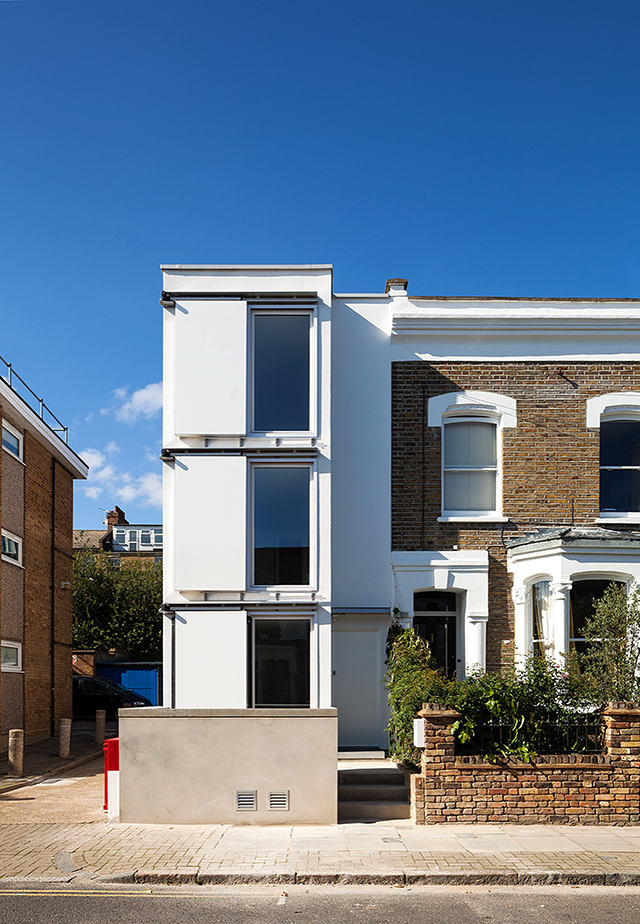
Figure 1
Exterior photograph of the Active House at 70a Corbyn Street, London N4, UK [Photograph: Andy Stagg].
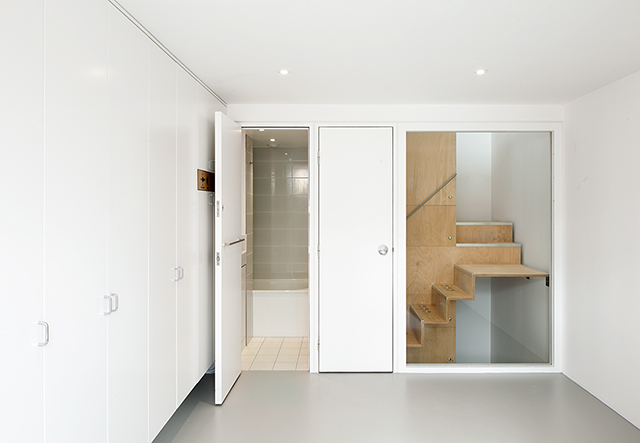
Figure 2
Interior view of the Active House [Photograph: Andy Stagg].
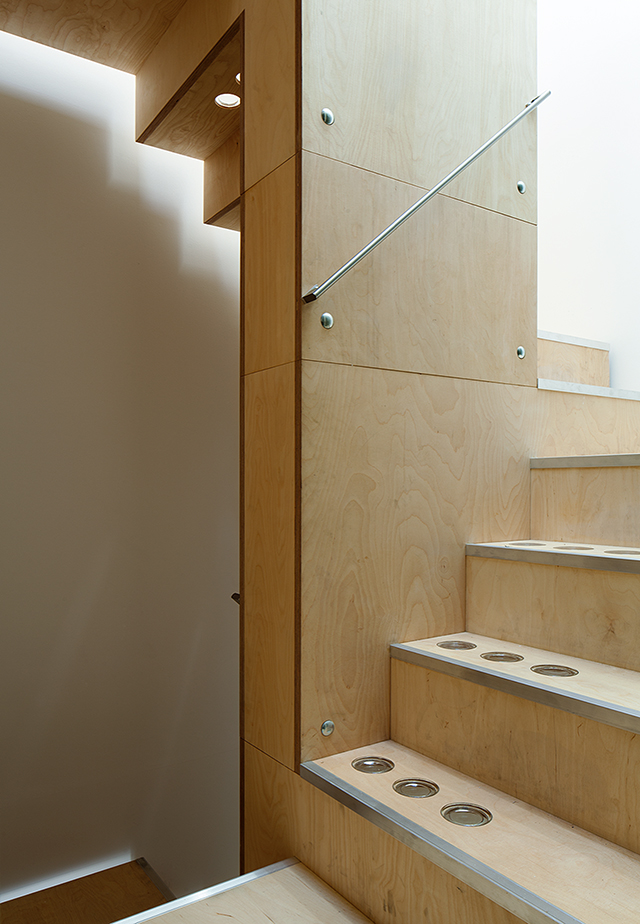
Figure 3
Staircase [Photograph: Andy Stagg].
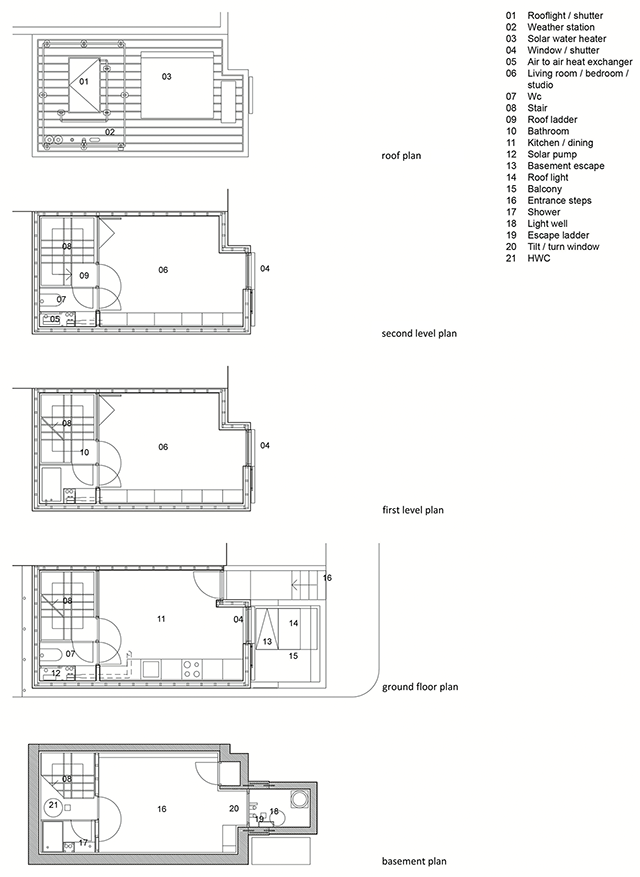
Figure 4
Floor plans [Image: Stephen Gage].
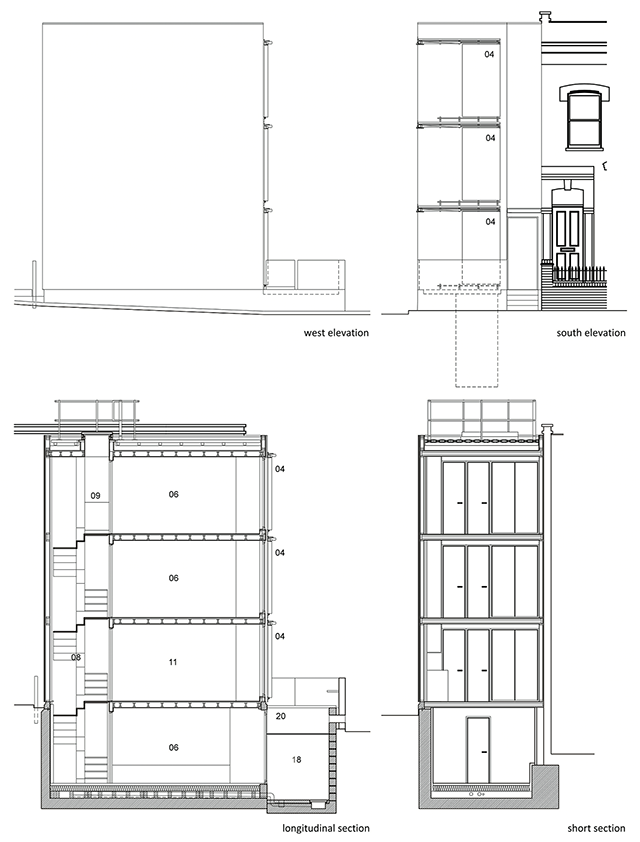
Figure 5
Sections and elevations [Image: Stephen Gage].
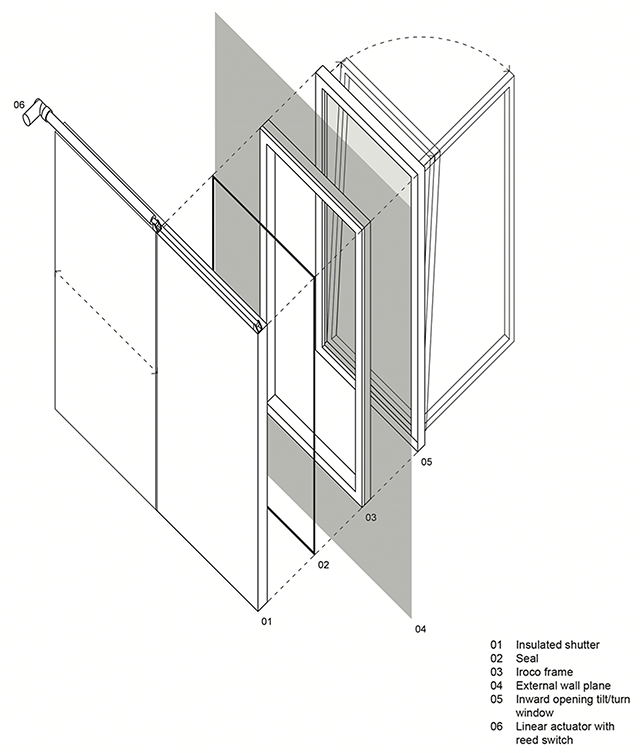
Figure 6
Window and shutter detail [Image: Stephen Gage].
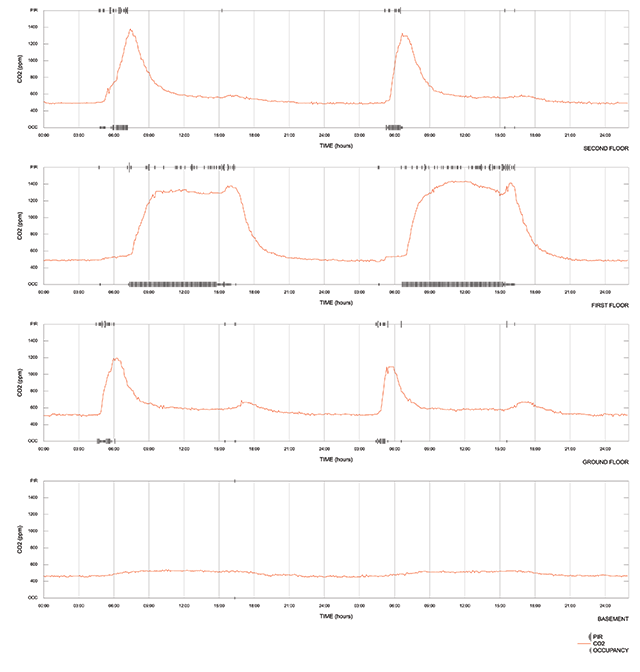
Figure 7
Doors closed, windows closed [Tables: Stephen Gage].
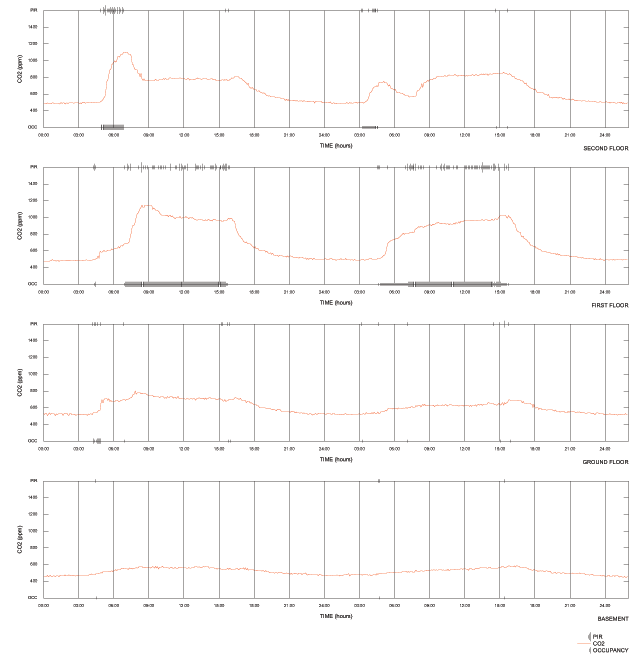
Figure 8
Doors open, windows closed [Tables: Stephen Gage].
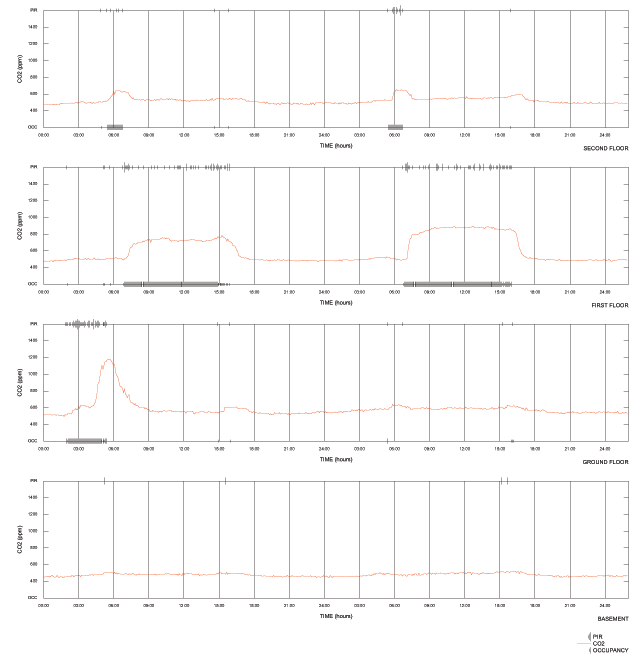
Figure 9
Doors closed, windows open [Tables: Stephen Gage].
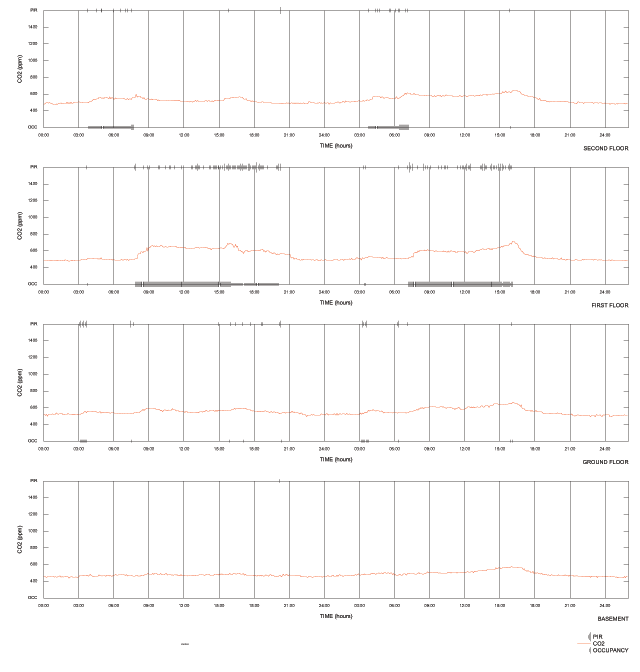
Figure 10
Doors open, windows open [Tables: Stephen Gage].
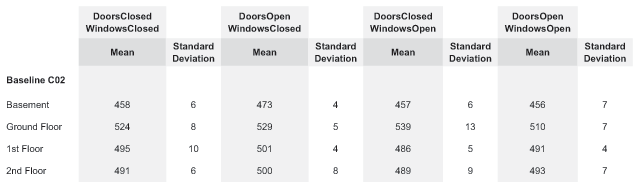
Figure 11
Unoccupied room CO2 level analysis [Table: Stephen Gage].
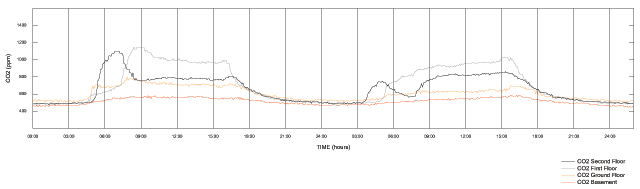
Figure 12
Doors open, windows closed; all levels CO2 overlaid [Table: Stephen Gage].
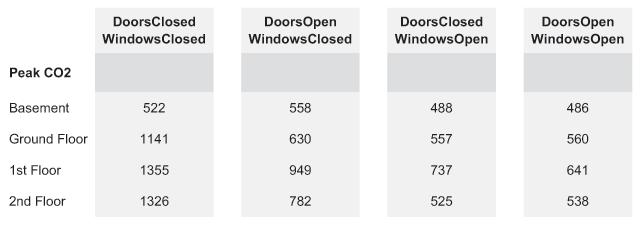
Figure 13
Mean CO2 levels when rooms are occupied [Table: Stephen Gage].
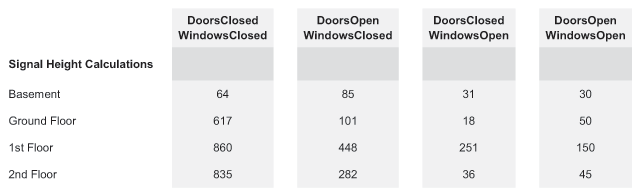
Figure 14
Mean CO2 signal heights [Table: Stephen Gage].
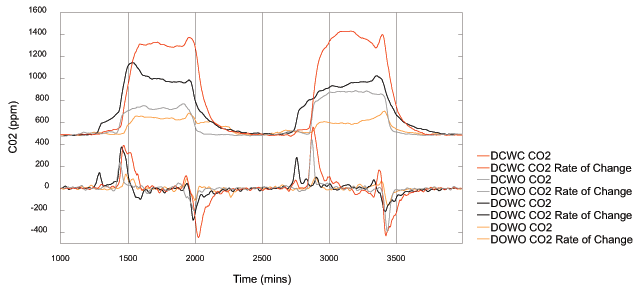
Figure 15
First-floor room smoothed CO2 level and gradient function [Table: Stephen Gage].
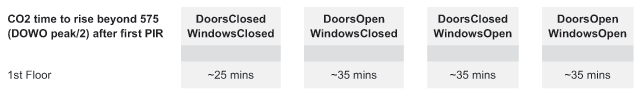
Figure 16
Time to confirm occupancy after first PIR ‘hit’ in the first-floor room [Table: Stephen Gage].
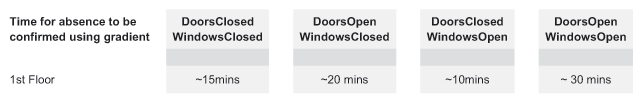
Figure 17
Time for absence to be confirmed using gradient [Table: Stephen Gage].