
Figure 1
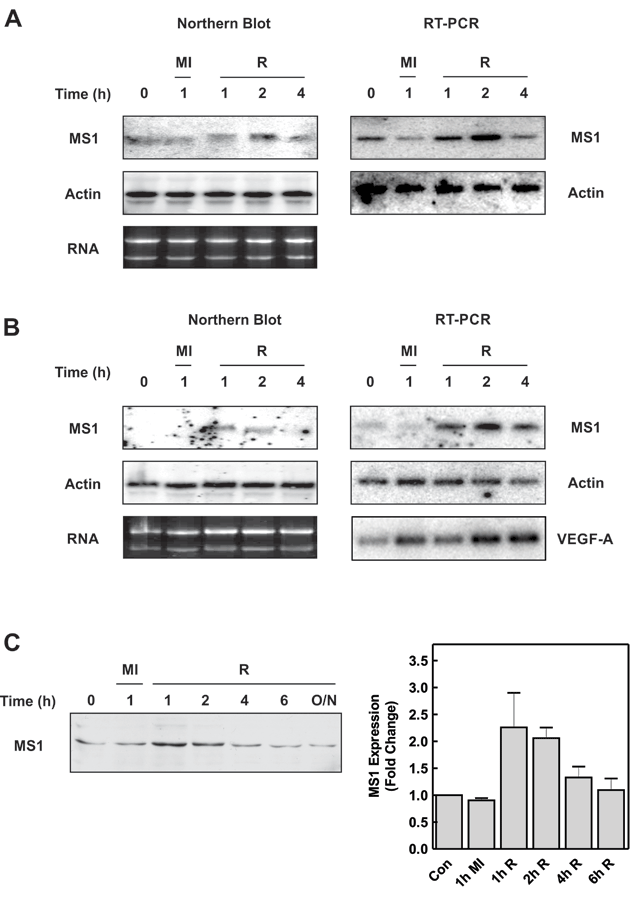
MS1 expression is increased during metabolic stress in cardiac myocytes. Neonatal cardiac myocytes (A) or H9c2 cells (B) were subjected to metabolic inhibition (MI) or allowed to recover (R) following 1h of metabolic inhibition for the times indicated. Northern blots for MS1 and β-Actin mRNA are presented on the left-hand side with MS1, VEGF-A and β-Actin mRNA determined by RT-PCR on the right. Ethidium bromide-stained gels showing 28S and 18S RNA levels are also shown. (C) Cell extracts from H9c2 cells subjected to metabolic inhibition (MI) and recovery (R) were blotted with antibodies to MS1. A representative blot and a graph indicating quantification of the data are shown (mean ± SEM [n = 3]).
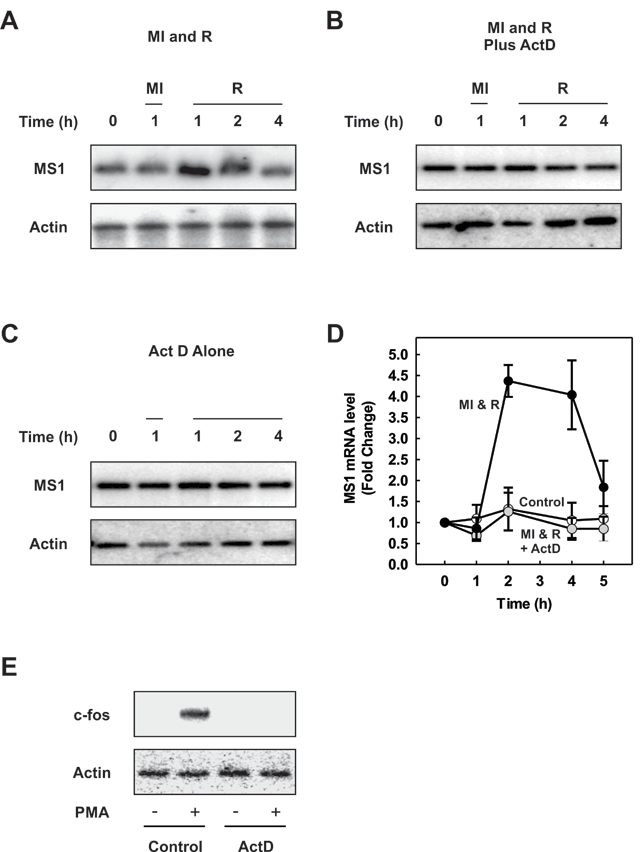
Figure 2
Increased levels of MS1 are due to transcription. (A) H9c2 cells were subjected to metabolic inhibition (MI) or allowed to recover (R) following 1h of metabolic inhibition for the times indicated. (B) H9c2 cells were preincubated with 5 µg/ml actinomycin-D for 1h then subjected to metabolic inhibition (MI) and recovery (R) in the continued presence of actinomycin-D, for the times indicated. (C) H9c2 cells were incubated in actinomycin-D for the times as indicated. MS1 and β-actin mRNA levels were determined by RT-PCR. (D) MS1 mRNA levels normalised to β-actin are presented graphically (mean ± SEM [n = 3]). (E) H9c2 cells were preincubated with or without 5 µg/ml actinomycin-D for 1h prior to treatment with 1 µM PMA for 30 minutes as indicated. Total RNA was isolated and c-fos and β-actin gene expression determined by RT-PCR.
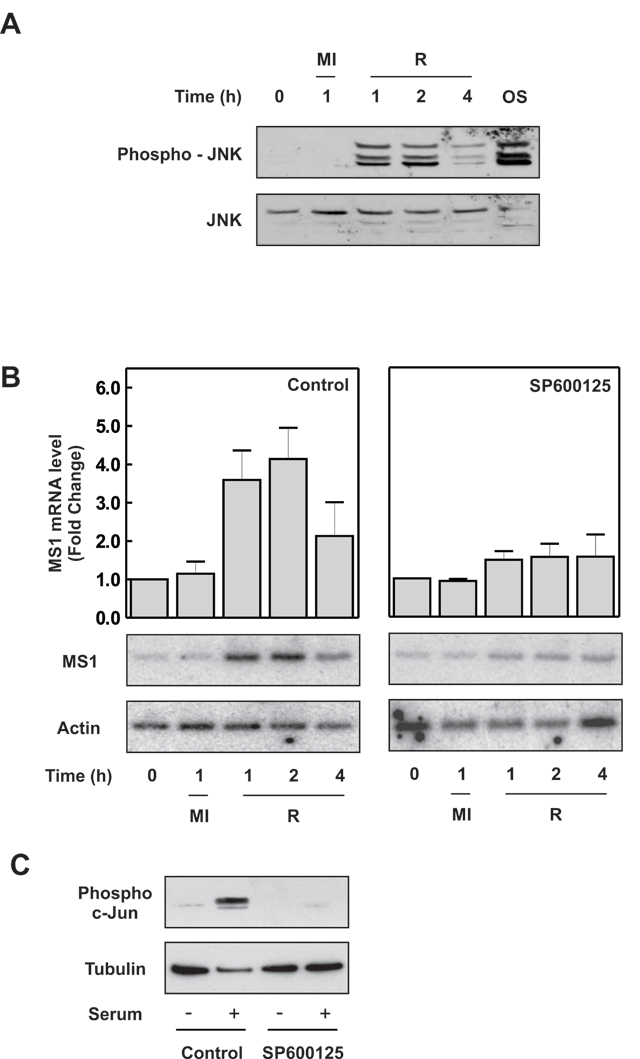
Figure 3
JNK activation is required for increased MS1 transcription during metabolic stress. (A) H9c2 cells were subjected to metabolic inhibition (MI) or allowed to recover (R) following 1h of metabolic inhibition for the times indicated. As a positive control, JNK was activated via osmotic shock, by exposure of the cells to 0.5 M sorbitol for 30 minutes (OS). Cell extracts were separated by SDS-PAGE and subjected to western blotting with antibodies reactive to phosphorylated (active) and total JNK as indicated. (B) H9c2 cells were preincubated without or with 25 µM SP600125, for 1 h and then subjected to metabolic inhibition (MI) or allowed to recover (R) following 1h of metabolic inhibition in the continued presence of the JNK inhibitor. MS1 and β-actin mRNA levels were determined by RT-PCR and MS1 normalised against β-actin. Results are the mean ± SEM (n = 3). (C) In control experiments, serum-starved H9c2 cells were preincubated with 25 µM SP600125 for 1 h prior to incubation with 10% serum, to activate JNK. Cell lysates were then blotted for phospho-c-Jun and tubulin.
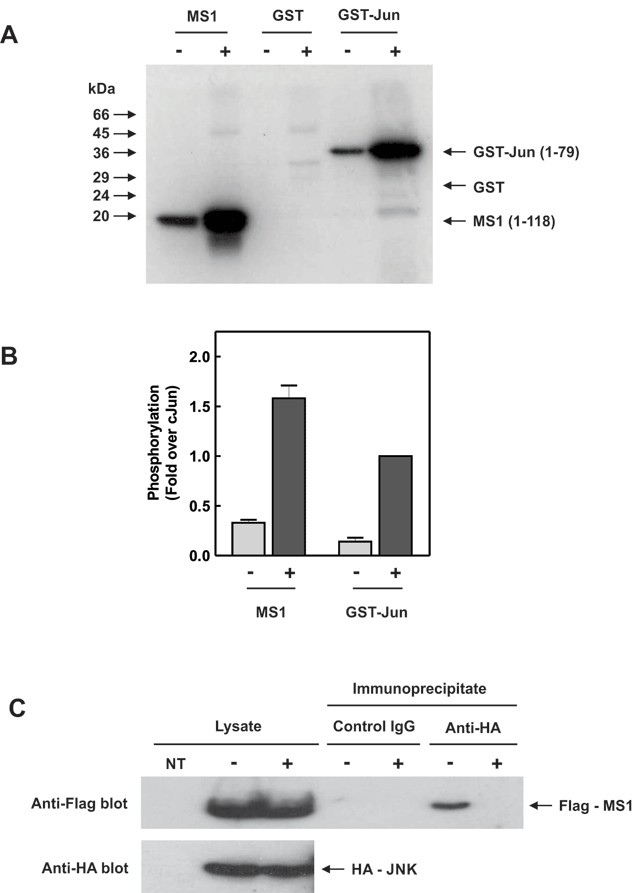
Figure 4
MS1 is a JNK target. (A) HEK cells, transfected with pcDNA3-HA-JNK and expressing HA-tagged JNK, were incubated with (+) or without (–) 0.5 M sorbitol for 30 minutes to activate the JNK pathway. HA-JNK was immunoprecipitated from the cell lysates and incubated with [γ-32P] ATP along with a purified N-terminal fragment of MS1 (1–118), GST or GST-Jun (1–79) in an in vitro immune-complex kinase assay. 32P-incorporation into substrates was determined by SDS-PAGE and PhosphorImager analysis. (B) Quantification was performed using ImageQuant software and the relative phosphorylation of MS1 compared to GST-Jun is shown (mean ± SEM [n = 3]). (C) HEK cells were co-transfected with pcDNA3-HA-JNK and pFlag-CMV2-MS1 to express both HA-tagged JNK and Flag-tagged MS1. The cells were treated with 0.5 M sorbitol for 30 min (+) or left untreated (–) and cell lysates immunoprecipitated with anti-HA antibody or control IgG. Cell lysates and immunoprecipitates were separated by SDS-PAGE and blotted with anti-Flag and anti-HA antibodies. Non-transfected cell lysates were run as a negative control (NT).
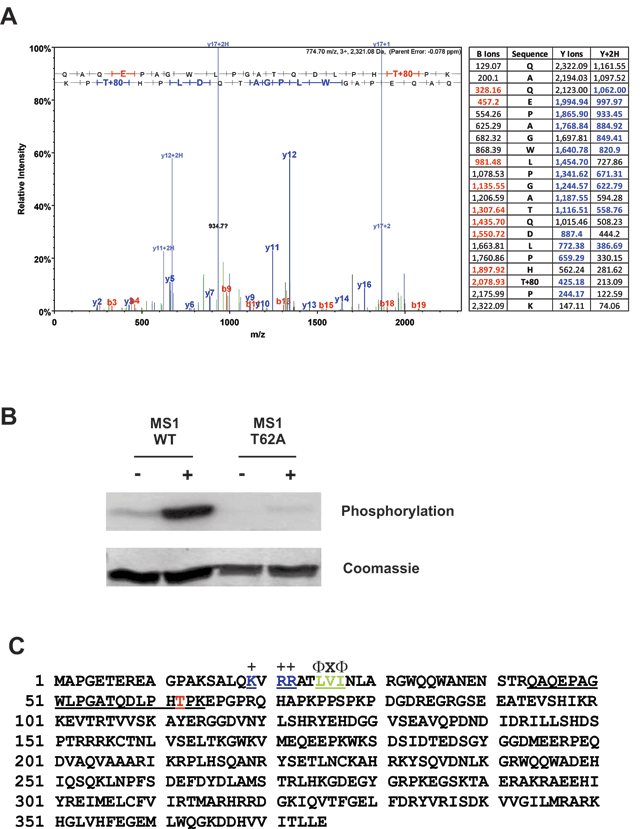
Figure 5
JNK phosphorylates MS1 in vitro at Threonine-62. (A) The N-terminal fragment of MS1 (1–118) was phosphorylated by JNK in vitro as described in Fig. 4A but using unlabelled ATP. The Coomassie-stained band corresponding to the MS1 substrate was excised from the gel and subjected to phosphorylation site analysis by tryptic digestion followed by LC-MS/MS. The LC-MS/MS trace and fragmentation table showing the detected b-ions (red) and y-ions (blue) are presented. (B) Active (+) or inactive (–) HA-JNK immunoprecipitated from HEK cells as described in Fig. 4A was incubated with [γ-32P] ATP and either the wild-type MS1 N-terminal fragment (1–118) or the same protein with a T62A mutation. 32P-incorporation was determined by SDS-PAGE and PhosphorImager analysis. (C) MS1 amino acid sequence showing the tryptic peptide (residues 44–64, underlined) containing Thr-62 (red) and the location of a putative MAPK docking site (residues 19–27, underlined with consensus sequence above).