
Figure 1
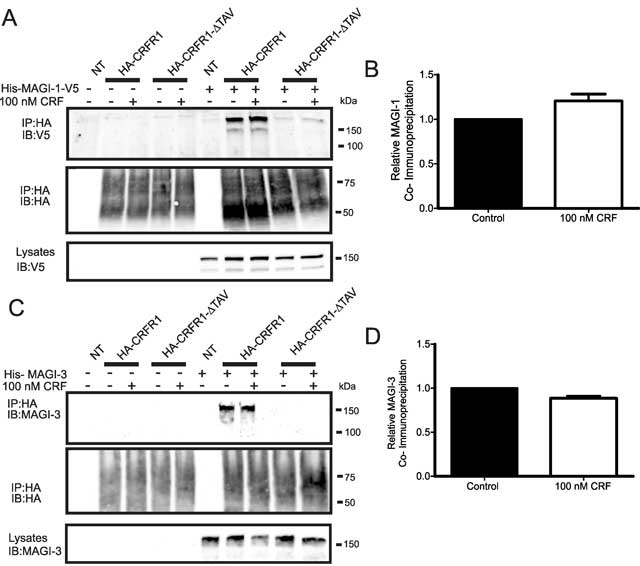
MAGI proteins co-immunoprecipitate with HA-CRFR1 in a PDZ-binding motif-dependent manner. HEK293 cells were co-transfected with HA-CRFR1 (WT or ΔTAV) and pcDNA or His-MAGI-1-V5. (A) Representative immunoblot of His-MAGI-1-V5 co-immunoprecipitated (IP) with HA-CRFR1 but not HA-CRFR1-ΔTAV which lacks the PDZ-binding motif. SDS-PAGE was used to analyze samples and immunoblots were performed with rabbit anti-V5. (B) Effect of CRF treatment was quantified using densitometry and had no significant difference on the amount of MAGI-1 co-immunoprecipitated with HA-CRFR1. HEK293 cells were co-transfected with HA-CRFR1 (WT or ΔTAV) and pcDNA or His-MAGI-3. (C) Representative immunoblot of His-MAGI-3 co-immunoprecipitated (IP) with HA-CRFR1 but not HA-CRFR1-ΔTAV which lacks the PDZ-binding motif. SDS-PAGE was used to analyze samples and immunoblots were performed with rabbit anti-MAGI-3. (D) Effect of CRF treatment was quantified using densitometry and had no significant difference on the amount of His-MAGI-3 co-immunoprecipitated with HA-CRFR1. Data are representative of three independent experiments.
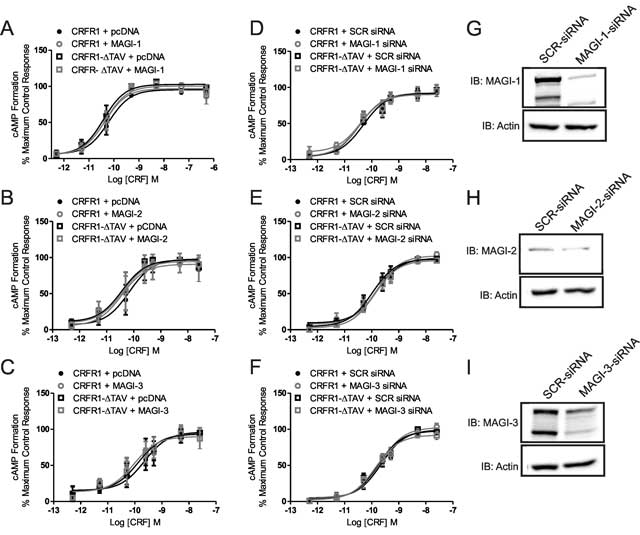
Figure 2
MAGI proteins do not regulate CRFR1-mediated cAMP formation. Dose response for CRF-stimulated cAMP formation assessed using a BRET-based cAMP biosensor assay. CRFR1- and CRFR1-ΔTAV- mediated cAMP formation in either plasmid vector or MAGI-1 (A), MAGI-2 (B) or MAGI-3 (C) transfected HEK293 cells. CRFR1- and CRFR1- ΔTAV- mediated cAMP formation in either MAGI-1 siRNA (D), MAGI-2 siRNA (E) or MAGI-3 siRNA (F) transfected HEK293 cells. Shown are representative immunoblots showing siRNA knockdown of (G) MAGI-1, (H) MAGI-2, and (I) MAGI-3 with 80 pmol siRNA for 72 hours. The data represent the mean ± SEM of at least three independent experiments.
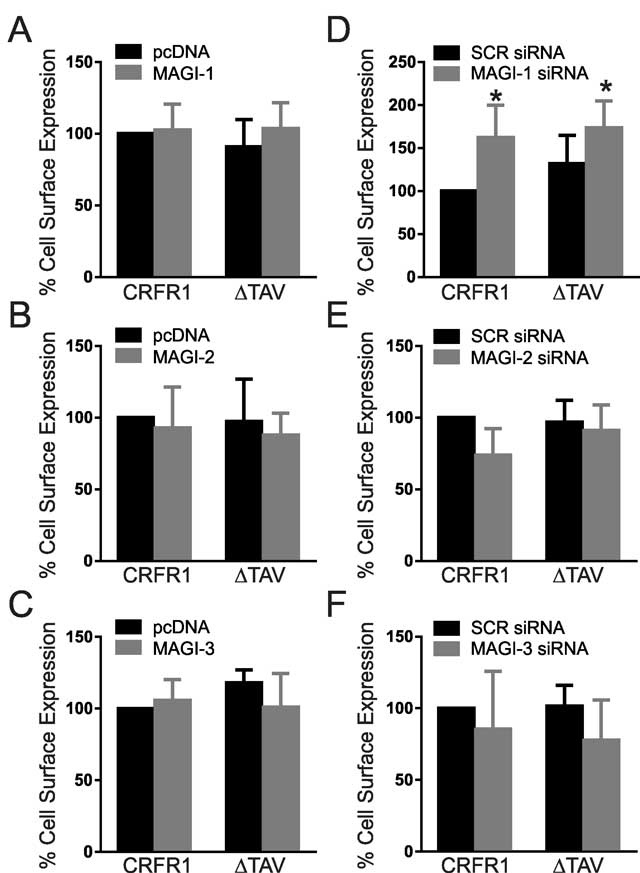
Figure 3
Effect of MAGI proteins on cell surface expression. Cell surface expression in HEK293 cells expressing either HA-CRFR1 or HA-CRFR1-ΔTAV along with MAGI-1 (A), MAGI-2 (B), MAGI-3 (C), MAGI-1 siRNA (D), MAGI-2 siRNA (E) or MAGI-3 siRNA (F) expressed as measured by flow cytometry. Data is normalized to HA-CRFR1 expression in the control pcDNA or SCR siRNA. The data represent the mean ± SEM of four independent experiments. P < 0.05 versus HA-CRFR1 cell surface expression.
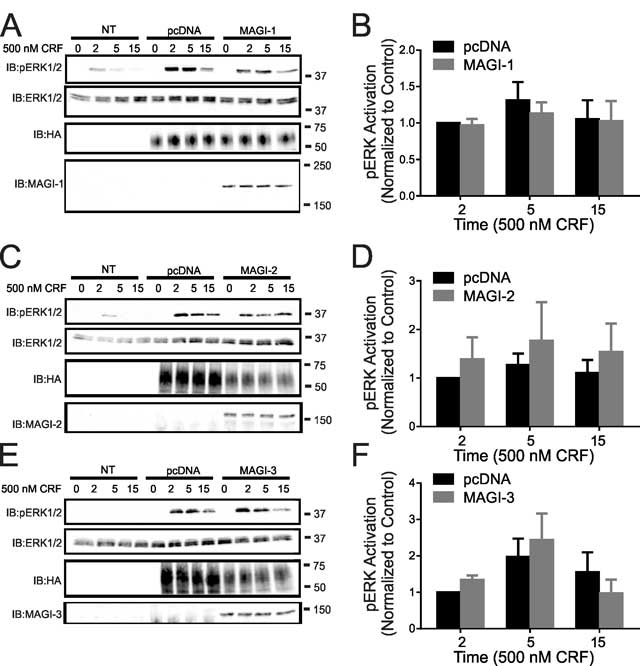
Figure 4
Effect of MAGI proteins overexpression on CRFR1-mediated ERK1/2 signaling. (A) Representative immunoblot showing ERK1/2 phosphorylation in response to 500 nM CRF treatment for 0, 2, 5, and 15 min in non-transfected (NT) HEK293 cells, and HEK293 cells transfected with HA-CRFR1 along with either pcDNA or His-MAGI-1. Also shown are corresponding immunoblots for total ERK1/2, MAGI-1 and HA-CRFR1 protein expression. (B) Densitometric analysis of ERK1/2 phosphorylation in response to 500 nM CRF treatment for 0, 2, 5, and 15 min. The data represent the mean ± SEM of four independent experiments. (C) Representative immunoblot showing ERK1/2 phosphorylation in response to 500 nM CRF treatment for 0, 2, 5, and 15 min in non-transfected (NT) HEK293 cells, and HEK293 cells transfected with HA-CRFR1 along with either pcDNA or MAGI-2. Also shown are corresponding immunoblots for total ERK1/2, MAGI-2 and HA-CRFR1 protein expression. (D) Densitometric analysis of ERK1/2 phosphorylation in response to 500 nM CRF treatment for 0, 2, 5, and 15 min. The data represent the mean ± SEM of six independent experiments. (E) Representative immunoblot showing ERK1/2 phosphorylation in response to 500 nM CRF treatment for 0, 2, 5, and 15 min in non-transfected (NT) HEK293 cells, and HEK293 cells transfected with HA-CRFR1 along with either pcDNA or MAGI-3. Also shown are corresponding immunoblots for total ERK1/2, MAGI-3 and HA-CRFR1 protein expression. (F) Densitometric analysis of ERK1/2 phosphorylation in response to 500 nM CRF treatment for 0, 2, 5, and 15 min. The data represent the mean ± SEM of six independent experiments.
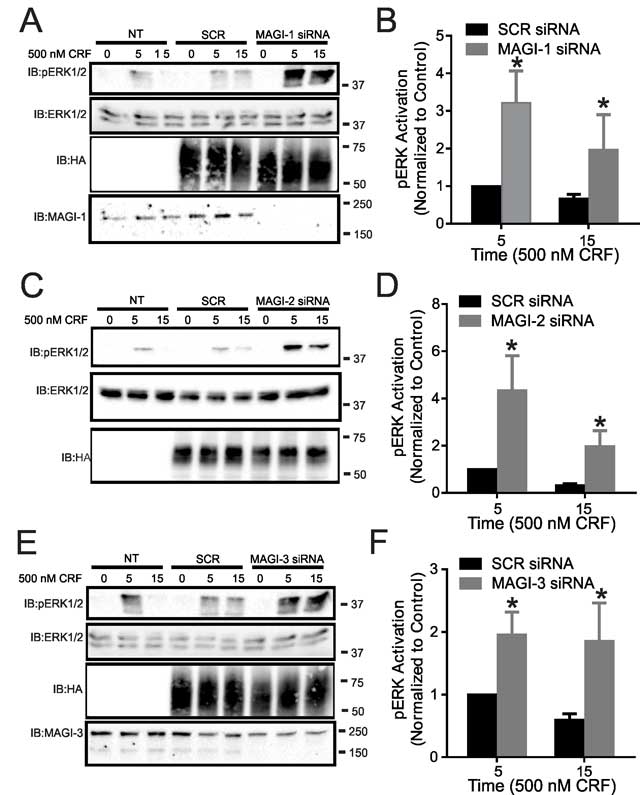
Figure 5
Effect of MAGI proteins knockdown on CRF-mediated ERK1/2 signaling. (A) Representative immunoblot showing ERK1/2 phosphorylation in response to 500 nM CRF treatment for 0, 5, and 15 min in non-transfected (NT) HEK293 cells, and HEK293 cells transfected with HA-CRFR1 along with either SCR siRNA or MAGI-1 siRNA. Also shown are corresponding immunoblots for total ERK1/2, MAGI-1 and HA-CRFR1 protein expression. (B) Densitometric analysis of ERK1/2 phosphorylation in response to 500 nM CRF treatment for 0, 5, and 15 min. The data represent the mean ± SEM of four independent experiments. (C) Representative immunoblot showing ERK1/2 phosphorylation in response to 500 nM CRF treatment for 0, 5, and 15 min in non-transfected (NT) HEK293 cells, and HEK293 cells transfected with HA-CRFR1 along with either SCR siRNA or MAGI-2 siRNA. Also shown are corresponding immunoblots for total ERK1/2 and HA-CRFR1 protein expression. (D) Densitometric analysis of ERK1/2 phosphorylation in response to 500 nM CRF treatment for 0, 5, and 15 min. (E) Representative immunoblot showing ERK1/2 phosphorylation in response to 500 nM CRF treatment for 0, 5, and 15 min in non-transfected (NT) HEK293 cells, and HEK293 cells transfected with HA-CRFR1 along with either SCR siRNA or MAGI-3 siRNA. Also shown are corresponding immunoblots for total ERK1/2, MAGI-3 and HA-CRFR1 protein expression. (F) Densitometric analysis of ERK1/2 phosphorylation in response to 500 nM CRF treatment for 0, 5, and 15 min. The data represent the mean ± SEM of four independent experiments. *P < 0.05 versus SCR siRNA control.
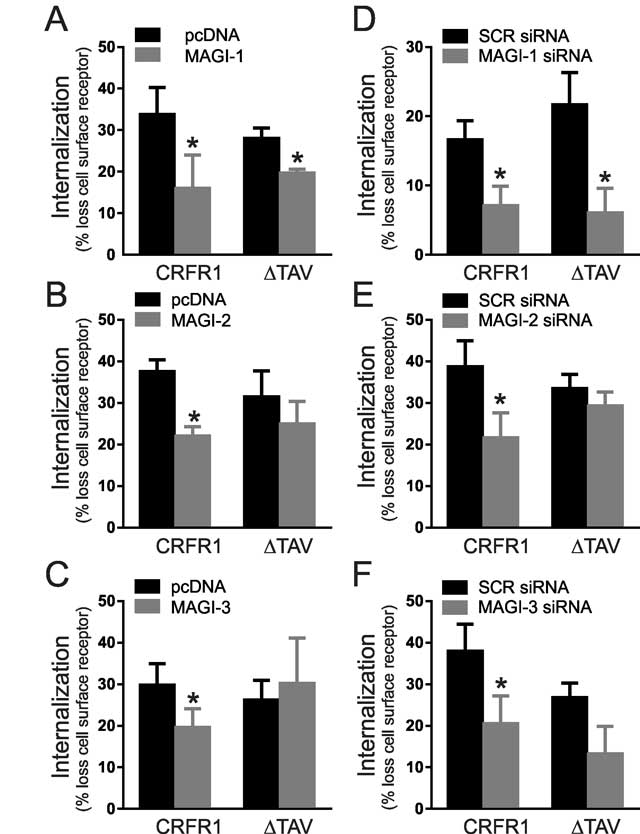
Figure 6
Effect of MAGI proteins expression on agonist-stimulated CRFR1 endocytosis. Agonist-stimulated internalization of either HA-CRFR1 or HA-CRFR1-ΔTAV following 500 nM CRF treatment for 30 min in the presence of either MAGI-1 (A), MAGI-2 (B), MAGI-3 (C), MAGI-1 siRNA (D), MAGI-2 siRNA (E), or MAGI-3 siRNA (F). The data represent the mean ± SEM of at least three independent experiments. * P < 0.05 versus empty vector or SCR siRNA control.
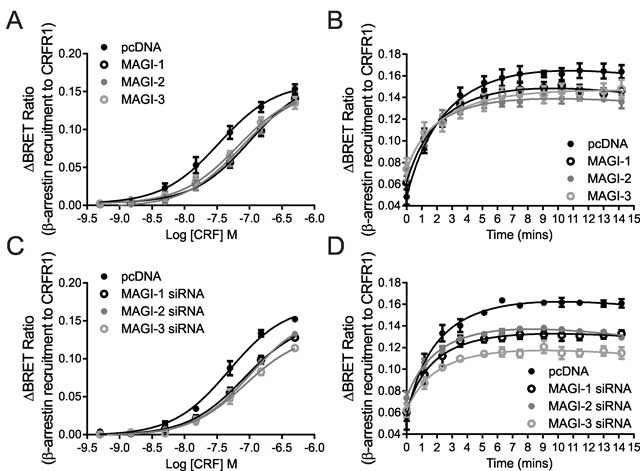
Figure 7
Effect of MAGI proteins expression on β-arrestin recruitment to CRFR1: BRET assays measured between β-arrestin-rLuc and CRFR1-YFP in the presence of MAGI-1, MAGI-2 or MAGI-3 (A, B) or MAGI-1 siRNA, MAGI-2 siRNA or MAGI-3 siRNA (C, D). A and C show dose responses of the interaction while B and D show the interaction as a function of time upon stimulation with 500 nM CRF. The data represent the mean ± SEM of at least four independent experiments.
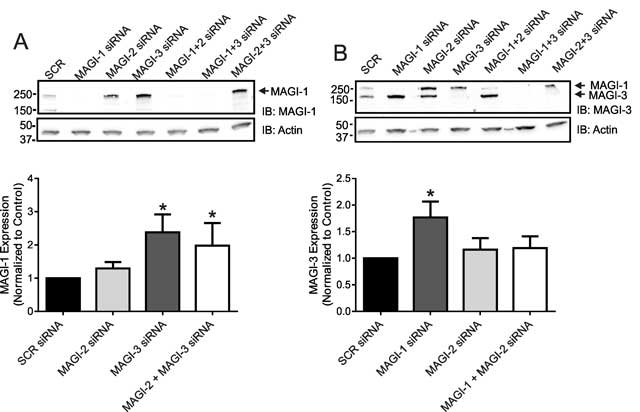
Figure 8
MAGUK proteins can regulate GPCRs function by a compensatory mechanism. (A) Representative immunoblot showing the levels of MAGI-1 in HEK293 cells transfected with siRNA combinations as labeled. Densitometric analysis shows MAGI-1 levels after normalization to actin as a loading control. (B) Representative immunoblot showing the levels of MAGI-3 in HEK293 cells transfected with siRNA combinations as labeled. Densitometric analysis shows MAGI-3 levels after normalization to actin as a loading control. The data represent the mean ± SEM of at least eight independent experiments. *P < 0.05 versus SCR siRNA control.