
Figure 1
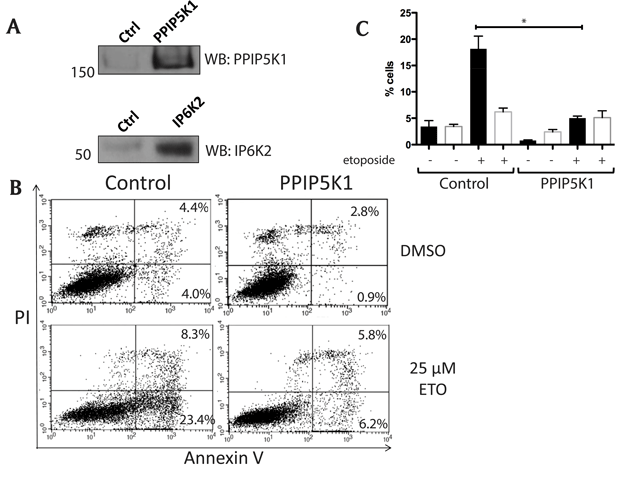
Flow cytometry analysis of apoptosis PPIPK1-expressing cells. A. Untransfected HEK 293F control and stable cell lines expressing PPIP5K1 and IP6K2 were subjected to immunoblot analysis using anti-PPIP5K1 and anti-IP6K2 antibodies. B. Representative data from flow cytometry from three independent experiments. HEK293F untransfected (control) and stable cell lines were incubated either with DMSO or 25 µM etoposide for 16 hours. All attached and detached cells were collected and double stained with Annexin V and propidium iodide (PI) using APOAF kit from Sigma following manufacture’s instructions. Percentage of healthy (unstained), early apoptotic cell (Annexin V only), late apoptotic (Annexin V and PI) and necrotic (PI only) cells were determined. C. Percentages of cells in early apoptosis (black bars) and late apoptosis, as determined from three independent flow cytometry experiments.
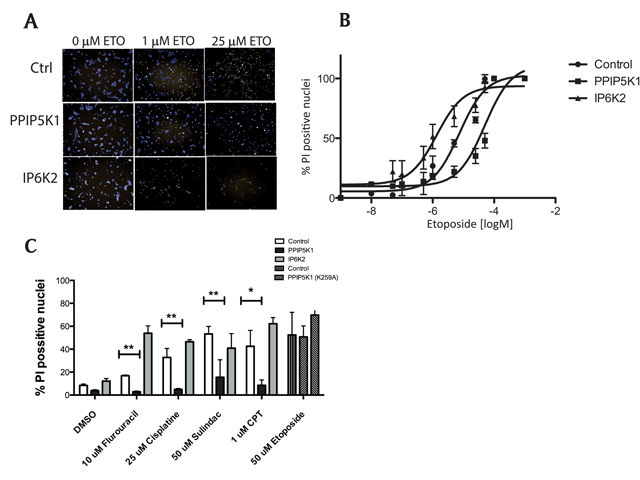
Figure 2
Analysis of apoptosis in PPIP5K-1 and IP6K2-expressing cells. A. HEK 293F control and stable cell lines were grown in 96 well plate, treated with 0, 1 µM and 25 µM etoposide for 16h. Cells were double stained with Hoeschst33342 (5 mg/ml) and propidium iodide (PI) (10 mg/ml) for 10 min and imaged in Operetta (Perkin Elmer) high content microscope. B. Dose-response curve of three cell lines treated with varying concentrations of etoposide for 16 h; Percentage of PI positive nuclei is used to asses cell viability; the graph is a curve of a single experiment of three independent experiments. C. Cell viability of HEK 293F control, and PPIP5K1, IP6K2, or PPIP5K1K295A stable cell lines treated with indicated concentrations of cisplatin, sulindac, camptothecin (CPT), 5-Fluorouracil, or etoposide for 3h and stained as described above. The graph is a single experiment, representative of three independent experiments. Two-way ANOVA test with Bonferroni post-test was used to compare p values between groups (**p < 0.01; ***p < 0.001).
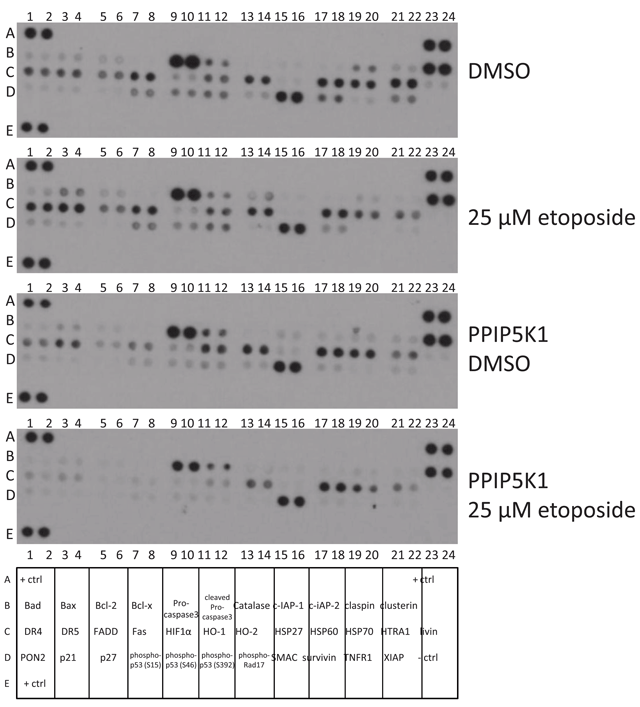
Figure 3
Overexpression of PPIP5K1 impacts apoptosis signaling. A. Apoptosis array of control and PPIP5K1-overexpressing cells. Results are representative of three independent experiments. B. Map of individual proteins in the apoptosis array.
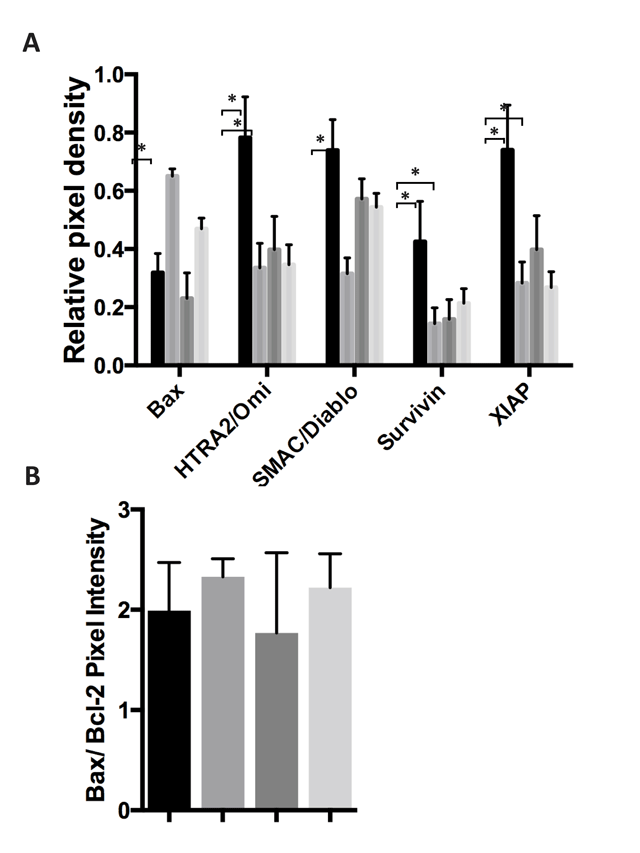
Figure 4
Overexpression of PPIP5K alters levels of proteins that control cell death. A. Apoptosis arrays of control and PPIP5K1-overexpressing cells were analyzed in triplicate using ImageJ software to identify those markers with altered expression in PPIP5K1-overexpressing cells and when treated with etoposide. The Fold change is the ratio of the average pixel density from etoposide treated cells to the average pixel density of DMSO treated cells for each marker measured in triplicate from three independent experiments. B. Apoptosis arrays of control and PPIP5K1-overexpressing cells were analyzed to determine the ratio of Bax and Bcl-2 pixel intensities. The ratio and the SD are shown for control cells treated with DMSO, control cells treated with etoposide, PPIP5K1-over expressing cells treated with DMSO, and PPIP5K1-overexpressing cells treated with etoposide.
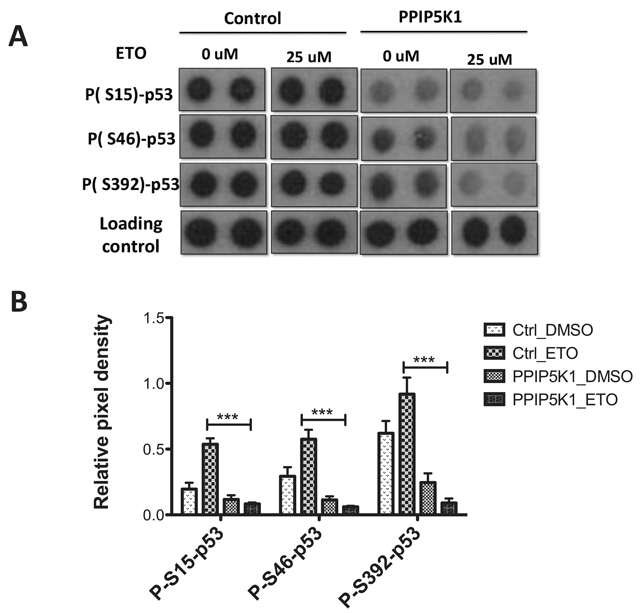
Figure 5
PPIP5K1 impacts p53 pathway phosphorylation. A. Protein apoptosis array of control and PPIP5K1 stable cell lines treated either with DMSO or 25mM etoposide for 16 h. An ECL developed apoptosis array film images of p53 phosphorylated markers along with loading controls of control and PPIP5K1 stable cell lines treated with either vehicle or etoposide. B. Bar graph showing relative pixel density of p53-phospho markers in the control and PPIP5K1 cells treated either with DMSO or etoposide. ImageJ software was used to measure pixel densities of each marker and relative pixel density was calculated as ratio of a signal to a loading control of each array. Relative pixel densities from three independent experiments were combined to make the graphs and two-way ANOVA statistical test was used to compare control and PPIP5K1 cells. Bonferroni post hoc test was used to compare groups and statistical significant difference is shown- Control_ETO vs PPIP5K1_ETO ( p < 0.001) for all 3 phospho-p53 markers.
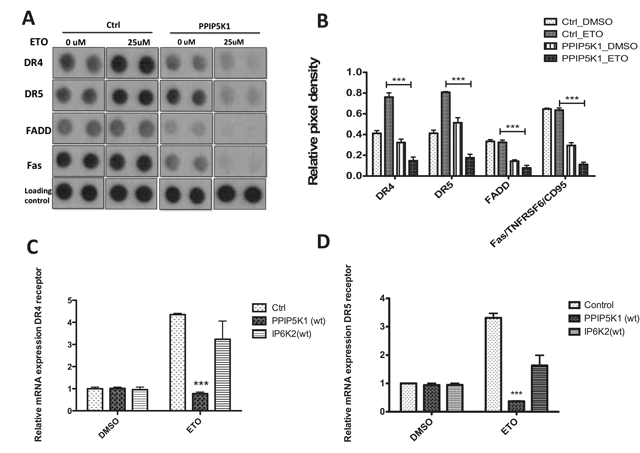
Figure 6
PPIP5K1 and IP6K2 impact on Death receptor expression. A. Protein apoptosis array of control and PPIP5K1 stable cell lines treated either with DMSO or 25 µM etoposide for 16 h. A ECL-developed apoptosis array film images of DR4, DR5, FADD and Fas proteins along with loading controls of control and PPIP5K1 stable cell lines treated with either vehicle or etopoiside. B. Bar graph showing relative pixel density of DR4, DR5, FADD, and Fas proteins in the control and PPIP5K1 cells treated either with DMSO or etoposide. ImageJ software was used to measure pixel densities of each marker and relative pixel density was calculated as ratio of a signal to a loading control of each array. Relative pixel densities from three independent experiments were combined to make the graphs and two-way ANOVA statistical test was used to compare control and PPIP5K1 cells. Bonferroni post hoc test was used to compare groups and statistical significant difference for control_ETO vs PPIP5K1_ETO ( p<0.001) for DR4, DR5, FADD and Fas proteins is shown. C. and D. Relative mRNA expression levels of DR4 (panel C) and DR5 (panel D) receptors in control, PPIP5K1 and IP6K2 cells treated either with vehicle or 25 mM etoposide for 16 h.