
1. Introduction
Paralympic sport classification aims to create competitive equity comparable to weight or age categories in non-disabled sport. Athletes compete against others with similar functional capacity rather than similar impairment aetiology [1]. Current class allocation in wheelchair sports relies on expert clinical assessment, which is inherently subjective. Evidence-Informed Classification (EIC) requires objective, quantifiable measures to validate or refine classifiers’ decisions [2]. However, developing these measures is difficult because trunk function is influenced by task, wheelchair configuration, and the dynamic sport environment [3].
The Volume of Action (VoA) test, which evaluates active range of motion (ROM), defined as a controlled trunk movement in multiple directions, has been adopted as the primary functional assessment tool in Wheelchair Basketball (WB) classification [4,5] and validated as discriminating between functional classes [6,7,8,9]. In this context, “functional” refers to task-specific movement performance (e.g., maximal reach), which differs from underlying trunk functions (strength, ROM, and coordination) that enable such movements. A Delphi expert consensus identified VoA as an important performance determinant, ranking it alongside wheelchair mobility performance [10]. Athletes use their trunk functional potential for reaching, ball handling, maintaining balance during contact, generating propulsion force, and executing rapid directional changes that define competitive advantage in wheelchair court sports [11]. Consequently, WB classification systems prioritise trunk functional assessment [4]. The system ensures fair competition by assigning athletes to one of eight functional classes from 1.0 to 4.5 (in 0.5 steps) with team point totals capped at 14 points [4]. While current classification systems remain qualitative, emerging quantitative kinematic assessment methods predominantly measure only whole-trunk movements. This approach misses cases where similar VoA ranges are achieved through different movement patterns (e.g., starting movement using the shoulder girdle rather than the trunk), thereby masking underlying trunk function limitations.
Despite this limitation, inter-segmental trunk kinematics remains an unexplored aspect of trunk functional assessment in Paralympic classification [12]. It connects the athlete’s neuromuscular control (impairment) with their resulting movement strategy (kinematics). Athletes with severe impairments altered trunk movement strategy to compensate for reduced lower trunk function [13]. In contrast, athletes with preserved trunk control should demonstrate physiological patterns. Quantifying these differences in upper and mid trunk angular movement may assist classifiers in distinguishing between functional classes.
Inertial Measurement Units (IMUs) offer a practical solution. These wireless sensors measure three-dimensional orientation using integrated accelerometers, gyroscopes, and magnetometers [14,15,16]. Unlike camera-based systems, IMUs enable tracking without line-of-sight constraints or marker placement requirements, making them well-suited for assessing inter-segmental trunk kinematics.
This exploratory study examined whether inter-segmental trunk kinematics (C7–T8) adds classification value beyond whole-trunk VoA measures. The study tested whether segmental movement patterns distinguish WB functional classes in different external support conditions (Full, Partial, and No Support) and sport-relevant context (Sport Wheelchair). This work aims to support the development of an objective and sensitive metric to advance EIC systems in Paralympic sports.
2. Materials and methods
2.1. Participants
Seventy-three wheelchair athletes from Brazil and Poland were recruited through convenience sampling from wheelchair basketball teams and sports clubs, supplemented by snowball recruitment. Ten participants were excluded due to incomplete data (fewer than 50% of trials completed or inability to perform), leaving sixty-three wheelchair athletes (54 males, 9 females; mean age: 33.7 ± 10.2 years) from Brazil (n = 40) and Poland (n = 23). Medical diagnoses included spinal cord injury (n = 25), lower limb amputation (n = 12), spina bifida (n = 12), and other conditions (n = 14). Most (n = 54) were wheelchair basketball players competing at national and international levels, with IWBF classifications ranging from 1.0 to 4.5 (class 1.0: n = 8; 1.5: n = 8; 2.0: n = 7; 2.5: n = 3; 3.0: n = 8; 3.5: n = 5; 4.0: n = 9; 4.5: n = 6). The remaining 9 participants competed in wheelchair fencing (6 class B and 1 class A), racing (n = 1), and powerlifting (n = 1).
Inclusion criteria were age between 18 and 60 years, neuromusculoskeletal impairment eligible for wheelchair sport competition, at least one year of wheelchair sport experience, and absence of pressure ulcers and shoulder pain. The study received ethical approval from the Ethics Committee of the State University of Campinas, Brazil (CAAE 85177424.4.0000.5404), the Senate Research Ethics Committee of the Józef Piłsudski University of Physical Education in Warsaw, Poland (SKE 01-28/2024), and the Swedish Ethical Review Authority (Dnr 2023-00990-01). All participants provided written informed consent before participation.
2.2. Assessment protocol for trunk and hip function
Trunk and hip function were assessed using the Manual Muscle Test (MMT) protocol [17,18], administered by registered physical therapists trained in the standardised procedure. Trunk function was assessed across seven movements (flexion, extension, bilateral rotation, bilateral lateral tilt, and combined trunk–hip extension), with each movement scored 0–2 (0 = no contraction, 1 = weak muscle activation, 2 = movement against resistance), producing a maximum of 14 points (Trunk Total) [18]. Hip function was evaluated bilaterally across four movement directions (flexion, extension, adduction, and abduction), with each movement scored from 0 (no muscle activation) to 5 (movement against strong resistance), resulting in a maximum of 20 points per hip (Hip Total) [17]. The Trunk–Hip Total was calculated as the sum of trunk and hip scores, normalised to a maximum of 28 points and rounded to two decimal places:
2.3. Measurement protocol
Participants performed trunk flexion, extension, bilateral rotation, and lateral tilt in a seated position under four ergonomic conditions. The protocol followed a fixed sequence to evaluate inter-segmental kinematics with varying levels of external trunk support: three conditions in a standardised assessment chair and one in the participant’s sport wheelchair (Figure 1). This progression across conditions allowed for safe evaluation of active ROM under varying ergonomic conditions (levels of external support). Each movement was executed twice at the maximum active ROM at a self-selected comfortable speed. Hands were positioned on the sternum to prevent arm interference.
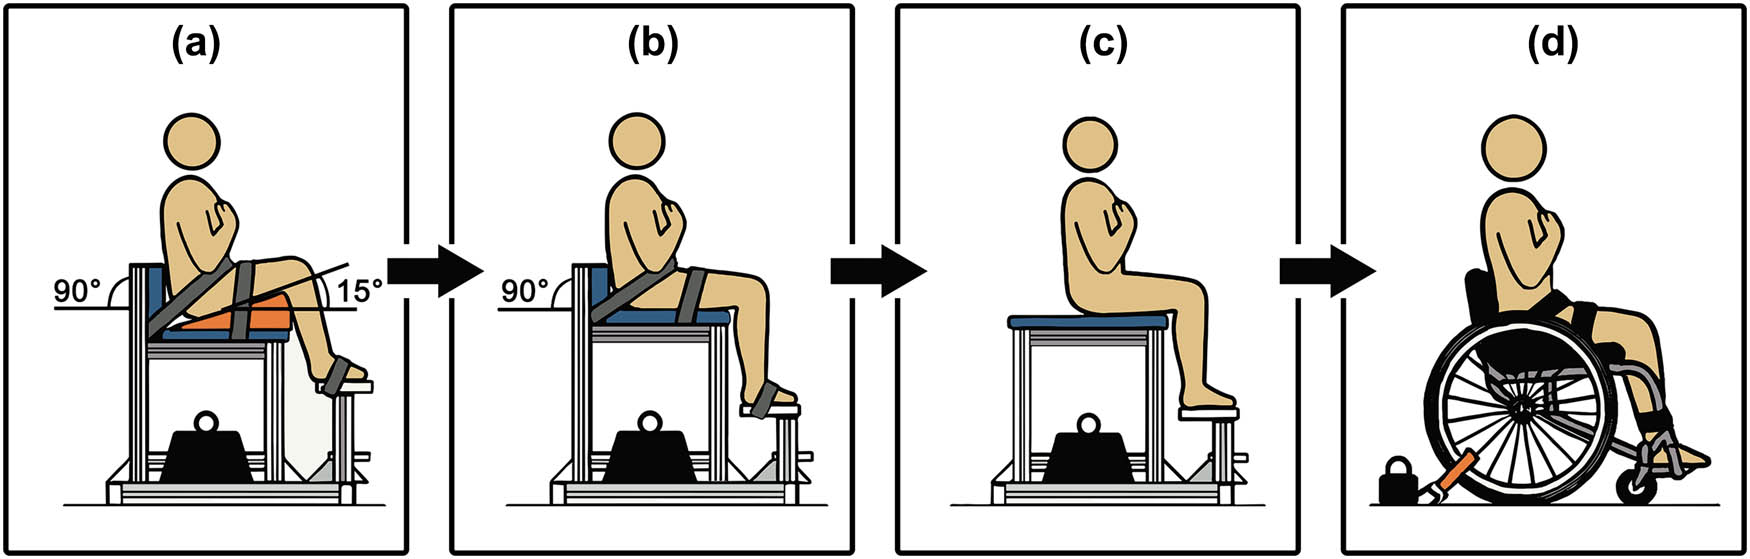
Figure 1
Different levels of external support during trunk VoA (active ROM) assessment. Four testing conditions with progressively reduced external trunk and leg support: (a) full Support with 15° seat inclination, backrest, and footrest, pelvic, thigh, and foot straps; (b) partial Support with flat seat, backrest, and straps; (c) no Support with flat seat without straps; and (d) sport Wheelchair with participant’s personal equipment and adaptive devices.
The standardised assessment chair allowed for backrest adjustment (for-aft and vertical) and customisation to each participant. The first condition (Figure 1a – Full Support) included 15° seat inclination, a backrest, and pelvic and thigh stabilisation straps to provide maximum external stability, with footrest position adjusted to ensure full foot contact. The second condition (Figure 1b – Partial Support) removed the seat inclination but retained the backrest and straps. For this and the subsequent condition, the configuration maintained 90° of hip flexion, 90° of knee flexion, and a 90° ankle angle. The third condition (Figure 1c – No Support) eliminated all external trunk support except the footrest. In the fourth condition (Sport Wheelchair), performed only by WB athletes, participants used their own sport wheelchair configuration with customary settings (seat inclination, straps, and other supports). The wheelchair remained fixed to the ground (Figure 1d).
2.4. Instrumentation
Movement data were collected using two inertial measurement units (IMUs; x-IMU3, X-I/O Technologies, Bristol, UK). Each sensor combined a tri-axial accelerometer, gyroscope, and magnetometer with an onboard Attitude and Heading Reference System (AHRS) algorithm that determined sensor orientation relative to Earth’s gravitational and magnetic fields. Sensors were positioned at the spinal vertebrae C7 and T8 (Figure 2), as these locations capture movement of both the upper and mid trunk segments [19,20]. The sensors were aligned along the spine and attached to the skin with double-sided tape.
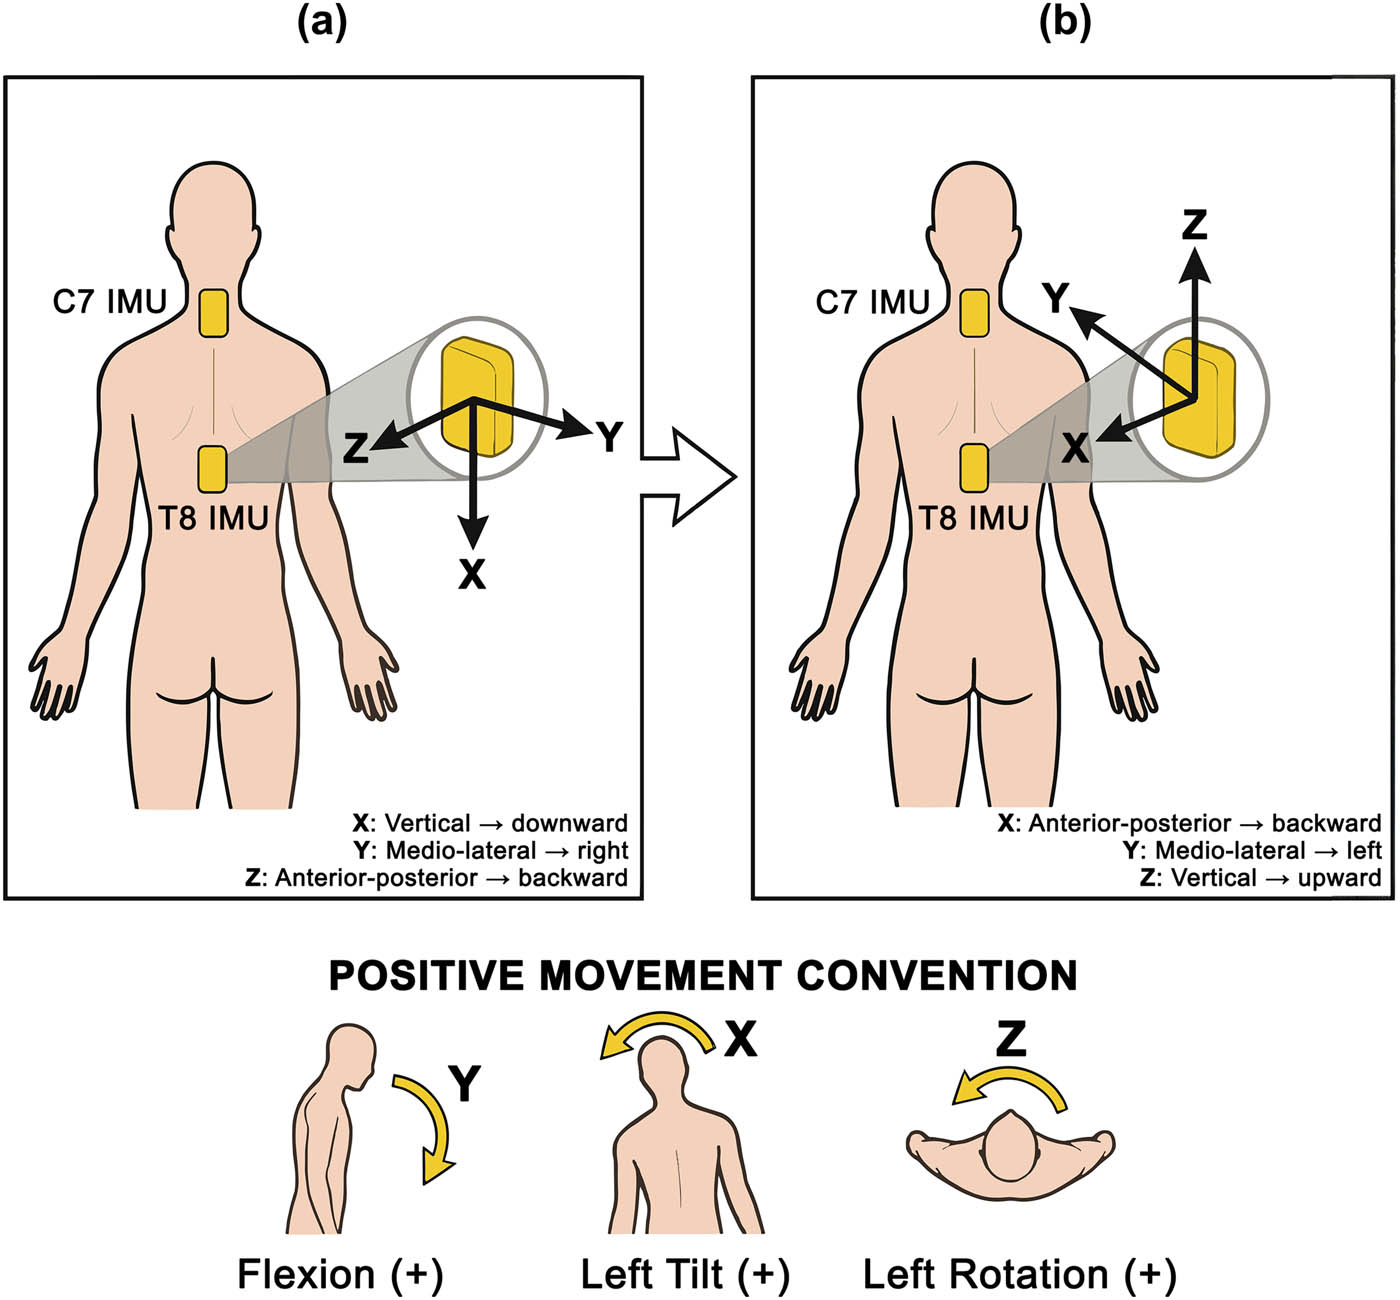
Figure 2
IMU Sensor orientation processing flow: (a) Sensors were placed at C7 and T8 vertebrae with initial coordinate axes: x-vertical (inferior), y-medio-lateral (right), z-antero-posterior (posterior). (b) Sensor orientations were rotated to align the x-axis with gravity during baseline trials, then transformed using rotational matrices to establish the anatomical reference frame: Z-vertical (upward), Y-medio-lateral (left), and X-antero-posterior (backward). This standardisation defined flexion, left tilt, and left rotation as positive angular values.
The IMU coordinate frame consisted of three axes: a vertical axis (x; pointing inferiorly), a medio-lateral axis (y; pointing right), and an antero-posterior axis (z; pointing posteriorly, Figure 2a).
Data were acquired using the x-IMU3 proprietary software at a sampling rate of 100 Hz. All processing was performed using MATLAB R2021a (MathWorks, Natick, MA, USA). Individual CSV files files exported from each sensor and trial were imported and consolidated into a unified data structure.
2.5. Data extraction
Sensor data were rotated to align the x-axis with gravity during static baseline trials when participants sat still facing forward, ensuring correct vertical axis orientation. A coordinate transformation was then applied using rotational matrices (Figure 2b) to establish a consistent reference frame: vertical z-axis (upward), medio-lateral y-axis (left), and antero-posterior x-axis (backward). This standardised movement direction: flexion, left tilt, and left rotation as positive angular values, and extension, right tilt, and right rotation as negative.
Trunk angular movement was analysed using custom MATLAB scripts that separated movements into three planes: flexion–extension, lateral tilt, and axial rotation for all participants and varying levels of external support. Euler angles were derived from quaternion-based sensor orientation data using a YZX rotation sequence. The highest peak value for each movement direction in each trial was exported for analysis. Peak detection employed a semi-automated approach: an algorithm first identified potential peaks (minimum 1.5 s separation, excluding the initial 1.0 s), followed by visual inspection and manual refinement where necessary using MATLAB’s ginput.m function.
Inter-segmental kinematics was assessed through temporal peak matching (Figure 3). For each maximum displacement detected at C7, the nearest corresponding T8 peak within a ±2.0 s window was identified and paired. A broad ±2.0-s search window captured delayed responses in participants with severe impairments, with correct pairing confirmed during the visual inspection phase. A 1.5° threshold defined the minimum angular difference between C7 and T8 peaks, serving as a conservative lower bound to filter measurement noise, aligning with the typical measurement errors (1.0–3.0°) reported for IMU-based trunk kinematics [16]. Given the low movement velocity, signal peaks were predominantly rounded rather than sharp. This threshold ensures that timestamps are considered synchronised unless a distinct angular deviation is observed. This matching procedure allowed for the calculation of inter-segmental angular differences (C7 minus T8) at corresponding movement peaks.
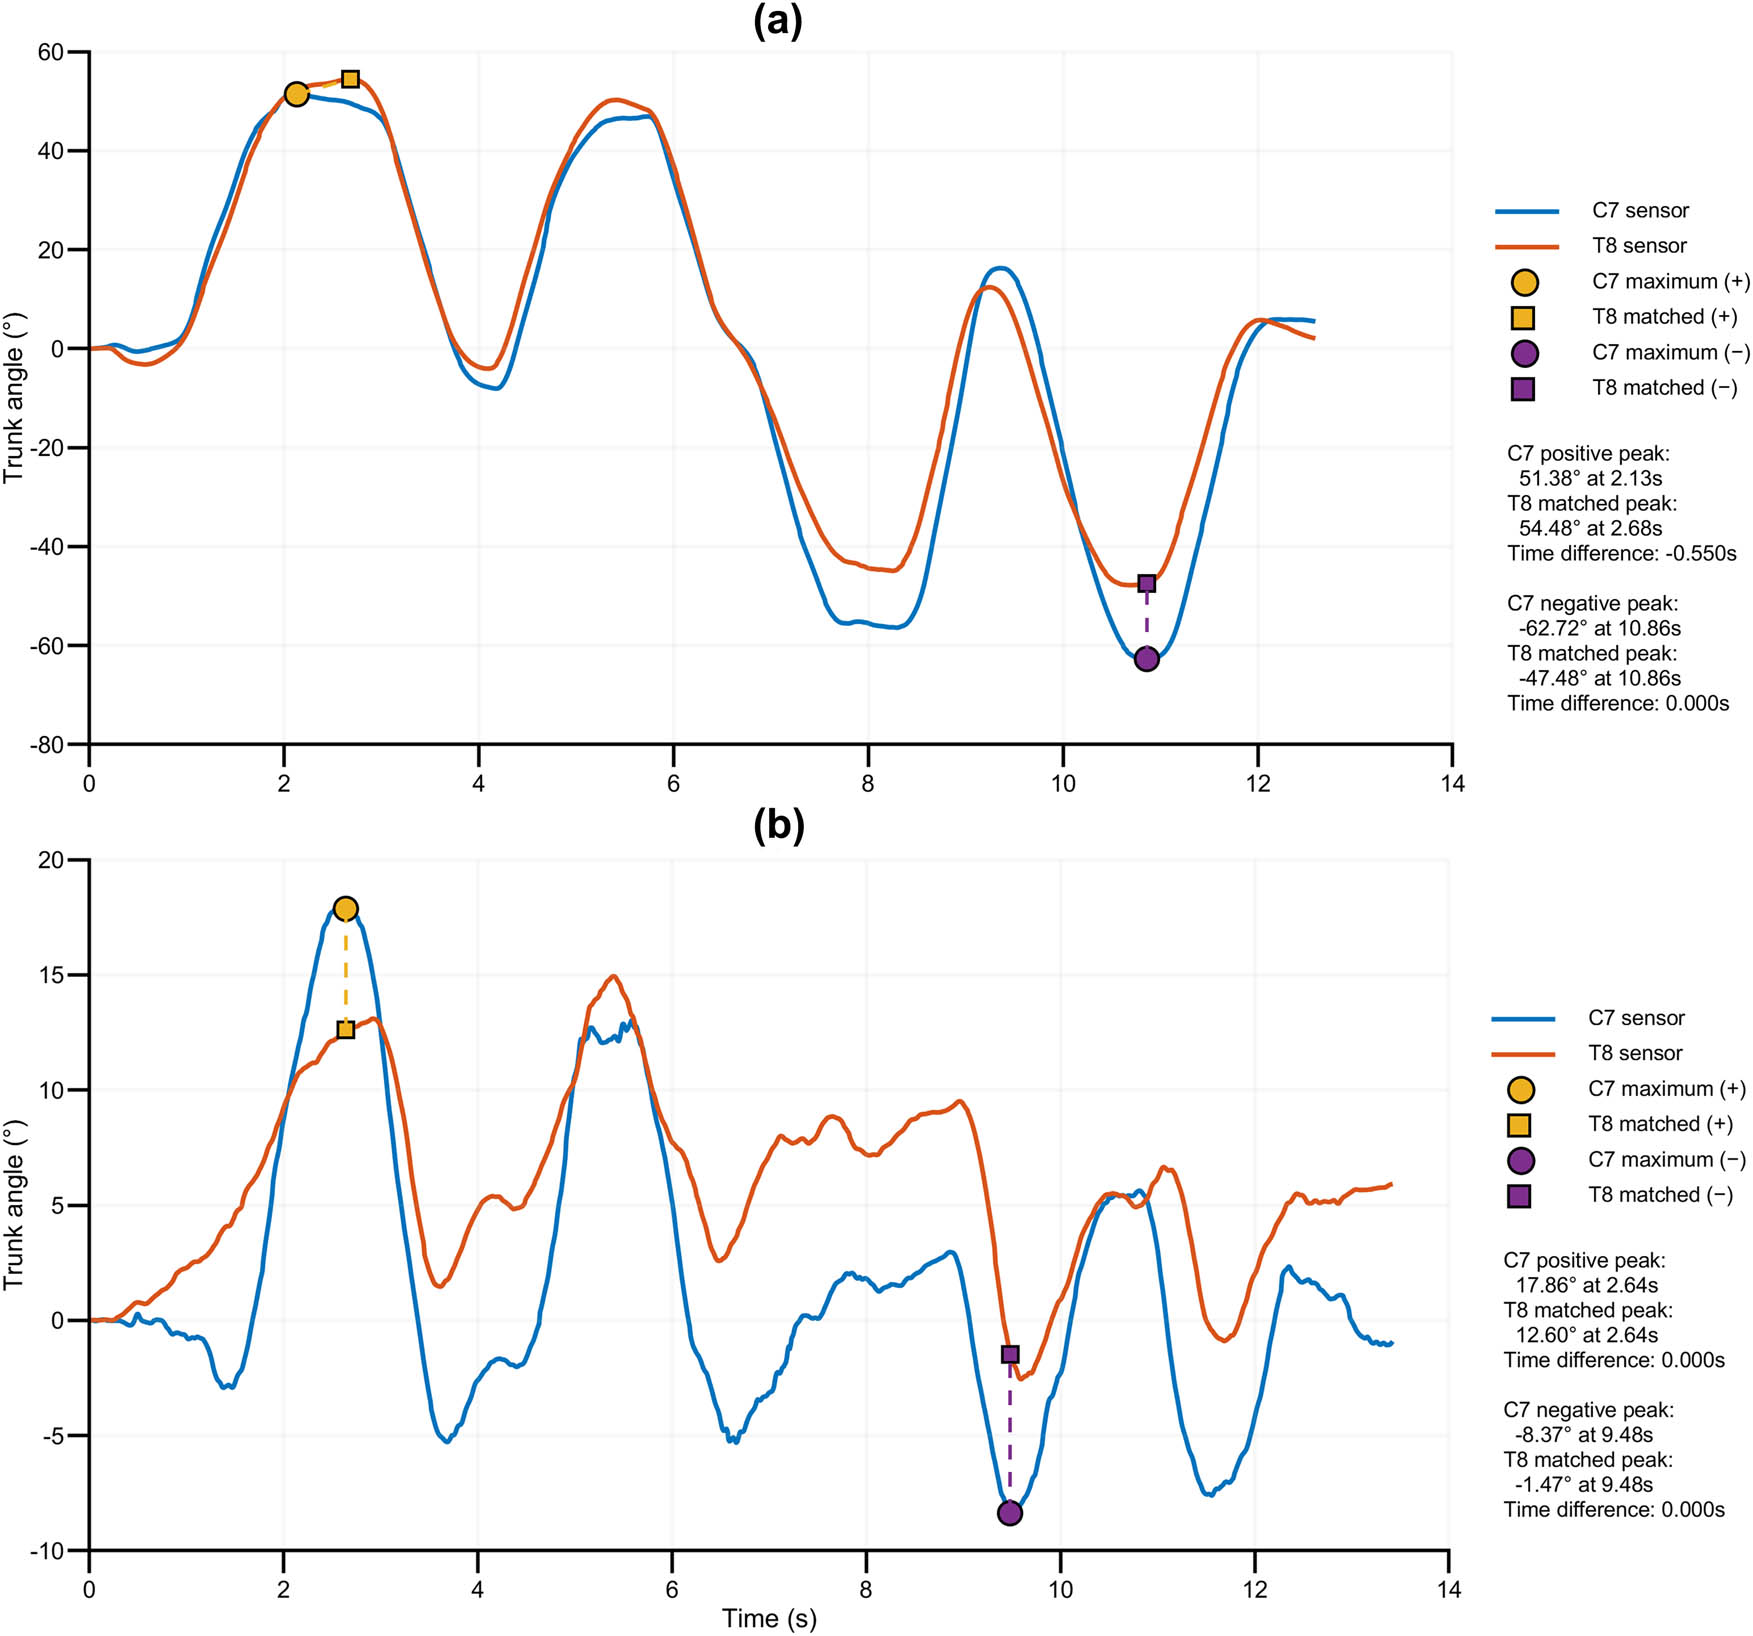
Figure 3
Representative examples of the peak matching procedure during lateral tilt in the partial support condition. Panel (a) shows a participant with lower limb impairment but fully preserved trunk function (WB Class 4.5). Panel (b) shows a participant with minimal trunk function (WB Class 1.0) demonstrating a limited volume of action (VoA) with visible compensatory upper trunk movements. Both graphs display lateral tilt cycles with positive peaks indicating left lateral tilt and negative peaks indicating right lateral tilt, interspersed with returns to neutral position (approximately 0°). Yellow circles indicate C7 peaks matched to corresponding T8 peaks (yellow squares). Purple markers indicate negative peaks (right lateral tilt).
Based on this peak matching process, the angular difference between the C7 and T8 sensors was defined as the primary outcome, calculated for every movement trial across the three planes of motion (flexion/extension, lateral tilt, and rotation). For lateral tilt and rotation, values were calculated as the mean of left and right movements.
2.6. Statistical analysis
2.6.1. Cluster analysis
Participants were classified into four trunk function groups using hierarchical cluster analysis based on the MMT Trunk–Hip total. The analysis used Euclidean distance metrics and Ward’s minimum variance linkage method. Iterative analysis indicated that both k = 3 and k = 4 yielded a Silhouette coefficient of ≈0.65, indicating reasonable cluster structure [21]. The four-cluster model was selected because it maximised separation of intermediate function levels while maintaining non-overlapping score ranges between bordering clusters (Figure 4).
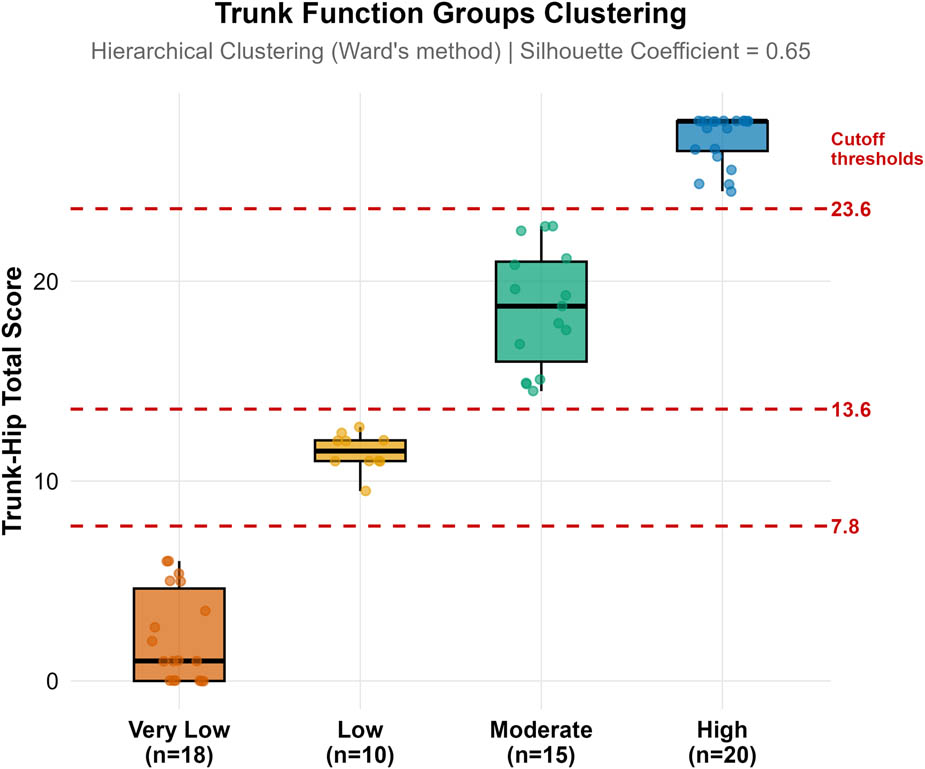
Figure 4
Distribution of Trunk–Hip Total Scores (max 28 points) across Trunk Function Clusters. Boxplots show participant distribution across four clusters with cutoff thresholds (red dashed lines) at 7.8, 13.6, and 23.6 points. Dots represent individual participants.
2.6.2. Angular difference analysis
Non-parametric methods were used for all comparisons due to non-normal data distribution (Shapiro–Wilk tests). Wilcoxon Signed-Rank tests compared paired C7 and T8 measurements for each movement direction, ergonomic condition, and trunk function group.
Kruskal–Wallis tests evaluated differences in peak trunk angles between trunk function groups for each movement and condition. Post-hoc pairwise comparisons used Dunn’s test with Bonferroni correction. For C7–T8 angular difference analysis, post-hoc comparisons used Wilcoxon rank-sum tests with Bonferroni correction.
Spearman’s rank correlation evaluated relationships between C7 and T8 measurements across movements and conditions. Total ROM was calculated as the sum of peak angles across all movements within each condition. Statistical procedures were performed using R (v4.5.2) [22]. Data visualisation used ggplot2 [23] and ggpubr [24].
3. Results
3.1. Cluster group distribution
Cutting the dendrogram at k = 4 clusters identified four distinct groups representing progressively increasing levels of trunk function. Trunk–Hip total score thresholds separating the clusters were identified at 7.8, 13.6, and 23.6 points (Figure 4). These cutoffs differentiated participants into groups based on trunk–hip function level: para-athletes with very low, low, moderate, and high trunk function. Subsequently, these groups are referred to by their functional level (e.g., “Very Low trunk function group”).
Table 1 presents participant characteristics by cluster.
Table 1
Demographics and scores of participants categorised by trunk function clusters
| Trunk Function Cluster | N | Sex (M/F) | Age (years) M ± SD | WB/Other Sports | WB Classification points M ± SD (range) | Trunk–Hip Total Score M ± SD (range) |
|---|---|---|---|---|---|---|
| 1 (Very Low) | 18 | 16/2 | 35.8 ± 11.3 | 15/3 | 1.30 ± 0.37 (1.0–2.0) | 2.20 ± 2.32 (0.0–7.8) |
| 2 (Low) | 10 | 9/1 | 35.4 ± 11.5 | 7/3 | 1.86 ± 0.38 (1.5–2.5) | 11.46 ± 0.9 (7.8–13.6) |
| 3 (Moderate) | 15 | 14/1 | 31.5 ± 10.9 | 12/3 | 2.92 ± 0.51 (2.0–3.5) | 18.62 ± 2.98 (13.6–23.6) |
| 4 (High) | 20 | 15/5 | 32.6 ± 7.2 | 20/0 | 3.92 ± 0.57 (2.5–4.5) | 27.12 ± 1.26 (23.6–28.0) |
| Total | 63 | 54/9 | 33.7 ± 10.2 | 54/9 | 2.7 ± 1.2 (1.0–4.5) | 15.49 ± 10.20 (0.0–28.0) |
WB classification refers to the IWBF functional classification system (1.0-4.5; lower scores indicate more severe impairment); nine participants from other sports lacked this classification. Values are mean ± standard deviation.
Ergonomic conditions influenced trial completion rate; the no-support condition showed the greatest separation between groups (range = 81.5%). In this condition, 14 of 18 Very Low function participants (77.8%) and six of ten Low function participants (60%) failed to complete the trials, compared to 2 of 15 Moderate function participants (13.3%) and 0 of 20 High function participants (Figure 5).
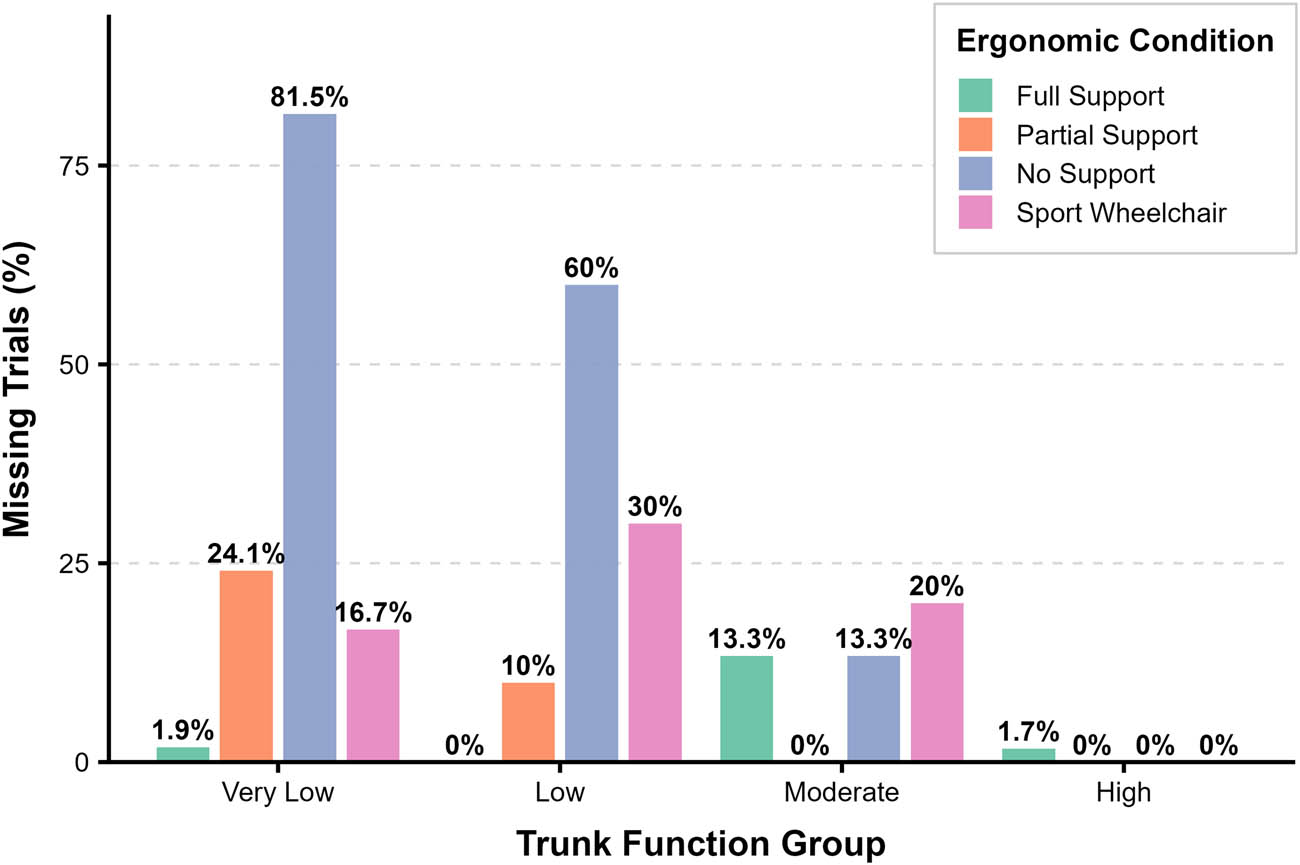
Figure 5
The percentage of missing trials (floor effect) grouped by Trunk Function Cluster. Bar colours represent the ergonomic conditions.
For the Sport Wheelchair condition, measurements were restricted to WB players using their own equipment; nine athletes from other disciplines did not complete this condition (14.3% missing trials). For the Full Support condition, data loss occurred for some participants, as the participant could not sit with the inclination pillow. For the Partial Support condition, participants who struggled during Full Support tasks were not progressed further (testing limited to Full Support and Sport Wheelchair), resulting in higher missing rates in Very Low (24.1%) and Low (10%) function groups.
3.2. Analysis of C7–T8 trunk angle measurements
Figure 6 presents trunk angle measurements from C7 and T8 sensors across movement types, ergonomic conditions, and Trunk Function Groups.
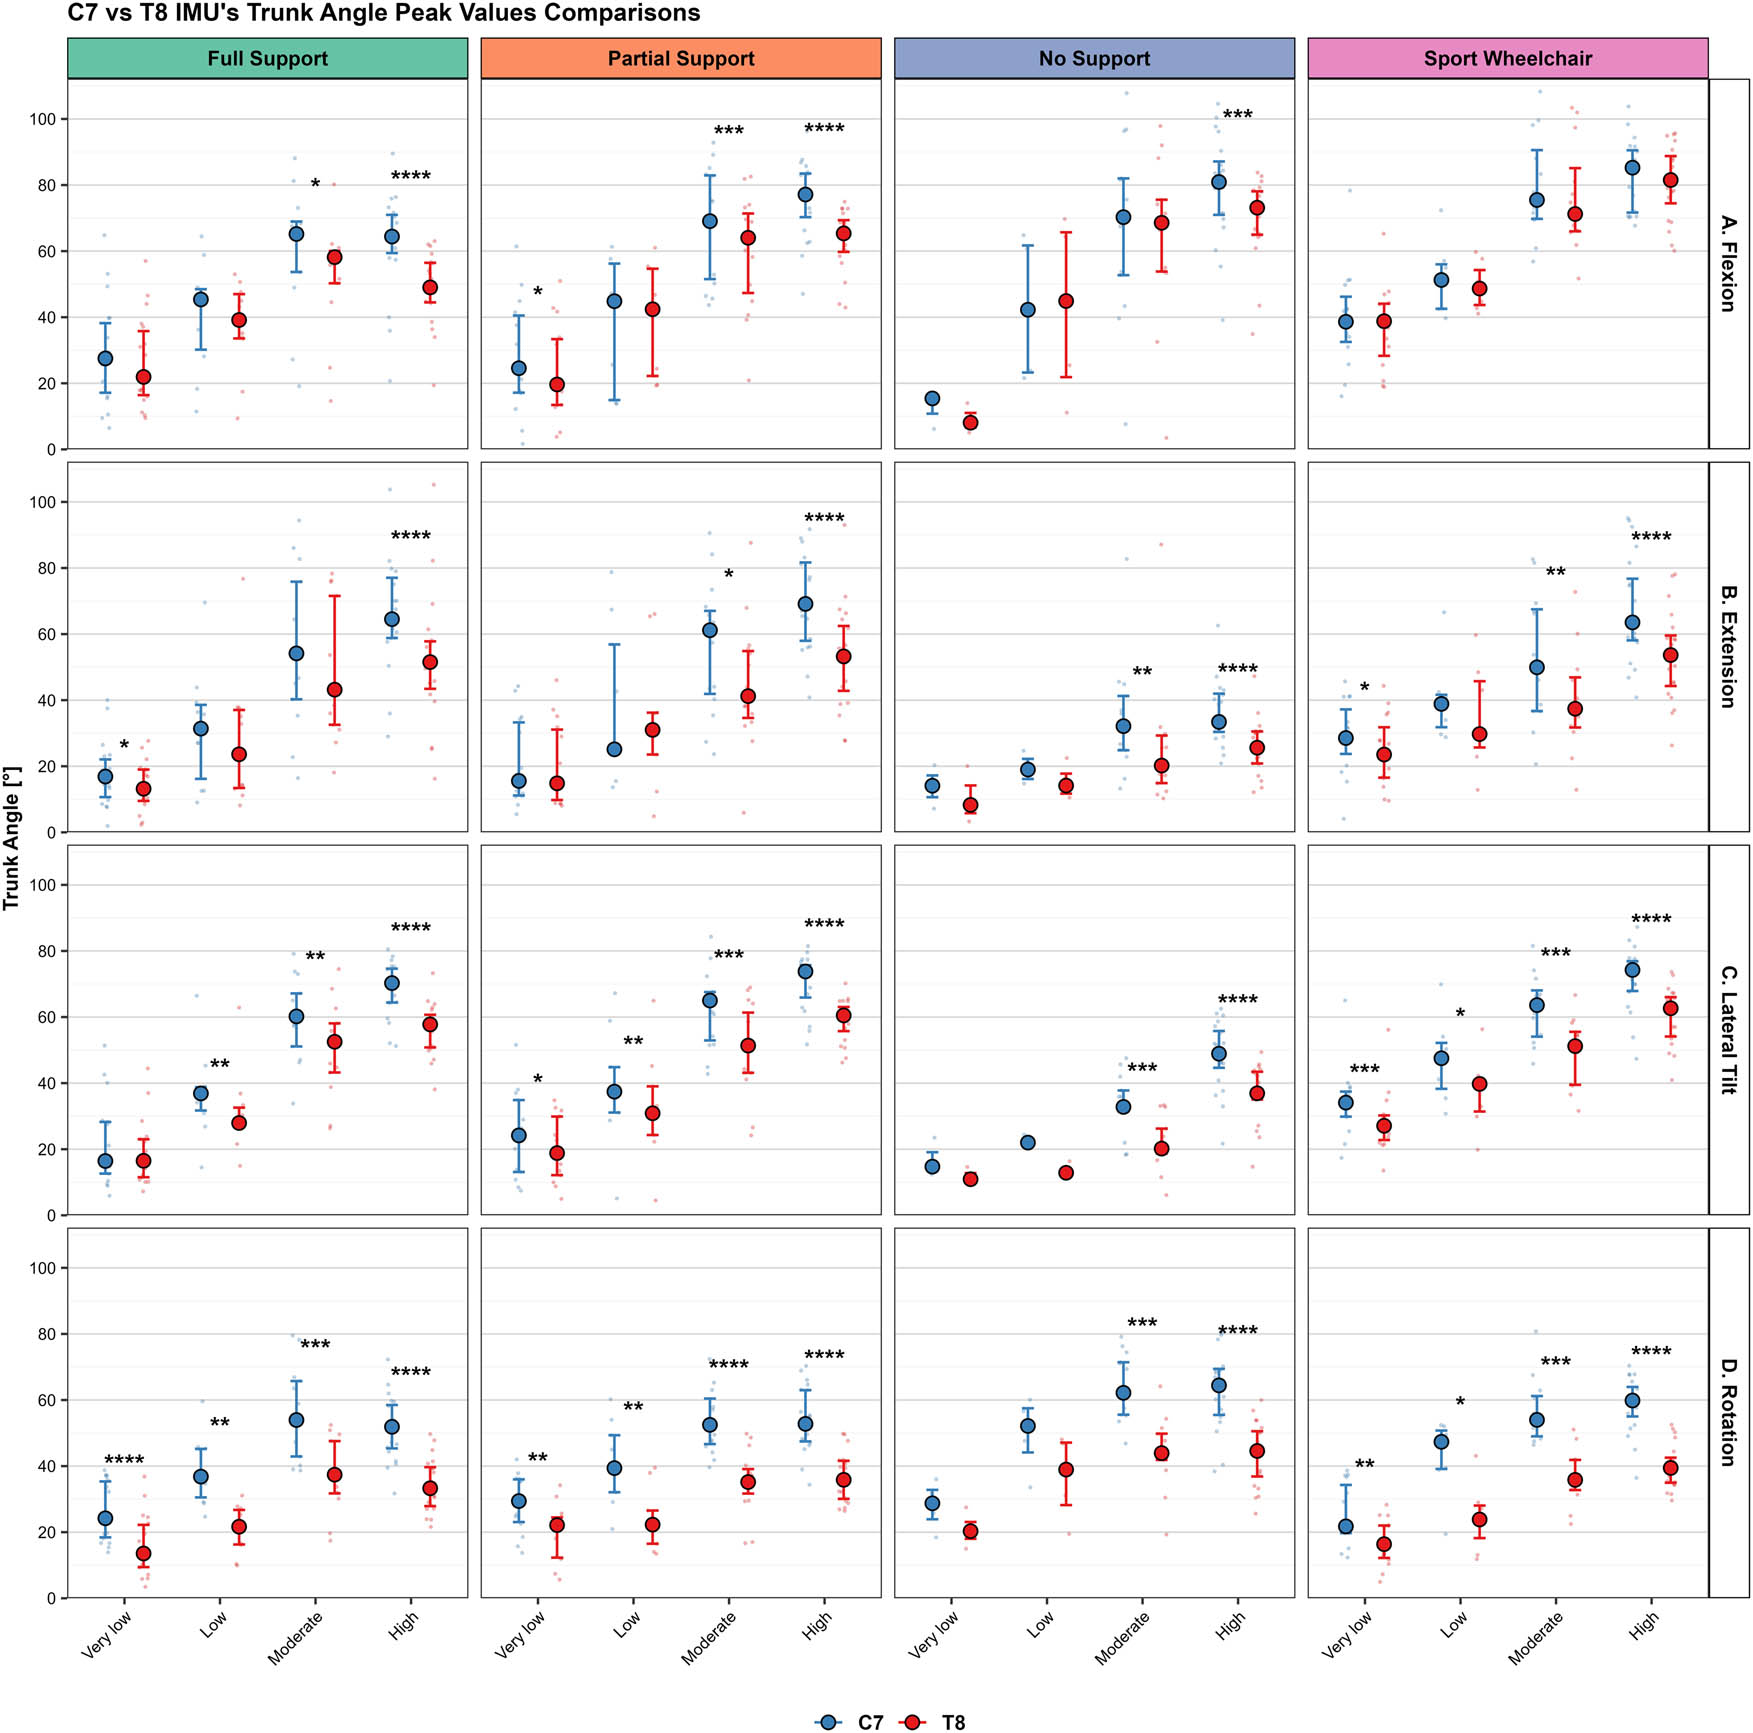
Figure 6
Comparison of trunk angle peak values measured by C7 and T8 IMUs across four ergonomic conditions and four Trunk Function Groups. All values are expressed as positive values. Blue and red filled circles (black outlines) represent median values for C7 and T8 measurements, respectively; error bars indicate the interquartile range. Semi-transparent points show individual participant data. Panel rows represent movement directions (A–D); columns represent ergonomic conditions. Wilcoxon Signed-Rank Test (* p < 0.05, ** p < 0.01, *** p < 0.001, **** p < 0.0001).
Significant differences between C7 and T8 measurements were found in 42 of 64 comparisons (66%). Rotation showed the largest differences (C7 > T8 by 8–20°, 14/16 significant), followed by lateral tilt (C7 > T8 by 4–14°, 13/16 significant). Flexion–extension differences were more selective: extension reached significance in 9 of 16 comparisons, predominantly in High and Moderate groups (10–18° and 8–12° respectively), while flexion differed in only 6 of 16, with no differences in the Sport Wheelchair condition across any Trunk Function group.
C7 and T8 IMU sensors discriminated equally between Trunk Function groups. All 32 Kruskal–Wallis tests showed group effects (4 movements × 4 conditions × 2 sensors; all p < 0.05). Post-hoc pairwise comparisons (6 per test) revealed that Very Low differed from the High group in 100% (C7) and 94% (T8) of comparisons, while differences between Very Low and Moderate were found in 81 and 75% of cases, respectively, and for Low versus High in 69 and 63%. Bordering groups rarely differed significantly. The only exceptions were Moderate versus High for lateral tilt in No Support (C7: p = 0.009; T8: p = 0.003), Low versus Moderate for rotation in Full Support (T8: p = 0.015), and Low versus Moderate for flexion in Partial Support (C7: p = 0.027).
C7–T8 angular difference discriminated between Trunk Function groups (Figure 7), with post-hoc analysis confirming significant pairwise differences across ergonomic conditions. Mean differences between extreme function groups (Very low vs High) were 10.4° for flexion, 12.8° for extension, 7.2° for lateral tilt, and 9.8° for rotation.
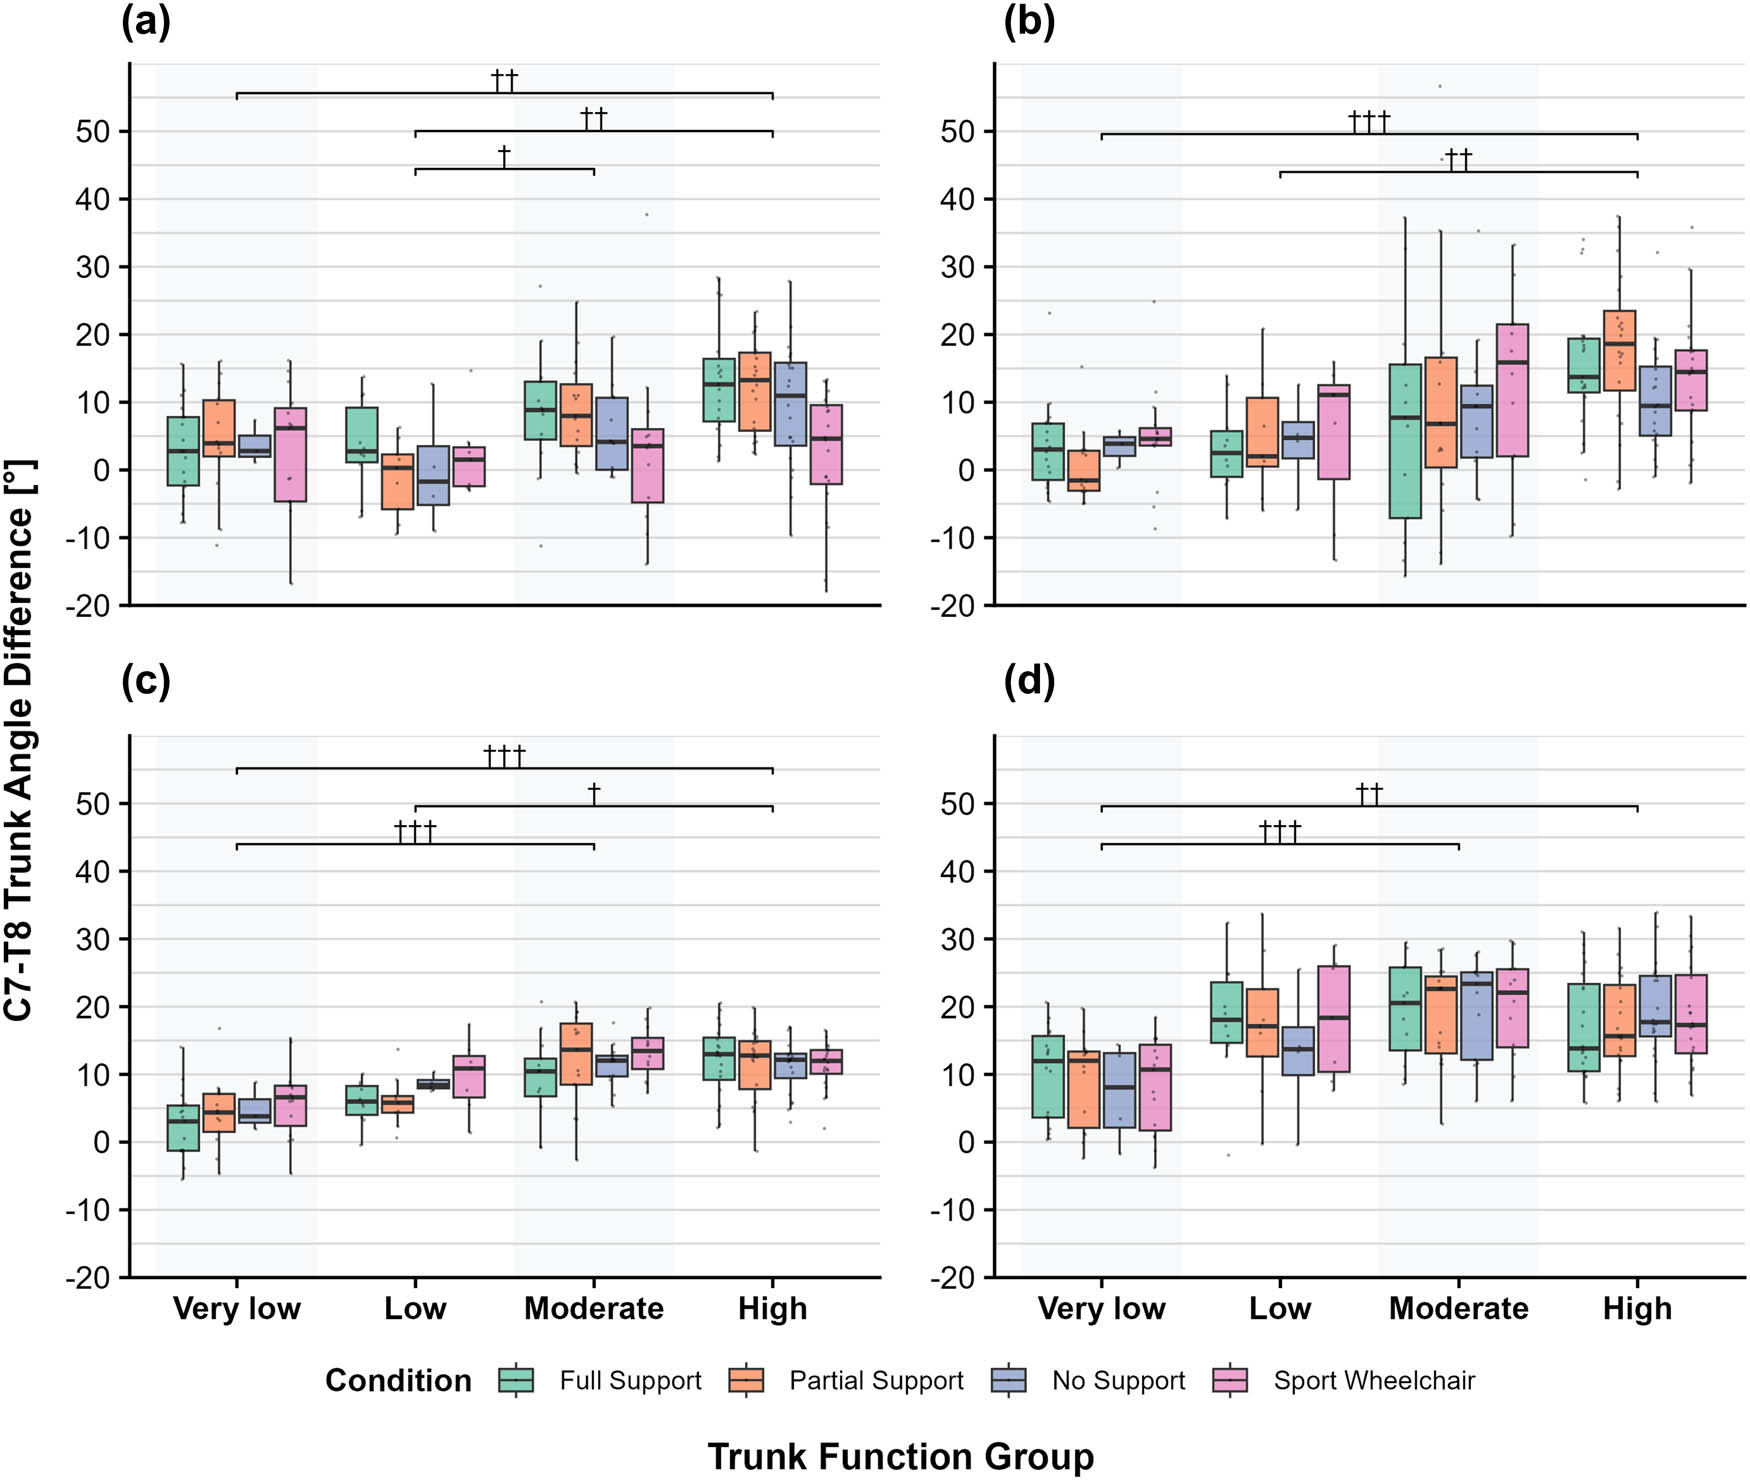
Figure 7
C7–T8 angular difference across trunk function groups and support conditions for (a) flexion, (b) extension, (c) lateral tilt, and (d) rotation. Box plots show median (centre line), interquartile range (box boundaries), and range (whiskers). Brackets indicate significant post-hoc pairwise differences (Wilcoxon test, Bonferroni corrected). Daggers denote the number of ergonomic conditions reaching significance: † = 1, †† = 2, ††† = 3.
For sagittal plane movements, group differences were shown primarily in the supported conditions. In Full Support and Partial Support, the High group produced 8–20° larger angular differences than Very Low and Low groups (flexion: p = 0.001–0.050; extension: p < 0.001–0.035). In Partial Support, the Moderate group exceeded the Low group by 8° for flexion (p = 0.021). Sport Wheelchair showed differences only for extension (χ 2 = 8.36, p = 0.039), where High exceeded Very Low by 10° (p = 0.029). No Support showed no group differences.
Lateral tilt showed the most consistent pattern, with overall group effects across all four conditions (p < 0.001 to p = 0.049). The Moderate group differed from Very Low group by 7–9° for Full Support (p = 0.012), Partial Support (p = 0.030), and Sport Wheelchair (p = 0.006). High group exceeded the Very Low group by 5–10° across these conditions (p < 0.001–0.017) and exceeded the Low group by 7° in the Full Support condition (p = 0.031). Despite an overall effect in No Support (χ² = 7.85, p = 0.049), no pairwise differences remained after correction.
Rotation showed Moderate exceeded Very Low in Full Support by 9–11° (p = 0.029), Partial Support (p = 0.019), and Sport Wheelchair (p = 0.016). High exceeded Very Low by 4–10° in Partial Support (p = 0.032) and Sport Wheelchair (p = 0.007). No Support showed no group differences (χ 2 = 6.58, p = 0.087).
These patterns indicate that athletes with higher trunk function generate greater relative motion between upper and mid trunk segments, while the Very Low group demonstrates minimal inter-segmental differences.
C7 and T8 Total ROM measurements showed a strong positive correlation (Spearman’s ρ = 0.974, p < 0.001; Figure 8).
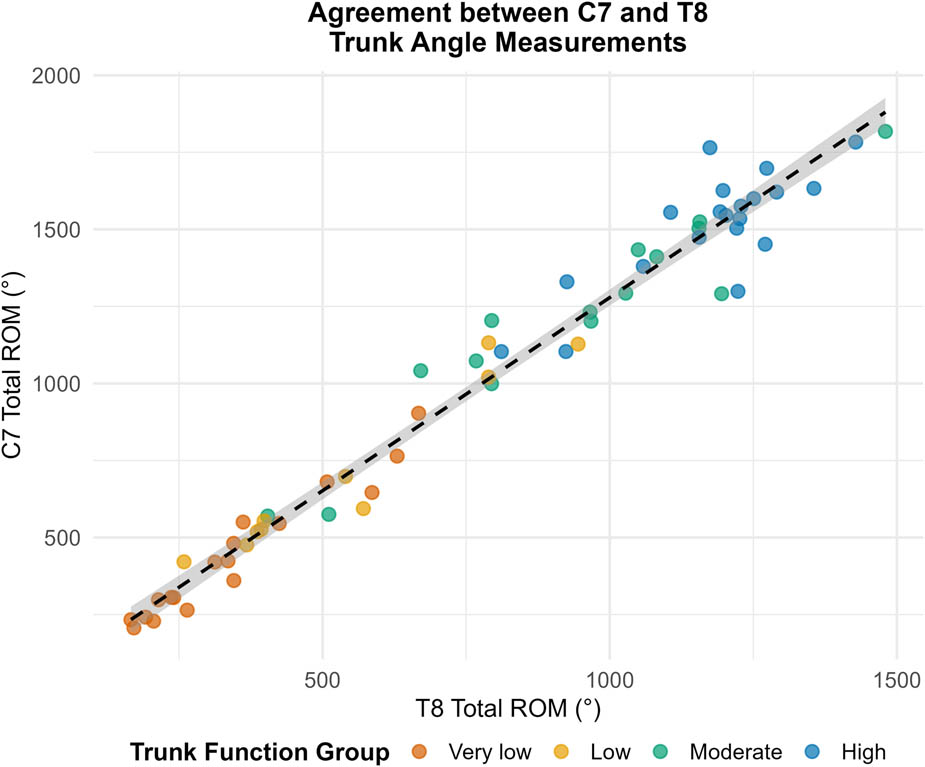
Figure 8
Scatterplot of Total ROM of the C7 sensor to the T8 sensor across all directions and conditions. Total ROM represents the cumulative sum of peak angles calculated for each participant across all three planes of motion (flexion/extension, lateral tilt, rotation) and four ergonomic conditions. Data points are coloured according to the Trunk Function groups (Very Low-orange, Low-yellow, Moderate-green, and High-blue). The dashed line represents the linear regression.
C7 and T8 measurements correlated strongly across all movements (all p < 0.001, Table 2). Lateral tilt showed the largest correlation (ρ = 0.926–0.965), followed by flexion (ρ = 0.888–0.944), extension (ρ = 0.718–0.914), and rotation (ρ = 0.790–0.840). Correlation was lowest in the No Support condition, particularly for extension (ρ = 0.718).
4. Discussion
This study indicates that a single C7 sensor provides sufficient information to distinguish trunk function levels in wheelchair basketball classification. Both C7 and T8 sensors differentiated most trunk function group pairs during VoA tasks, while inter-segmental differences between these positions added limited classification value. Angular differences between extreme trunk function groups averaged 10° (range: 4–20°, Figure 7).
Total active range of motion at C7 and T8 separated groups consistently. Removal of external support eliminated inter-segmental flexion/extension differences between groups. Three movement-condition combinations distinguished bordering groups: lateral tilt in No Support (both sensors), rotation in Full Support (T8), and flexion in Partial Support (C7). Marszałek and Molik [8] achieved 76.9% correct classification using flexion and rotation measurements. Shimoyama et al. [9] demonstrated that standardised testing conditions improved class separation by eliminating external support.
Athletes with higher trunk function showed larger angular differences between C7 and T8 during VoA tasks, consistent with preserved multi-segmental control [25]. Athletes with severe trunk impairment adopt a single-block strategy where the trunk moves as a unified, stiff unit [26]; in such cases, C7 captures the overall spine mobility regardless of inter-segmental differences. In isolated trials, T8 motion exceeded C7 motion in these lower function groups (Figure 7), possibly reflecting compensatory neck muscle recruitment when trunk function is absent [27,28].
Despite these patterns, the practical classification value remains limited. The average difference between extreme function groups reached only 10° across all movement planes. Group differences appeared in only 23% of pairwise comparisons, with adjacent groups rarely reaching significance. IMU measurement error (1–3°) may account for a substantial portion of this 10° difference. In dynamic sport contexts, where athletes execute movements with varying speed and amplitude, this margin proves insufficient for classification. The T8 > C7 pattern, though potentially informative about compensatory strategies, occurred infrequently. If this pattern reflects neck muscle recruitment, a head-mounted IMU could capture the compensatory kinematics more directly.
Trunk function, while an important predictor of sport class in wheelchair basketball, is not the sole parameter determining class allocation. The proposed objective measurements are intended to support – not replace – the expert assessment of trained classifiers. Previous research by Altmann et al. [29] confirmed that the current classification system demonstrates adequate inter-rater reliability (Kappa: > 0.75). The experienced eye of classifiers integrates multiple factors that instrumentation cannot fully capture, including movement quality, sport-specific skills, and the complex interaction between impairment and performance. Instrumentation serves as one tool among many that may assist classifiers in their evaluation process, especially in the context of convoluted functional profiles [3].
A strength of this study is the use of standardised MMT protocols and hierarchical cluster analysis to establish trunk function groups based on direct impairment assessment rather than classification points alone. This methodological approach ensures reliable grouping of athletes by trunk–hip function and captures trunk impairment independent of associated disabilities. Both C7 and T8 sensors separated these groups consistently, confirming that field-deployable IMU technology can provide relevant trunk assessment grounded in objective functional measurement.
This study has several limitations. The analysis included only peak trunk angles during VoA tasks, which does not capture the full kinematic profile that methods using complete movement curves could provide. Missing data and the limited sample size required conservative statistical approaches, possibly obscuring additional findings. Individual wheelchair configurations were not controlled for, which may have introduced variability in the sport wheelchair condition. The T8 sensor position cannot distinguish lumbar from thoracic movement, which may be relevant for certain classification decisions. Additionally, although IMU-based trunk measurements have been validated against optoelectronic systems in previous research [14,16], the sensitivity of inter-segmental measurements in this specific population requires validation against optical motion capture systems. Future studies should include larger samples and explore full kinematic curve analysis to better characterise inter-segmental temporal and spatial kinematics patterns.
5. Conclusions
For field-based trunk function assessment, a single C7 sensor represents a preferable placement compared to the T8 sensor. C7 captures whole-spine movement patterns relevant to sport-specific tasks such as wheelchair propulsion. The high correlation between C7 and T8 measurements (ρ = 0.974), combined with mean inter-segmental differences of only 10° suggests that a single sensor provides sufficient information about trunk angular movement.
Acknowledgments
The authors gratefully acknowledge the athletes who participated in this study.
Funding information
This work was supported by the Knowledge Foundation (KK-stiftelsen) through the Synergy project coordinated by the Swedish School of Sport and Health Sciences (GIH), Stockholm, Sweden (agreement no. 20220080-H-01). The publication of this article was supported by the Prof. A. Morecki and Prof. K. Fidelus Award of the Polish Society of Biomechanics for young scientists (1st place, Biomechanics 2025 International Conference, Kochcice, Poland), received by the first author
Author contributions
Preparation of the research program: K.C., E.D., M.L.O., A.B., Y.V. Execution of the research: all authors. Statistical analysis: K.C. Interpretation of data: K.C., M.B., E.D. Preparation of the manuscript: all authors. Obtaining financing: M.L.O., A.B., Y.V.
Conflict of interest statement
Authors state no conflict of interest.
Data availability statement
Data are available from the corresponding author on request.
Declaration on the use of generative AI
During the preparation of this work, the authors used Gemini 3 Pro Image (Google DeepMind; gemini.google.com) to generate initial reference images for Figures 1 and 2. The authors then edited, redrew, and composed the illustrations in Affinity (https://affinity.serif.com/) to ensure anatomical accuracy and alignment with the content. Final bitmaps were converted to vector format using Vectorizer.ai (https://vectorizer.ai/), and vector text labels and annotations were added in Inkscape (https://inkscape.org/). The authors reviewed and verified all figures and take full responsibility for their content.