
1. Introduction
The smash is widely considered one of the most decisive offensive techniques in badminton, a primary means of breaking through the opponent’s defense and creating direct scoring opportunities. Given the extremely light weight and high speed of the shuttlecock, the ability to deliver a powerful and accurate smash is crucial for controlling the rally and the pace of the game [1]. A high-quality smash – characterized by greater speed, accuracy, and consistency – forces the opponent into a passive position, allowing the athlete to convert tactical advantages into winning points [2,3]. With the increasingly fast pace and power-based nature of modern badminton matches, improving smash ability has become a core focus of competitive training [2].
Core strength training is increasingly valued in various sports due to its important role in stabilizing the torso, improving kinetic chain efficiency, and promoting effective power transfer from the lower limbs to the upper limbs [4,5]. Currently, core training has been proven to improve performance in various sports, such as football, handball, basketball, swimming, dance, karate, Muay Thai, gymnastics, and so on [6]. Although these findings suggest that core muscles play a crucial role in enhancing athletic performance, empirical studies specifically investigating their contribution to badminton performance, particularly smashes, remain limited.
This research gap is particularly prominent in the context of the development of badminton in China. As shown in Figure 1, data were collected on the performance of provincial badminton teams in the National Games of the People’s Republic of China to understand the reasons for the decline in the performance of the Chinese national badminton team. Figure 1 shows that athletes from Guangxi Province performed worse than their peers from other stronger provinces. Currently, China is committed to training a large number of female university students to become professional athletes, making the training of female athletes a key focus. However, compared to male athletes, female athletes often suffer from insufficient physical training, particularly in trunk stability and neuromuscular coordination, which is considered a potential cause of this performance gap. To date, however, no research has systematically evaluated whether structured core strength training programs can effectively improve the smash performance of female badminton players in this region.
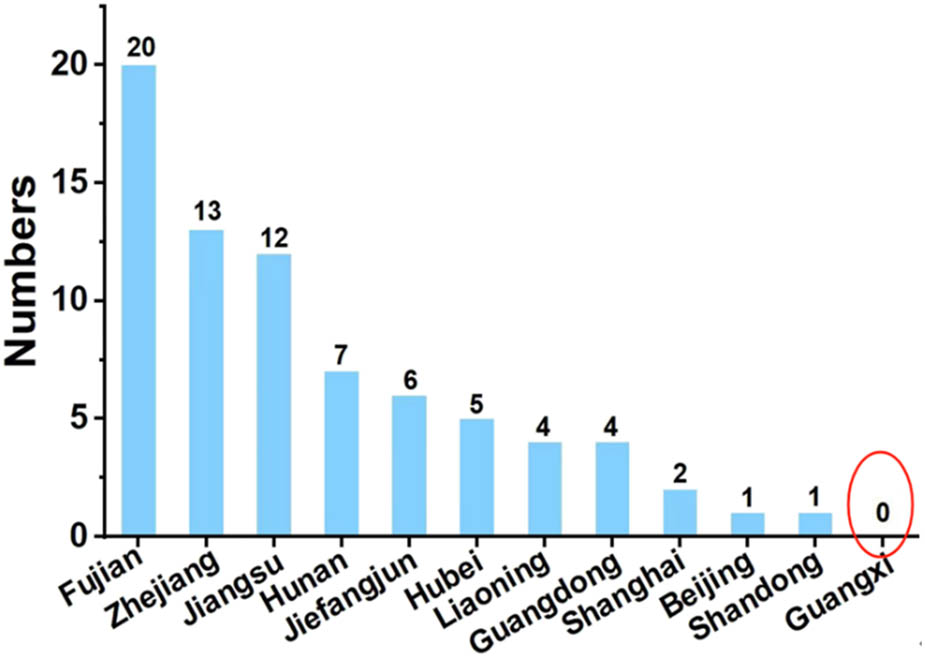
Figure 1
Achievements of provincial badminton teams in China.
Therefore, the aim of this study is to investigate the impact of an 8-week core strength training program on smash accuracy in female competitive badminton players in Guangxi. Participants were randomly assigned to either the core training group or the control group, which continued with standard training. We hypothesized that athletes receiving core strength intervention would show a significant improvement in smash accuracy compared to athletes who only underwent standard training.
2. Methods
2.1. Research design
This study employed a pretest-posttest experimental design, conducted as a cluster randomized controlled trial (cRCT). cRCTs are a type of randomized trial involving a population or community [7] widely used in research on competitive sports training. Researchers registered an account on ClinicalTrials.gov and obtained prior authorization (approval number: NCT06219070). To investigate the difference in effectiveness between core training and conventional training in badminton players’ smash-specific training, researchers used a fishbowl sampling method to randomly select 2 universities from the 15 universities in Guilin, the city with the most universities in Guangxi, as research subjects: the badminton teams of Guilin University of Technology and Guangxi Normal University. The subjects were randomly divided into two groups: an experimental group (EG, receiving core training) and a control group (CG, continuing conventional training).
The dependent variable in this study was the smash performance of badminton players, and the independent variable was core training. Both the EG and CG received the same technical training; the CG received a standard training regimen, while the EG received core training (refer Appendix B, Table A3). The study lasted 8 weeks, with training three times a week for 1 h each time. During the intervention period, the dependent variable was measured three times: before intervention (baseline), post-intervention 1 (4 weeks later), and post-intervention 2 (8 weeks later). The specific research framework is shown in Figure 2.
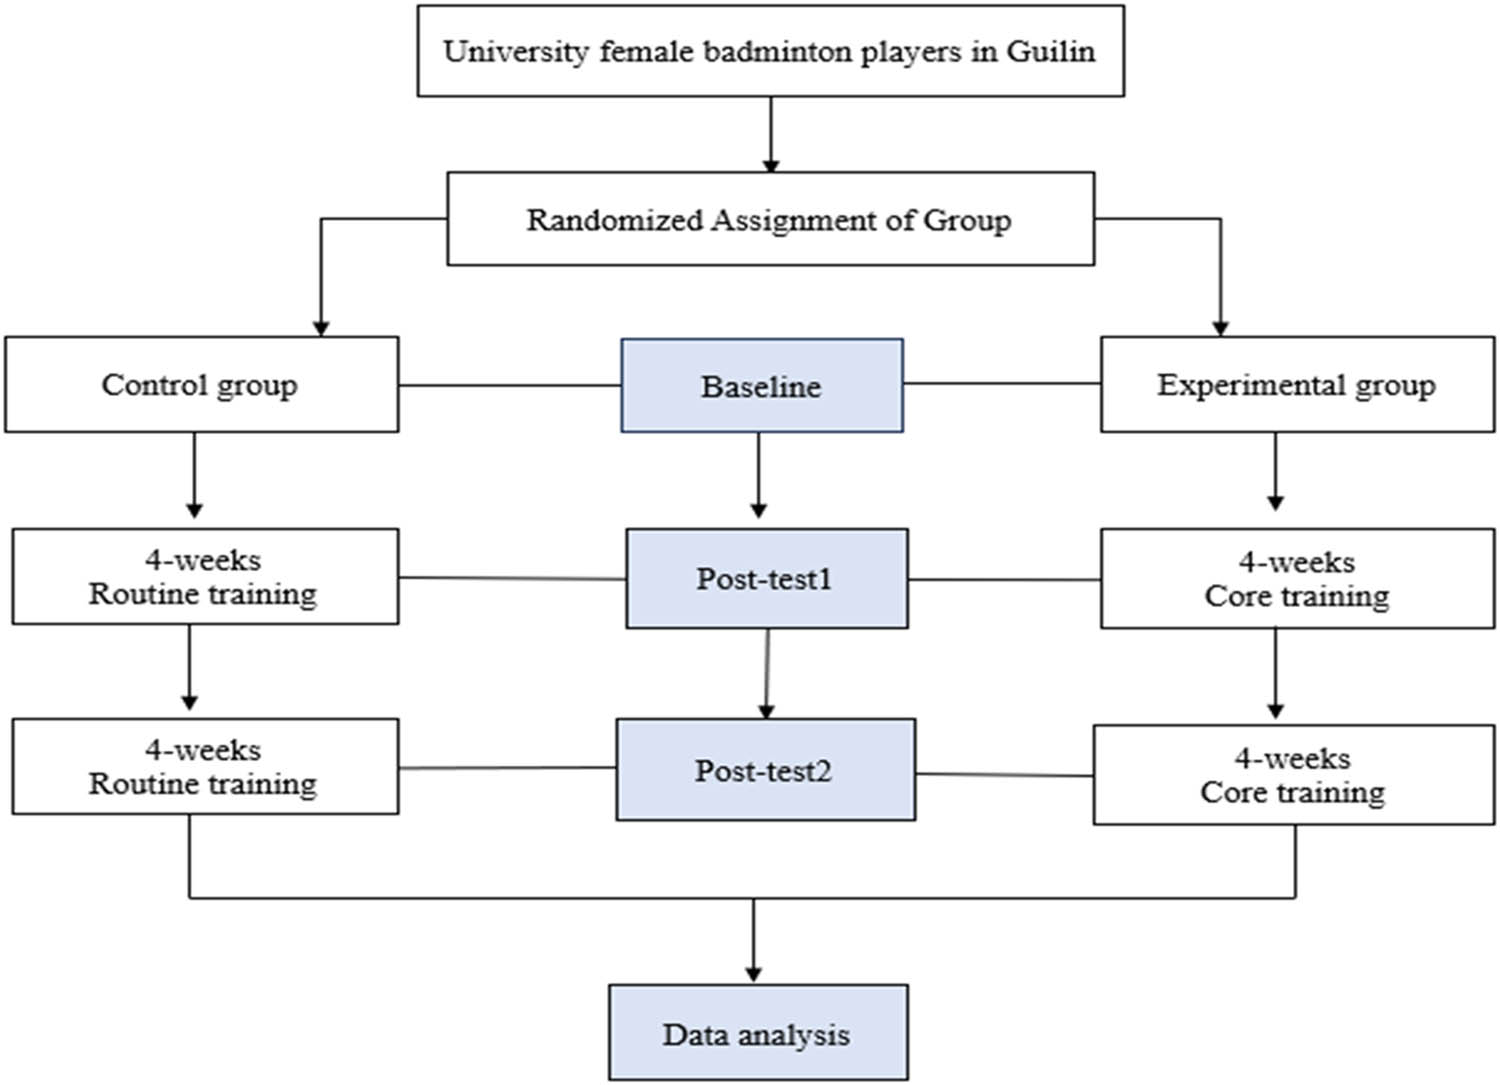
Figure 2
Research framework.
2.2. Participants
First, this study used G*Power 3.1.9.7 software to estimate the prior sample size based on the effect sizes reported in previous studies on core strength interventions in racket sports [8,9]. Assuming an effect size of f = 0.23, a significance level of α = 0.05, and a statistical power of 0.80, the minimum required sample size was calculated to be 36.8 participants. Considering an expected dropout rate of 20%, the target sample size was set at 46 athletes.
Of the 58 female badminton players initially screened, 46 met the inclusion and exclusion criteria. At baseline, three athletes from each group withdrew due to injury and were excluded from the intervention group. Ultimately, 40 athletes completed the study and were included in the final analysis, with 20 assigned to the core training group and 20 to the CG.
All participants signed written informed consent forms, and this study protocol was approved by the Ethics Committee of Guangxi Normal University (Approval No. 20230805001).
2.3. Randomization
Participants were randomly assigned to either the Core Strength Training Group (n = 20) or the CG (n = 20) using a computer-generated random sequence. The assignments were kept confidential by an independent researcher not involved in the testing or training. Coaches and athletes were only informed of their assignments after baseline measurements were completed.
2.4. Instruments
This study measured the accuracy of badminton players’ smashes in in situ, jump smashes, and moving smashes. The instruments used to calculate these technical indicators are detailed in Table 1.
Table 1
Instruments used to measure smash performance
| Variables | Measurement method | Instrument | Unit | Reference |
|---|---|---|---|---|
| In situ smash accuracy | Ball placement test | Colored string | Count | [10,11] |
| Jump smash accuracy | Ball placement test | Leopard smart shuttlecock throwing machine | ||
| Move smash accuracy | Ball placement test |
Source: From Ref. [11].
2.5. Reliability and validity
Ensuring the validity of data collection methods in a study is crucial [12]. In this study, the face validity and content validity of these methods were evaluated by an expert panel. Face validity was established after the research tools were finalized. A panel of six badminton experts reviewed these tools and provided evaluation results (details of the experts are provided in Appendix A). The result shows that all tools used in this study had demonstrated good validity in previous studies.
Furthermore, this study used the Item content validity index (I-CVI) for statistical analysis of content validity. The Kappa correction coefficient was used to assess the relevance of the I-CVI [13]. This study followed the I-CVI criteria proposed by Lynn (1986) (I-CVI = 1 with 3–5 experts, and at least 0.78 with 6–10 experts) and Fleiss’s criteria, where a Kappa value above 0.75 was considered excellent, 0.40–0.75 was good, and below 0.40 was poor [14,15]. Items with an I-CVI value below 0.78 were revised or deleted based on expert feedback.
All items demonstrated acceptable content validity indices, as shown in Table 2. The relevant indices are as follows: Spike performance: I-CVI = 0.833–1.000, Kappa = 0.816–1.000. Similarly, all items met the acceptable clarity thresholds (Spiking performance: I-CVI = 1.000, Kappa = 1.000). Therefore, this test scheme exhibits good content validity.
Table 2
Validity of smash performance instruments
| Item | Measurement method | Number of agreements | Relevance | Number of agreements | Relevance | ||
|---|---|---|---|---|---|---|---|
| I-CVI | Kappa | I-CVI | Kappa | ||||
| In situ smash accuracy | Ball placement test | 5 | 0.833 | 0.816 | 6 | 1.000 | 1.000 |
| Jump smash accuracy | Ball placement test | 5 | 0.833 | 0.816 | 6 | 1.000 | 1.000 |
| Move smash accuracy | Ball placement test | 5 | 0.833 | 0.816 | 6 | 1.000 | 1.000 |
In this study, researchers used a test-retest method to determine the reliability of the dependent variable (smash performance). According to Fleiss’s classification, a intraclass correlation coefficient value above 0.75 indicates “excellent” reliability, an ICC value between 0.40 and 0.75 indicates “good” reliability, and an ICC value below 0.40 indicates “poor” reliability [16]. The ICC values for the selected smash performance components ranged from 0.762 to 0.807, indicating that the assessment of smash skills in female badminton players in this study had high reliability (refer Table 3 for details).
Table 3
Test-retest reliability of smash performance instruments (n = 40)
| Variables | Measurement method | Intraclass correlation coefficient | 95% confidence interval (CI) | |
|---|---|---|---|---|
| Lower bound | Upper bound | |||
| In situ smash accuracy | Ball placement test | 0.771 | 0.569 | 0.878 |
| Jump smash accuracy | Ball placement test | 0.762 | 0.552 | 0.874 |
| Move smash accuracy | Ball placement test | 0.807 | 0.637 | 0.898 |
2.6. Intervention measures
The data in this study were obtained from field testing rather than laboratory testing, thus exhibiting higher exercise specificity. To ensure the validity of the results, external variables such as environment, participant condition, pre-competition preparation, and testing procedures needed to be controlled. Participants and coaches should strictly adhere to standardized training and testing procedures to obtain accurate test results. During training, the quality, frequency, and rest intervals of each training movement should be strictly controlled. During testing, staff should set up and check the equipment in advance and strictly regulate the order of physical fitness and spiking performance tests, as well as the recovery time between tests. In addition, potential covariates that might interfere with core strength, such as training time, age, height, and weight, were tested, and their potential influence was excluded from the statistical analysis.
2.7. Testing procedure
Two weeks prior to the test, participants received training on the testing procedure to minimize the learning effect. The study consisted of three phases: a baseline phase where pretest data were collected and core training and the testing procedure were introduced; an intervention phase where training was supervised by coaches, culminating in the first posttest (posttest1) in week 4; and a post-intervention phase where the second posttest (posttest2) was conducted in week 8. All data were subsequently processed for analysis.
2.8. Data analysis
This study collected participant data before and after the intervention and performed statistical analysis using SPSS 30.0, with a significance level set at p < 0.05. The analysis included two parts: descriptive statistics to present demographic characteristics and inferential statistics for hypothesis testing. To assess the impact of the intervention on smash performance, the generalized estimating equations (GEE) were used to analyze repeated measures data [17]. Data analysis determined whether core training had a significant impact on the smash performance of female badminton players. Significant differences were found between the control and EGs in in situ smash accuracy, jumping smash accuracy, and moving smash accuracy at baseline, posttest 1, and posttest 2.
3. Results
3.1. Demographic analysis
Table 4 presents the basic demographic characteristics of the two groups of subjects. The results show that although there were mean differences between the CG and the EG in indicators such as age, height, weight, and training duration, these differences did not reach statistical significance (p > 0.05) as verified by the t-test. Therefore, the two groups can be considered to be well-comparable in terms of baseline characteristics, laying a reliable foundation for subsequent intervention effect analysis.
Table 4
Demographic characteristics
| Demographic characteristics | Group | Mean value | Std. deviation | t | p-value |
|---|---|---|---|---|---|
| Age | EG | 21.15 | 0.745 | −0.740 | 0.464 |
| CG | 21.40 | 1.314 | |||
| Height | EG | 167.25 | 3.998 | −1.298 | 0.127 |
| CG | 168.95 | 3.410 | |||
| Weight | EG | 57.85 | 4.815 | −1.131 | 0.190 |
| CG | 59.15 | 4.977 | |||
| Training time | EG | 9.65 | 1.954 | −0.564 | 0.576 |
| CG | 10.00 | 1.974 |
Note: EG, Experimental Group; CG, Control group.
3.2. Baseline situation
Before conducting data analysis, we assessed the assumption of intra-group homogeneity for all variables at baseline. Since all variables were normally distributed, we used an independent samples t-test as the baseline to assess homogeneity between the two groups in the deduction accuracy performance variable. The results showed no significant difference between the two groups in the deduction accuracy performance variable (p > 0.05), indicating homogeneity between the two groups at baseline. Table 5 provides a comparison of the mean values between the two groups.
Table 5
Comparing between groups for smash accuracy performance variables at baseline
| Variable | Group | Mean value | Std. deviation | t | p-value |
|---|---|---|---|---|---|
| In situ smash accuracy | EG | 0.68 | 0.125 | 1.021 | 0.314 |
| CG | 0.64 | 0.123 | |||
| Jump smash accuracy | EG | 0.68 | 0.064 | −0.324 | 0.748 |
| CG | 0.69 | 0.123 | |||
| Move smash accuracy | EG | 0.73 | 0.092 | 0.277 | 0.783 |
| CG | 0.72 | 0.132 |
Note: EG, Experimental group; CG, Control group.
3.3. Impact of core training on smash accuracy
3.3.1. In situ smash accuracy
The first aspect of smash accuracy is in situ smash accuracy. The impact of core training intervention on in situ smash accuracy was observed through a multi-stage fitness test. Specific descriptive data are shown in Table 6.
Table 6
Descriptive statistics of in situ smash accuracy between groups across the time
| Variable | Group | Baseline | Posttest1 | Posttest2 | |||
|---|---|---|---|---|---|---|---|
| Mean value | Std. deviation | Mean value | Std. deviation | Mean value | Std. deviation | ||
| In situ smash accuracy | EG | 0.68 | 0.125 | 0.70 | 0.103 | 0.84 | 0.067 |
| CG | 0.64 | 0.123 | 0.69 | 0.121 | 0.71 | 0.105 | |
Note: EG, Experimental group; CG, Control group.
Table 7 presents the results of the in situ kill accuracy analysis based on the GEE. First, the main effect of group was significant (χ 2 = 4.154, p < 0.05), indicating a statistically significant difference in overall kill accuracy between the EG and the CG. Second, the main effect of time was also significant (χ 2 = 61.997, p < 0.001), indicating a significant change in in situ kill accuracy among the three measurements. Furthermore, the interaction effect of group × time was significant (χ 2 = 11.933, p < 0.05), showing that the trends of change over time differed between the EG and CG, indicating that the improvement brought by core training is time-dependent.
Table 7
Results of GEE on in situ smash accuracy score
| Variable | Source | Wald chi-square | df | p-value |
|---|---|---|---|---|
| In situ smash accuracy | Group | 4.154 | 1 | <0.05 |
| Time | 61.997 | 2 | <0.001 | |
| Group * Time | 11.933 | 2 | <0.05 | |
| Age♦ | 0.01 | 1 | 0.919 | |
| Training time♦ | 0.005 | 1 | 0.943 | |
| Height♦ | 0.073 | 1 | 0.787 | |
| Weight♦ | 0.003 | 1 | 0.958 |
Note: df, degrees of freedom; ♦, covariates.
Regarding covariates, age (χ 2 = 0.010, p = 0.919), years of training (χ 2 = 0.005, p = 0.943), height (χ 2 = 0.073, p = 0.787), and weight (χ 2 = 0.003, p = 0.958) were not statistically significant, indicating that these variables had no significant impact on the accuracy of in situ smashes.
This study used the Bonferroni correction method to examine the differences in smash accuracy between two groups of young female badminton players at three time points. Results showed that the EG showed significant improvements in Posttest2 compared to Posttest1 and baseline (mean differences of 0.135 and 0.16, respectively, p < 0.05), while there was no significant difference between Posttest1 and baseline (p > 0.05). In the CG, there were significant differences between Posttest2 and baseline, and between Posttest1 and baseline (mean differences of 0.07 and 0.055, respectively, p < 0.05), but no statistically significant difference between Posttest2 and Posttest1 (p > 0.05). Effect size further indicated that the time effect was more pronounced in the EG (d = 1.595), significantly greater than that in the CG (d = 0.612), suggesting that core strength training has a stronger promoting effect on improving smash accuracy (Table 8).
Table 8
Within groups comparison of in situ smash accuracy mean scores across the time for different groups
| Variable | Group | (I) time | (J) time | Mean difference (I–J) | SE | p-value | 95% CI for difference | Effect size (d) | |
|---|---|---|---|---|---|---|---|---|---|
| Lower | Upper | ||||||||
| In situ smash accuracy | EG | Posttest2 | Posttest1 | 0.1350* | 0.015 | 0.000 | 0.100 | 0.170 | 1.595 |
| Posttest2 | Baseline | 0.1600* | 0.016 | 0.000 | 0.121 | 0.199 | |||
| Posttest1 | Baseline | 0.0250 | 0.017 | 0.434 | −0.016 | 0.066 | |||
| CG | Posttest2 | Posttest1 | 0.0150 | 0.022 | 1.000 | −0.037 | 0.067 | 0.612 | |
| Posttest2 | Baseline | 0.0700* | 0.026 | 0.019 | 0.009 | 0.131 | |||
| Posttest1 | Baseline | 0.0550* | 0.022 | 0.035 | 0.003 | 0.107 | |||
Note: *, the mean difference is significant at 0.05 level; EG, Experimental group; CG, Control group; SE, Standard error.
Bonferroni correction was used to compare the seated striking accuracy of the two groups of subjects at baseline, posttest 1, and posttest 2 (Table 9). The results showed that there were no significant differences between the two groups at baseline and posttest 1 (mean differences were 0.04 and 0.01, respectively, p > 0.05), but significant differences were observed at posttest 2 (mean difference = 0.13, p < 0.05). Further effect size calculation showed that the seated striking accuracy had the largest effect at posttest 2 (d = 1.476), significantly higher than posttest 1 (d = 0.089) and baseline (d = 0.323), indicating that the training effect gradually increased over time and reached its most significant level in the later stage.
Table 9
Between groups comparison of mean score for in situ smash accuracy at three different times
| Variable | Time | Mean difference (EG–CG) | SE | p-value | 95% CI for difference | Effect size (d) | |
|---|---|---|---|---|---|---|---|
| Lower | Upper | ||||||
| In situ smash accuracy | Baseline | 0.040 | 0.03818 | 0.295 | −0.0348 | 0.1148 | 0.323 |
| Posttest1 | 0.010 | 0.03457 | 0.772 | −0−0578 | 0.0778 | 0.089 | |
| Posttest2 | 0.130* | 0.02716 | 0.000 | 0.0768 | 0.1832 | 1.476 | |
Note: *, the mean difference is significant at 0.05 level; EG, Experimental group; CG, Control group; SE, Standard error.
Figure 3 shows the average score of in situ spiking accuracy at different time points. Under the core training intervention, the EG had a higher average score than the CG at all three different time points (baseline, posttest 1, and posttest 2).
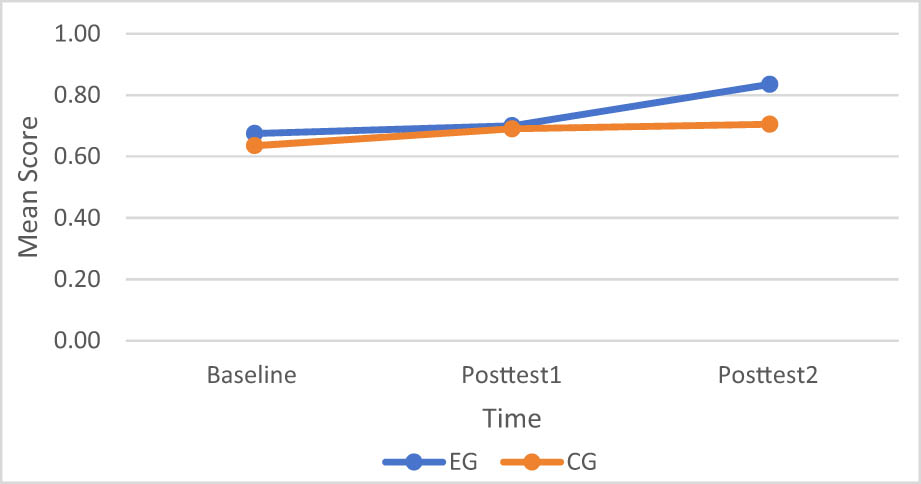
Figure 3
The mean score of in situ smash accuracy across time for both groups.
3.3.2. Jump smash accuracy
The second aspect of spike accuracy is jump smash accuracy. The impact of core training intervention on jump smash accuracy was observed through multi-stage fitness tests, and the descriptive data are shown in Table 10.
Table 10
Descriptive statistics of jump smash accuracy between groups across the time
| Variable | Group | Baseline | Posttest1 | Posttest2 | |||
|---|---|---|---|---|---|---|---|
| Mean value | Std. deviation | Mean value | Std. deviation | Mean value | Std. deviation | ||
| Jump smash accuracy | EG | 0.68 | 0.064 | 0.72 | 0.083 | 0.84 | 0.060 |
| CG | 0.69 | 0.123 | 0.69 | 0.121 | 0.72 | 0.114 | |
Note: EG, Experimental group; CG, Control group.
Table 11 presents the GEE analysis results for jump smash accuracy. First, the between-group effect was significant (χ 2 = 5.359, p < 0.05), indicating a statistically significant difference in overall performance between the EG and the CG. Second, the time effect was also significant (χ 2 = 69.413, p < 0.001), indicating that jump smash accuracy changed significantly at all three measurement time points. Furthermore, the interaction effect between group and time was significant (χ 2 = 34.962, p < 0.001), meaning that the two groups showed different trends over time, with the EG showing a significantly greater improvement.
Table 11
Results of GEE on jump smash accuracy score
| Variable | Source | Wald chi-square | df | p-value |
|---|---|---|---|---|
| Jump smash accuracy | Group | 5.359 | 1 | <0.05 |
| Time | 69.413 | 2 | <0.001 | |
| Group * Time | 34.962 | 2 | <0.001 | |
| Age♦ | 0.303 | 1 | 0.582 | |
| Training time♦ | 1.536 | 1 | 0.215 | |
| Height♦ | 0.497 | 1 | 0.481 | |
| Weight♦ | 0.401 | 1 | 0.526 |
Note: df, degrees of freedom; ♦, covariates.
For covariates, age, years of training, height, and weight did not have a significant impact on jump smash accuracy. Specifically, age (χ 2 = 0.303, p = 0.582), training time (χ 2 = 1.536, p = 0.215), height (χ 2 = 0.497, p = 0.481), and weight (χ 2 = 0.401, p = 0.526) did not show statistical significance. This indicates that the changes in jump smash accuracy were mainly driven by intervention and time factors, rather than by the aforementioned individual difference variables.
This study used the Bonferroni correction method to compare the changes in jump smash accuracy at three time points between two groups of young female badminton players (Table 12). The results showed that the EG showed significant improvements at Posttest2 compared to Posttest1 (mean difference = 0.12, p < 0.05) and at baseline (mean difference = 0.165, p < 0.05), while there was no significant difference between Posttest1 and baseline (mean difference = 0.045, p > 0.05). The CG showed no statistically significant differences at any of the three time points. Effect size analysis further indicated that the EG had the largest time effect size in jump smash accuracy (d = 2.579), significantly higher than the CG (d = 0.253), suggesting that core strength training has a more significant effect on improving jump smash accuracy.
Table 12
Within groups comparison of jump smash accuracy mean scores across the time for different groups
| Variable | Group | (I) time | (J) time | Mean difference (I–J) | SE | p-value | 95% CI for difference | Effect size (d) | |
|---|---|---|---|---|---|---|---|---|---|
| Lower | Upper | ||||||||
| Jump smash accuracy | EG | Posttest2 | Posttest1 | 0.120* | 0.013 | 0.000 | 0.088 | 0.152 | 2.579 |
| Posttest2 | Baseline | 0.165* | 0.016 | 0.000 | 0.126 | 0.204 | |||
| Posttest1 | Baseline | 0.045 | 0.019 | 0.060 | −0.001 | 0.091 | |||
| CG | Posttest2 | Posttest1 | 0.025 | 0.024 | 0.915 | −0.033 | 0.083 | 0.253 | |
| Posttest2 | Baseline | 0.030 | 0.020 | 0.408 | −0.018 | 0.078 | |||
| Posttest1 | Baseline | 0.005 | 0.027 | 1.000 | −0.059 | 0.069 | |||
Note: *, the mean difference is significant at 0.05 level; EG, Experimental Group; CG, Control group; SE, Standard Error.
Bonferroni correction was used to compare the jump smash accuracy of the two groups at baseline, posttest 1, and posttest 2 (Table 13). The results showed that there were no significant differences in the mean value between the EG and the CG at baseline and posttest 1 (baseline: mean difference = –0.01; posttest 1: mean difference = 0.03; both p > 0.05), but the difference between the two groups reached statistical significance at posttest 2 (mean difference = 0.125, p < 0.05). Effect size analysis further showed that the between-group effect size of jump smash accuracy was largest at posttest 2 (d = 1.317), followed by baseline (d = 0.102), and smallest at posttest 1 (d = 0.096).
Table 13
Between groups comparison of mean score for jump smash accuracy at three different times
| Variable | Time | Mean difference (EG–CG) | SE | p-value | 95% CI for difference | Effect size (d) | |
|---|---|---|---|---|---|---|---|
| Lower | Upper | ||||||
| Jump smash accuracy | Baseline | −0.010 | 0.030 | 0.740 | −0.069 | 0.049 | 0.102 |
| Posttest1 | 0.030 | 0.032 | 0.349 | −0.033 | 0.093 | 0.096 | |
| Posttest2 | 0.125* | 0.028 | 0.000 | 0.070 | 0.180 | 1.317 | |
Note: *, the mean difference is significant at 0.05 level; EG, Experimental group; CG, Control group; SE, Standard error.
Figure 4 shows the average score of jump smash accuracy over time. Under the core training intervention, the EG had a higher average score than the CG at all three different time points (baseline, posttest 1, and posttest 2).
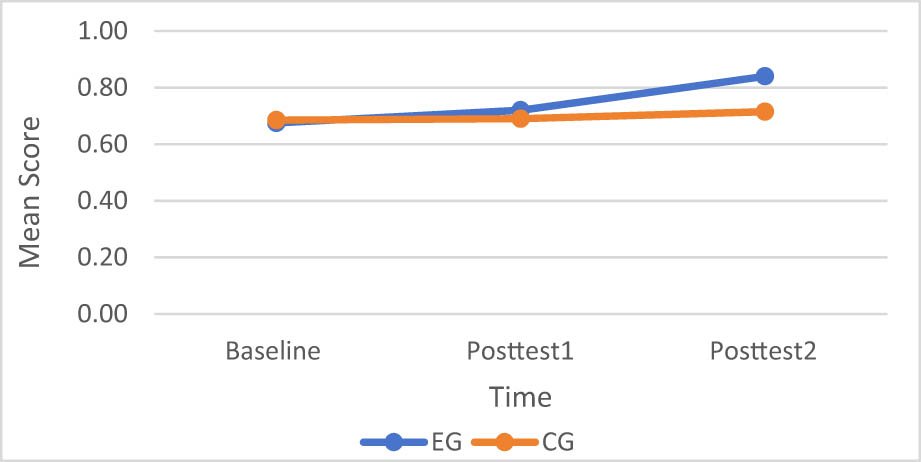
Figure 4
The mean score of jump smash accuracy across time for both groups.
3.3.3. Move smash accuracy
The third aspect of smash accuracy is move smash accuracy. The impact of core training intervention on move smash accuracy was observed through multi-stage fitness tests, and the descriptive data are shown in Table 14.
Table 14
Descriptive statistics of move smash accuracy between groups across the time
| Variable | Group | Baseline | Posttest1 | Posttest2 | |||
|---|---|---|---|---|---|---|---|
| Mean value | Std. deviation | Mean value | Std. deviation | Mean value | Std. deviation | ||
| Move smash accuracy | EG | 0.73 | 0.092 | 0.79 | 0.104 | 0.86 | 0.089 |
| CG | 0.72 | 0.132 | 0.73 | 0.121 | 0.76 | 0.082 | |
Note: EG, Experimental group; CG, Control group.
Table 15 reports the results of the move smash accuracy analysis based on GEE. First, the main effect of group was statistically significant (χ 2 = 4.298, p < 0.05), indicating a significant difference in overall performance between the EG and the CG. Second, the main effect of time was significant (χ 2 = 22.44, p < 0.001), indicating a significant change in move smash accuracy over time among the three measurements. Furthermore, the interaction between group and time was also significant (χ 2 = 5.895, p < 0.05), meaning that the two groups showed different trends over time, with the EG showing a significantly greater improvement than the CG.
Table 15
Results of GEE on move smash accuracy score
| Variable | Source | Wald chi-square | df | p-value |
|---|---|---|---|---|
| Move smash accuracy | Group | 4.298 | 1 | <0.05 |
| Time | 22.44 | 2 | <0.001 | |
| Group * Time | 5.895 | 2 | <0.05 | |
| Age♦ | 0.279 | 1 | 0.597 | |
| Training time♦ | 0.777 | 1 | 0.378 | |
| Height♦ | 0.434 | 1 | 0.51 | |
| Weight♦ | 0.011 | 1 | 0.915 |
Note: df, degrees of freedom; ♦, covariates.
Regarding covariates, age (χ 2 = 0.279, p = 0.597), training time (χ 2 = 0.777, p = 0.378), height (χ 2 = 0.434, p = 0.510), and weight (χ 2 = 0.011, p = 0.915) did not significantly affect the accuracy of move smash. This indicates that the aforementioned individual characteristic variables did not interfere with the trend of move smash performance, strengthening the explanatory power of core training intervention as the main influencing factor.
This study used the Bonferroni correction method to compare the differences in move smash accuracy between two groups of young female badminton players at baseline, Posttest 1, and Posttest 2 (Table 16). The results showed that in the EG, the mean differences between Posttest2 and baseline, and between Posttest1 and baseline, were statistically significant (mean differences were 0.125 and 0.055, respectively, p < 0.05), while the difference between Posttest2 and Posttest1 was not significant (mean difference = 0.07, p > 0.05). In the CG, the mean differences between the three time points were not statistically significant (p > 0.05). Effect size analysis further showed that the time effect of move smash accuracy in the EG (d = 1.436) was significantly greater than that in the CG (d = 0.364), indicating that core strength training has a stronger impact on improving move smash accuracy.
Table 16
Within groups comparison of move smash accuracy mean scores across the time for different groups
| Variable | Group | (I) time | (J) time | Mean difference (I–J) | SE | p-value | 95% CI for difference | Effect size (d) | |
|---|---|---|---|---|---|---|---|---|---|
| Lower | Upper | ||||||||
| Move smash accuracy | EG | Posttest2 | Posttest1 | 0.07 | 0.033 | 0.106 | −0.010 | 0.150 | 1.436 |
| Posttest2 | Baseline | 0.125* | 0.028 | <0.001 | 0.058 | 0.192 | |||
| Posttest1 | Baseline | 0.055* | 0.023 | 0.049 | 0.000 | 0.110 | |||
| CG | Posttest2 | Posttest1 | 0.035 | 0.023 | 0.368 | −0.019 | 0.089 | 0.364 | |
| Posttest2 | Baseline | 0.04 | 0.023 | 0.238 | −0.015 | 0.095 | |||
| Posttest1 | Baseline | 0.005 | 0.013 | 1.000 | −0.027 | 0.037 | |||
Note: *, the mean difference is significant at 0.05 level; EG, Experimental group; CG, Control group; SE, Standard error.
Bonferroni correction was used to compare the move smash accuracy of the two groups at baseline, posttest 1, and posttest 2 (Table 17). The results showed that the mean differences between the two groups at baseline and posttest 1 were not significant (baseline: mean difference = 0.01, p > 0.05; posttest 1: mean difference = 0.06, p > 0.05), but the difference reached statistical significance at posttest 2 (mean difference = 0.095, p < 0.05), indicating that the EG showed a more significant improvement after intervention. Effect size analysis further confirmed this trend; the effect size of move smash accuracy was largest at posttest 2 (d = 1.169), higher than posttest 1 (d = 0.532) and baseline (d = 0.088).
Table 17
Between groups comparison of mean score for move smash accuracy at three different times
| Variable | Time | Mean difference (EG–CG) | SE | p-value | 95% CI for difference | Effect size (d) | |
|---|---|---|---|---|---|---|---|
| Lower | Upper | ||||||
| Move smash accuracy | Baseline | 0.010 | 0.035 | 0.776 | −0.059 | 0.079 | 0.088 |
| Posttest1 | 0.060 | 0.035 | 0.084 | −0.008 | 0.128 | 0.532 | |
| Posttest2 | 0.095* | 0.026 | 0.000 | 0.043 | 0.147 | 1.169 | |
Note: *, the mean difference is significant at 0.05 level; EG, Experimental group; CG, Control group; SE, Standard error.
Figure 5 shows the average scores for move smash accuracy at different time points. Under the core training intervention, the EG had higher average scores than the CG at all three different time points (baseline, posttest 1, and posttest 2).
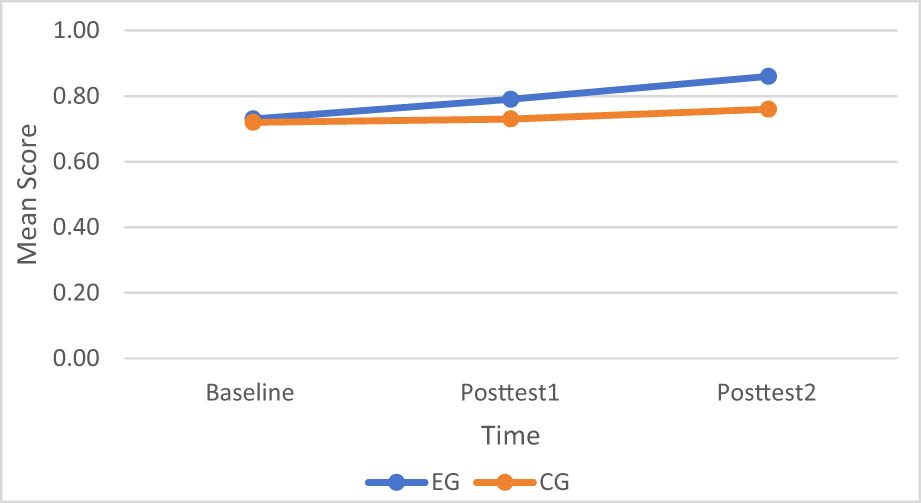
Figure 5
The mean score of move smash accuracy across time for both groups.
4. Discussion
This study provides compelling evidence that an 8-week core training program significantly improves female badminton players’ performance in stationary smashes, jump smashes, and moving smashes, highlighting the systemic and contextual benefits of core-focused interventions. This aligns with previous studies emphasizing the crucial role of core stability in power generation and trunk control [18–20]. The significant improvement in the accuracy of the standing smash indicates that strengthening core strength not only contributes to power output but also improves the coordination and timing between upper limb and trunk rotation [21]. This aligns with biomechanical models that positize the lumbar-pelvic region as the central hub of kinetic chain efficiency, enabling more precise and stable hitting motions.
The improved accuracy of jump smashes further reveals the profound value of core training. A jumping smash requires the rapid integration of lower limb propulsion, trunk rotation, and upper limb striking force. The increased effect size in the EG indicates improvements in postural stability, landing control, and energy transfer efficiency [22]. This result supports the view that the core region plays a role in multi-layered sensorimotor control during high-speed movements [22,23], the findings of this study expand upon previous research, demonstrating that core strength training not only enhances static stability but also promotes dynamic force regulation during high-speed aerial maneuvers, highlighting the multi-layered sensorimotor function of the core in competitive sports.
The significant improvement in move smashes highlights the “contextual transfer effect” of core training. Compared to in situ and jumping smashes, move smashes demand a higher level of kinetic chain integrity, requiring stability and control of the hitting motion amidst continuous movement, rapid footwork adjustments [24], and complex posture changes. The results of this study show that core training not only improves the quality of athletes’ shots under static and semi-dynamic conditions but also plays a role in highly dynamic actual match situations, demonstrating the decisive significance of the core area in kinetic chain integration, power transmission path stability, and multi-muscle group coordination [24,25]. The observed progress indicates that core training enhances intersegmental coordination and the stability of power transfer, providing a physiological basis for better performance in real matches. Interestingly, these results echo recent conceptual frameworks emphasizing “dynamic stability” and “coherent kinetic chains” in badminton, suggesting that core-focused training programs can directly improve specific technical execution [26].
In summary, this study not only confirmed the benefits of core training for women’s badminton in various situations, but also emphasizes the systematic contribution of core strength to kinetic chain efficiency, body control strategies, and the precision of movement execution. These results provide empirical support for designing specialized training programs for women’s badminton based on the kinetic chain, clearly indicating that systematic core training should be incorporated into routine training programs to improve hitting performance, and it also emphasized that core functions are crucial for optimizing technical execution and athletic efficiency. Importantly, this study reveals that core training can generate consistent advantages across different movement types, which has significant implications for constructing kinetic chain-based training models and provides direction for future exploration of the coupling mechanism between core functions and specific movements [25].
5. Limitations
While this study revealed the positive impact of core training on smash accuracy in female badminton players, several limitations remain. First, the sample size was limited to young female athletes in Guangxi (n = 40), potentially affecting the external generalizability and robustness of statistical tests. Second, the intervention period was 8 weeks, insufficient to assess the sustained effects of core training over long-term training cycles and its long-term impact on athletic performance. Furthermore, this study primarily assessed smash accuracy through on-site testing, which, while improving sport specificity, did not incorporate detailed analysis using laboratory instruments (such as high-frequency imaging or biomechanical measurements), potentially limiting a deeper understanding of the movement mechanisms and details of motor control. Finally, this study did not rigorously monitor athletes’ psychological state, fatigue levels, or training adherence, factors that could influence training effectiveness and test results. Future research could consider expanding the sample size, extending the intervention period, and combining laboratory measurements with psychological and cognitive indicators to further explore the mechanisms and long-term benefits of core training on badminton performance.
6. Conclusion
The results of this study indicate that 8 weeks of core training significantly improved the accuracy of smashes in female badminton players in Guangxi Province, both in in situ, jumping and moving. The EG showed higher time effect sizes in all smash accuracy tests compared to the CG, demonstrating that core training enhances core stability and strength, thereby optimizing body control, improving shot accuracy, and enhancing athletic performance. This suggests that systematically incorporating core training into regular training programs is an effective strategy for improving the technical level and competitive performance of female badminton players.
Acknowledgements
The authors are grateful to all the authors’ contribution during the completion of this study.
Funding information
The authors received no specific funding for this work.
Author contributions
Shuzhen Ma: Conceptualization; Shuzhen Ma and Kim Geok Soh: Data curation: Shuzhen Ma, Yicen Zhong: Investigation; Shuzhen Ma: Methodology; Shuzhen Ma, Xinzhi Wang, and Jing Li: Supervision; Shuzhen Ma: Writing – original draft; and Shuzhen Ma, Haili Feng, and Huajun Hu: Writing – review and editing.
Conflict of interest statement
The authors declare no conflict of interest.
Data availability statement
The datasets used and/or analyzed during the current study are available from the corresponding author on reasonable request.
Appendices
Appendix A
A1 Expert information
Table A1
Personal details of intervention training program experts
| Organization | Title and Degree | Area for research |
|---|---|---|
| Tianjin Institute of Physical Education | Professor | Sports training |
| Guangxi Normal University | Professor | Physical education |
| Jiangxi University of Science and Technology | Associate professor | Physical education |
| Shanghai Institute of Physical Education | Doctor of Philosophy | Sport psychology |
| Ningxia Institute of Technology | Professor | Physical education |
| Nankai University | Badminton coach | Physical education |
Appendix B Research protocol

Effect of core training on physical fitness and smash performance among female badminton players in Guangxi, China
Validation of expert
Dear expert,
My name is Ma Shuzhen from Universiti Putra Malaysia. My research title is “Effect of Core Training on Physical Fitness and Smash Performance among Female Badminton Players in Guangxi, China.” You have a wealth of theoretical knowledge and practical experiences. I want to invite you to give me some comments about my study. All the information you have filled in will only be used for this study and not for any other purpose. All the information you fill in will be kept confidential. Therefore, please rest assured and fill in the details.
Thank you for your assistance and cooperation.
Universiti Putra Malaysia
Supervisor Committee: Prof. Dr. Soh Kim Geok
Dr. Salimah Binti Japar
A1
Study overview
A1.1. Brief summary
The performance of Chinese women’s badminton singles players is declining to a large extent, the training of badminton in China needs to catch up, and the talent ladder has caused a fault [27,28]. Badminton Routine training, the effect is not apparent [27,28]. An essay on the impact of core training on athletes’ skill performance was written by [6]; it proves that core training plays a positive role in a variety of sports; there is no study of female badminton players. Coaches or sports researchers can use this knowledge to manage the training load of badminton players better, thereby helping badminton players achieve better results in badminton training and competition.
A1.2. Detailed description
Hibbs et al. constructed the model of core training and potential performance according to the theoretical framework of core training [25]. The intervention was designed based on two main sources: [29] CrossFit Training Guide, which informed the selection and organization of training exercises, and the theoretical framework of core training proposed by [25], which provided the theoretical basis for the intervention. The motion design was informed by two main sources: training resources published by the General Administration of Sport of China (Sport.gov.cn), including “Diversified Training to Enhance Core Strength” and the study by [30]. The duration and frequency of intervention came from the review. It is found in reviewing the effect of core training on badminton players’ performance is 8 weeks [31,32,33,34,35] and three times [36,37,38]. Therefore, this study adopted intervention for 8 weeks, three times a week. The subjects are 18–22-year-old female badminton players with over 5 years of training and school-level or higher competition experience. This study employs a cRCT design. The athletes were randomly assigned to two training sites and divided into EG and CGs. The two groups had the same professional skills training content. The only difference was the physical training part. The training program of the two groups lasted 8 weeks, three times per week, and 1 hours per training. The EG performed core training, while the CG maintained routine training. In addition, the specific content of the routine training of the CG was the standard training plan of the school. The dependent variables measured in this study are physical fitness (strength, speed, endurance, agility, and flexibility) and killing the ball under different states, including in situ smash, jump smash, move left smash, move right smash, and back smash.
A2
Protocol design
The details of this study design are shown in table form below, which are core training intervention (Table A2), overall intervention program (Table A3) and the instrument used to measure physical fitness and smash performance (Tables A5, A6). This study sincerely hopes that experts can leave suggestions for improvement (Tables A2, A3, A5) and scores (Tables A4, A7) (Figure A1).
Table A2
Core training intervention protocol
| Duration (week) | Time (min) | Frequency (times/week) | Types | Sets | Repetition (time) | Rest (s) | Intensity | Improvement suggestions |
|---|---|---|---|---|---|---|---|---|
| 1–3 | 25 | 3 | 1-Abdominal bracing | 40 s | 3 | 60–90 | Low-threshold training (50%–60%HRmax) | |
| 2-Plank | 40 s | 3 | 60–90 | |||||
| 3-Left-side bridge | 40 s | 3 | 60–90 | |||||
| 4-Right-side bridge | 40 s | 3 | 60–90 | |||||
| 4–5 | 25 | 3 | 1-Abdominal bracing | 40 s | 3 | 60–90 | Intermediate- threshold training (55%–65%HRmax) | |
| 2-Plank | 40 s | 3 | 60–90 | |||||
| 5-Russian twist | 20 reps | 3 | 60–90 | |||||
| 6-Lie on your back and alternate leg lifts | 20 reps | 3 | 60–90 | |||||
| 7-Lie on your back and roll your belly | 20 reps | 3 | 60–90 | |||||
| 6–8 | 25 | 3 | 8-Dead bug | 30 reps | 3 | 60–90 | High-threshold training (60%–70%HRmax) | |
| 5-Russian twist | 30 reps | 3 | 60–90 | |||||
| 6-Lie on your back and alternate leg lifts | 30 reps | 3 | 60–90 | |||||
| 7-Lie on your back and roll your belly | 30 reps | 3 | 60–90 | |||||
| 10-Lie on your stomach and rise at both ends | 30 reps | 3 | 60–90 |
Table A3
Overall intervention protocol
| Duration (week) | Frequency (times/week) | Process & Time | EG (Core training intervention) | CG (Routine training intervention-The standard training program of school) | ||||||||||||||
|---|---|---|---|---|---|---|---|---|---|---|---|---|---|---|---|---|---|---|
| Content of Physical training | Sets | Repetition (time) | Rest (s) | Intensity | Content of Physical training | Sets | Repetition (time) | Rest (s) | Intensity | |||||||||
| 1–3 | 3 | Warm up (10 min) | Move the wrist, shoulder, hip, knee, and ankle. (The standard training program of school) | |||||||||||||||
| Intervention (25 min) | Abdominal bracing | 40 sec | 3 | 60–90 | 50–60% HRmax | Jog | 40 sec | 3 | 60–90 | 50–60% HRmax | ||||||||
| Plank | 40 sec | 3 | 60–90 | Belly jump | 20 reps | 3 | 60–90 | |||||||||||
| Left side bridge | 40 sec | 3 | 60–90 | high knee lift | 40 sec | 3 | 60–90 | |||||||||||
| Right side bridge | 40 sec | 3 | 60–90 | Squat against the wall | 40 sec | 3 | 60–90 | |||||||||||
| Cool down (10 min) | Upper trapezius stretches, lunge with spinal twist, cobra pose, side split, sit and-reach (The standard training program of school) | |||||||||||||||||
| 4–5 | 3 | Warm up (10 min) | Move the wrist, shoulder, hip, knee, and ankle. (The standard training program of school) | |||||||||||||||
| Intervention (25 min) | Abdominal bracing | 40 sec | 3 | 60–90 | 55–65% HRmax | Jog | 40sec | 3 | 60–90 | 55–65% HRmax | ||||||||
| Plank | 40 sec | 3 | 60–90 | Belly jump | 20 reps | 3 | 60–90 | |||||||||||
| Russian twist | 20 reps | 3 | 60–90 | high knee lift | 20 sec | 3 | 60–90 | |||||||||||
| Lie on your back and alternate leg lifts | 20 reps | 3 | 60–90 | Squat against the wall | 40 sec | 3 | 60–90 | |||||||||||
| Lie on your back and roll your belly | 20 reps | 3 | 60–90 | Double run | 20 sec | 3 | 60–90 | |||||||||||
| Cool down (10 min) | Upper trapezius stretches, lunge with spinal twist, cobra pose, side split, sit and-reach (The standard training program of school) | |||||||||||||||||
| 6–8 | 3 | Warm up (10 min) | Move the wrist, shoulder, hip, knee, and ankle. (The standard training program of school) | |||||||||||||||
| Intervention (25 min) | Dead bug | 30 reps | 3 | 60–90 | 60–70% HRmax | Jog | 40 sec | 3 | 60–90 | 60–70% HRmax | ||||||||
| Russian twist | 30 reps | 3 | 60–90 | Belly jump | 20 reps | 3 | 60–90 | |||||||||||
| Abdominal rollout | 30 reps | 3 | 60–90 | high knee lift | 30 sec | 3 | 60–90 | |||||||||||
| Plate alternation | 30 reps | 3 | 60–90 | Squat against the wall | 30 sec | 3 | 60–90 | |||||||||||
| Lie on your stomach and rise at both ends | 30 reps | 3 | 60–90 | Double run | 20 sec | 3 | 60–90 | |||||||||||
| Cool down (10 min) | Upper trapezius stretches, lunge with spinal twist, cobra pose, side split, sit and-reach (The standard training program of school) | |||||||||||||||||
| Improvement suggestions | ||||||||||||||||||
Table A4
Expert evaluation form for intervention measurement
| Type | Relevance | Clarity | Improvement suggestions | ||||||
| 4 | 3 | 2 | 1 | 4 | 3 | 2 | 1 | ||
| Exercises selection | |||||||||
| Duration | |||||||||
| Frequency | |||||||||
| Sets/Repetitions | |||||||||
| Process and time | |||||||||
| Rest/Recovery | |||||||||
| Intensity | |||||||||
| Content of warm-up | |||||||||
| Content of cool down | |||||||||
Table A5
Instrument used to measure physical fitness
| Variables | Measurement method | Instrument | Unit | Reference | Improvement suggestions |
|---|---|---|---|---|---|
| Strength | Sit-ups | Stopwatch | Numbers | [39] | |
| Power | Standing long jump | Meter rule | cm | [40] | |
| Speed | Run 20 times with a low center of gravity | Stopwatch | s | [41] | |
| Agility | The Illinois agility test (IAT) | Stopwatch | s | – | |
| Endurance | Jumping rope | Stopwatch | Numbers | [42] | |
| Balance | Y Balance Test (YBT) | YBT kit | cm | [43] | |
| Stability | One-legged standing with eyes closed test | Stopwatch | s | [44] | |
| Flexibility | Sit-and-reach | Sit-and-reach box | cm | [45] |
Table A6
Instrument used to measure smash performance
| Variables | Measurement method | Instrument | Unit | Reference | Improvement suggestions | |
|---|---|---|---|---|---|---|
| In situ smash accuracy | Ball placement test | Colored string. Leopard smart shuttlecock throwing machine. | Count | [11] | ||
| Jump smash accuracy | Ball placement test | |||||
| Move smash accuracy | Ball placement test | |||||
| In situ smash velocity | Ball speed test | Smart badminton sensor. Leopard smart shuttlecock throwing machine. | km/h | |||
| Jump smash velocity | Ball speed test | |||||
| Move smash velocity | Ball speed test | |||||
Source: Ref. [11].
Table A7
Expert evaluation form for outcome measurement
| Type | Relevance | Clarity | Improvement suggestions | ||||||
|---|---|---|---|---|---|---|---|---|---|
| 4 | 3 | 2 | 1 | 4 | 3 | 2 | 1 | ||
| Strength test | |||||||||
| Power test | |||||||||
| Endurance test | |||||||||
| Speed test | |||||||||
| Agility test | |||||||||
| Balance test | |||||||||
| Stability test | |||||||||
| Flexibility test | |||||||||
| Smash accuracy test | |||||||||
| Smash velocity test |
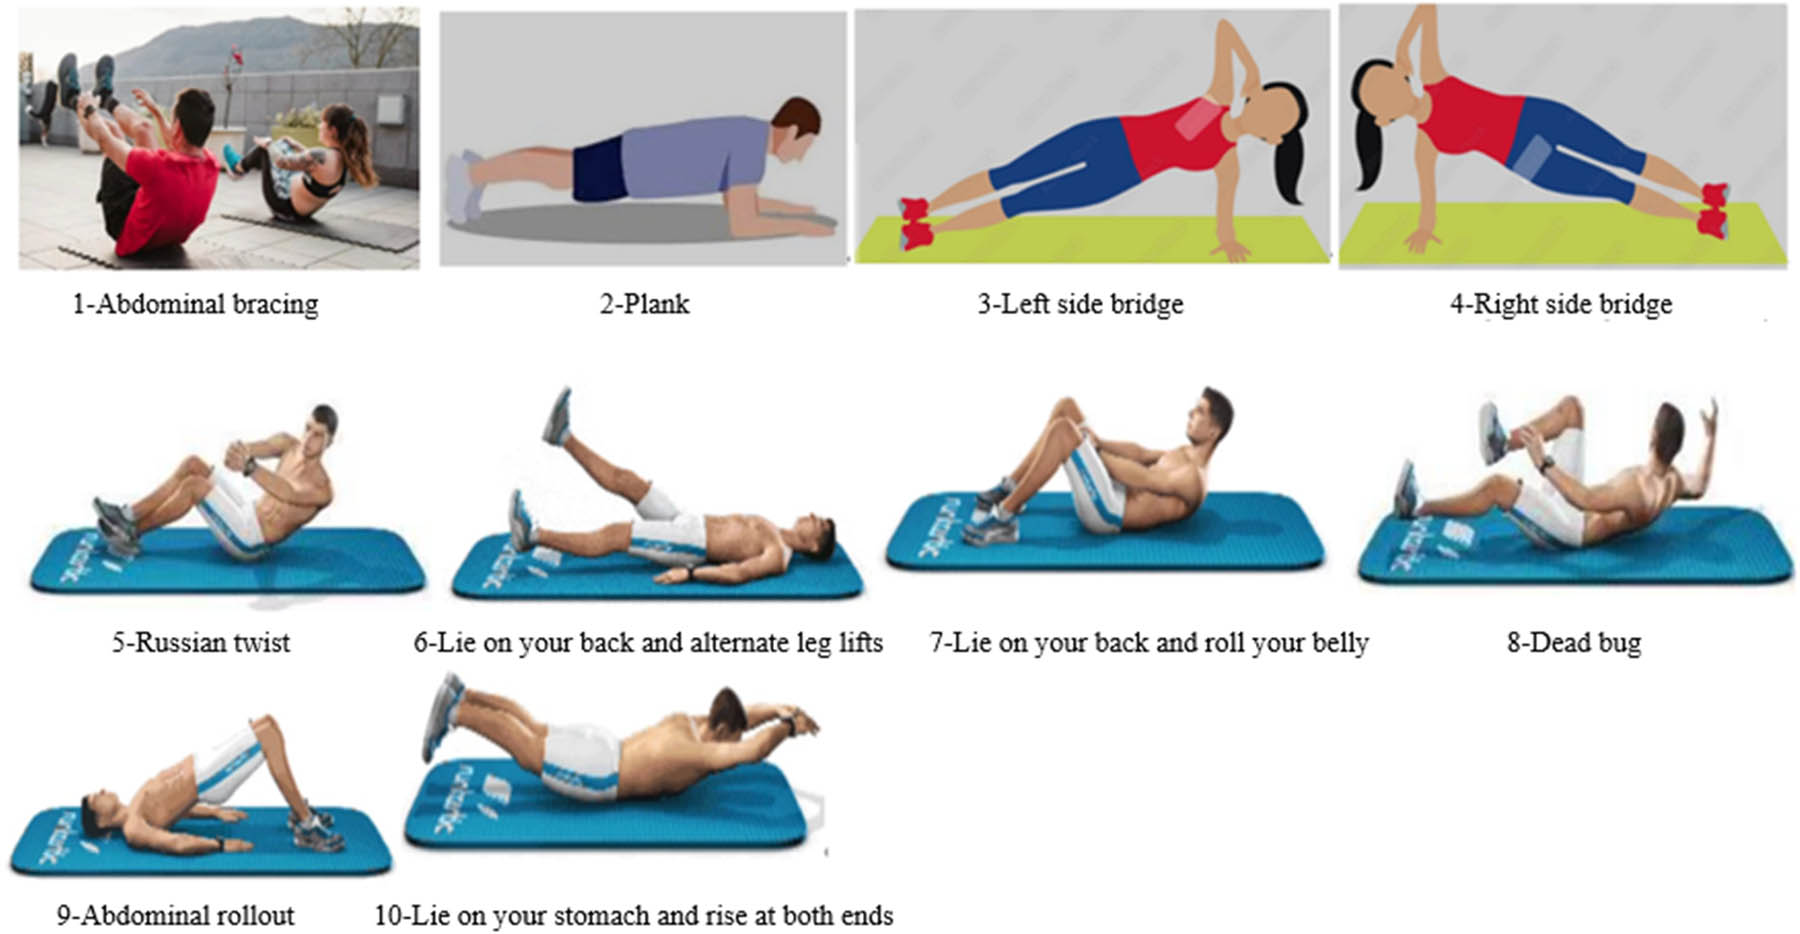
Figure A1
Core training moves. (1) Abdominal bracing, (2) plank, (3) left-side bridge, (4) right-side bridge, (5) Russian twist, (6) lie on your back and alternate leg lifts, (7) lie on your back and roll your belly, (8) dead bug, (9) abdominal rollout, and (10) lie on your stomach and rise at both ends.
Source: Ref. [25].
A2.1. Questionnaire information
The questionnaire utilizes a 4-point ordinal scale to assess the intervention, with values ranging from 1 to 4 to indicate levels of support (1 = not relevant, 2 = somewhat relevant, 3 = quite relevant, 4 = highly relevant). Kindly rate the functional training intervention accordingly. If additional content is present, please include it and specify its title. After reviewing the questionnaire, rate the following aspects and mark the appropriate rating with a check (“√”).
A2.2. Questionnaire information
The questionnaire utilizes a 4-point ordinal scale to assess the intervention, with values ranging from 1 to 4 to indicate levels of support (1 = not relevant, 2 = somewhat relevant, 3 = quite relevant, 4 = highly relevant). Kindly rate the functional training intervention accordingly. If additional content is present, please include it and specify its title. After reviewing the questionnaire, rate the following aspects and mark the appropriate rating with a check (“√”).
A3
Outcome measures detail
A3.1. Strength
Sit-ups: Record the number of sit-ups in 1 min.
On listening the command, the subjects had to lift their upper body and touch their knees with elbows and perform the same as many times as possible for next 1 min [39] (Figure A2).
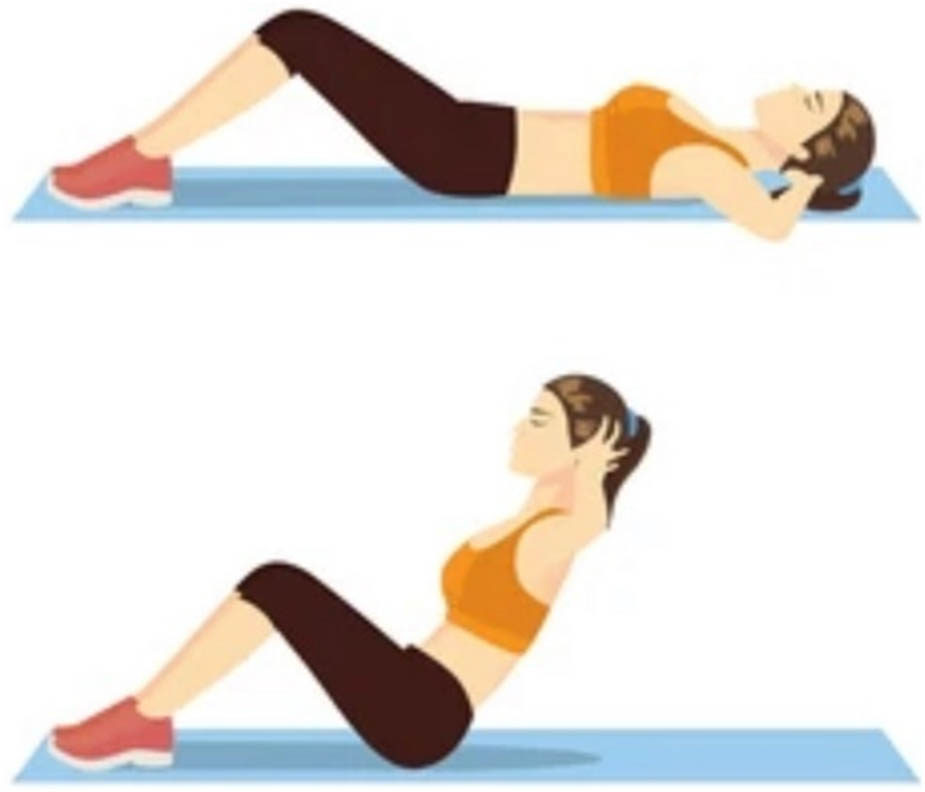
Figure A2
Sit-ups.
Source: Ref. [39].
A3.2. Power
Standing long jump: Measure the distance of the standing long jump with a measuring tape.
The participant was instructed to place the toes of both feet behind a designated starting line and to “jump as far forward as possible, ensuring a two-footed landing.” Distance was recorded (cm) by measuring from the starting line to the most posterior surface of the foot at landing [40] (Figure A3).
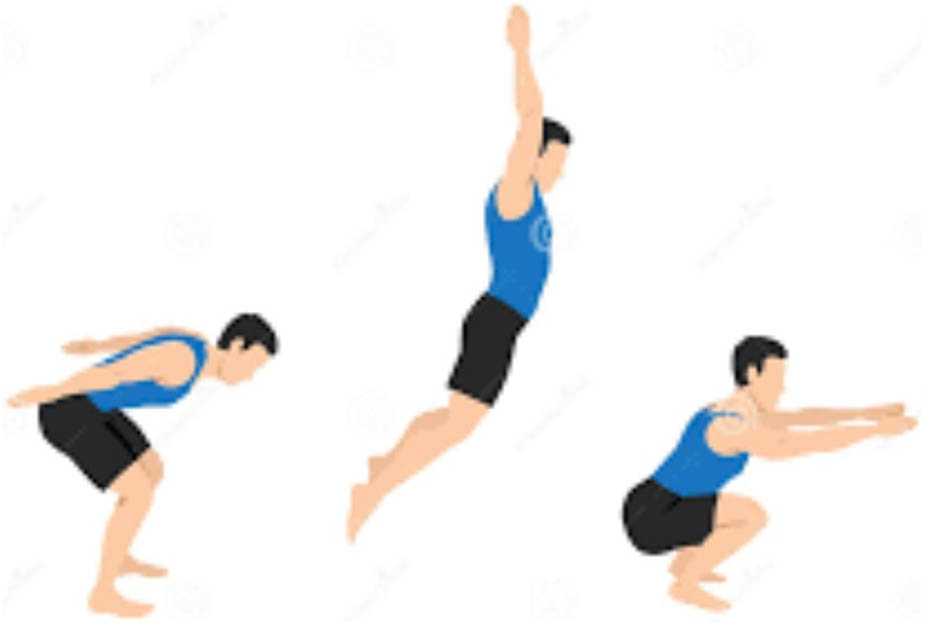
Figure A3
Standing long jump.
Source: Ref. [40].
A3.3. Endurance
Jumping rope: Recorded the number of jumping ropes in 1 min.
Participants rotate the rope with their arms, while their legs bounce repeatedly, maintaining vertical takeoff and landing until the exercise is over [46] (Figure A4).
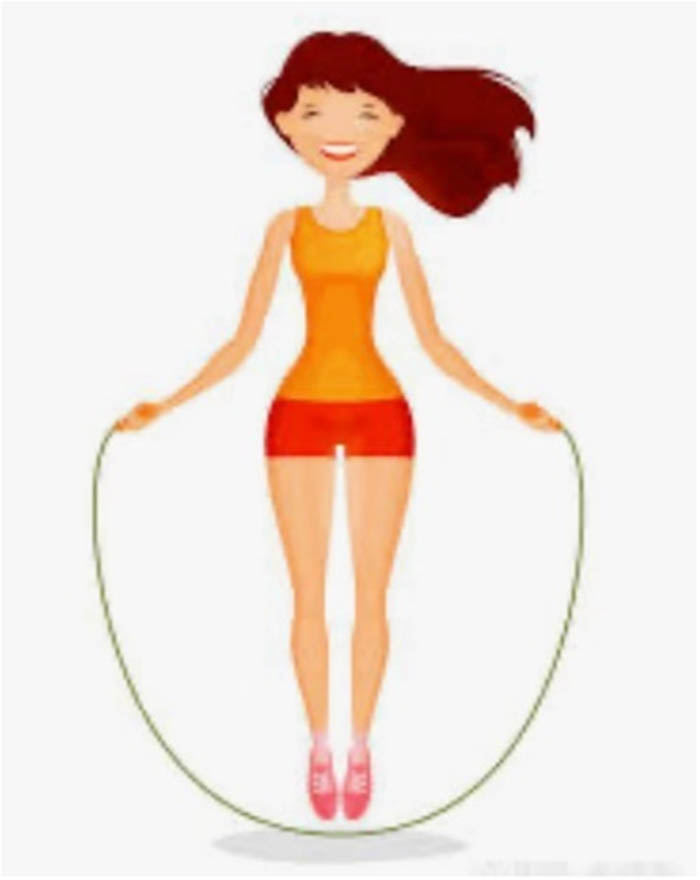
Figure A4
Jumping rope.
Source: Ref. [46].
A3.4. Speed
Run 20 times with a low center of gravity: Use a stopwatch to record the total time required to complete the task.
Mark the halfway point of the vertical distance to the badminton court’s baseline from the intersection of the front serve line and half-court line. The test subject faces the net motionless, with at least one foot planted on the marker. After the test starts, time should be timed immediately. The tester with the right-hand racket should move and touch the badminton in the order of 0 → 1 → 2 → 3 → 4; the tester with the left-hand racket should move and touch the badminton in the order of 0 → 3 → 4 → 1 → 2, and then repeat according to the route, touching the ball for a total of 20 times. The timing will stop when the tester touches the ball for the 20th time [41] (Figure A5).
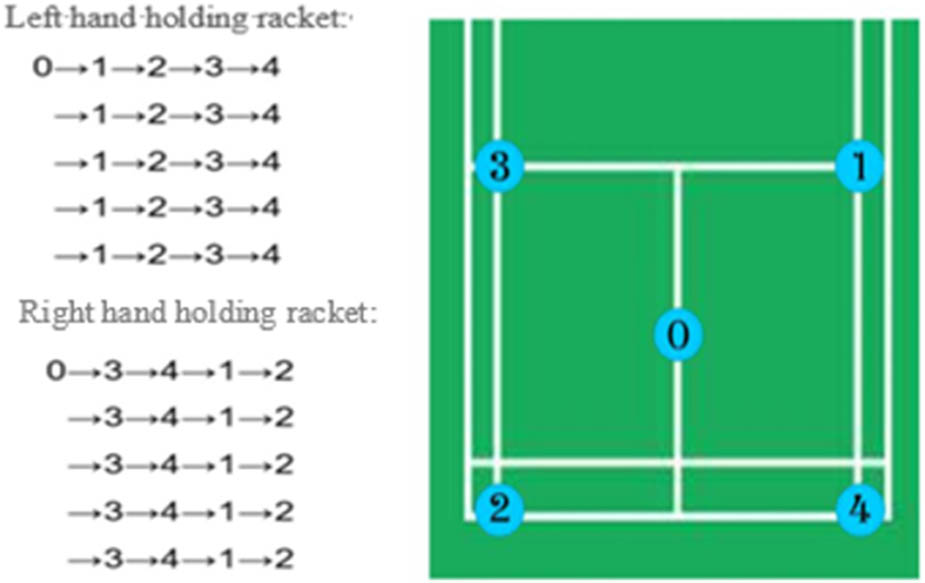
Figure A5
Run 20 times with a low center of gravity.
Source: Ref. [41].
A3.5. Agility
IAT: Use a stopwatch to record the total time required to complete the task.
The IAT assessed agility performance. When set up on a badminton court, the course measured 10 m in length and 5 m in width. Four cones indicated the start, finish line, and turning points. Four more cones were positioned at equal intervals down the center. The distance between the central cones was 3.3 m. The subjects were told to run around the course in the designated direction (Figure A6).
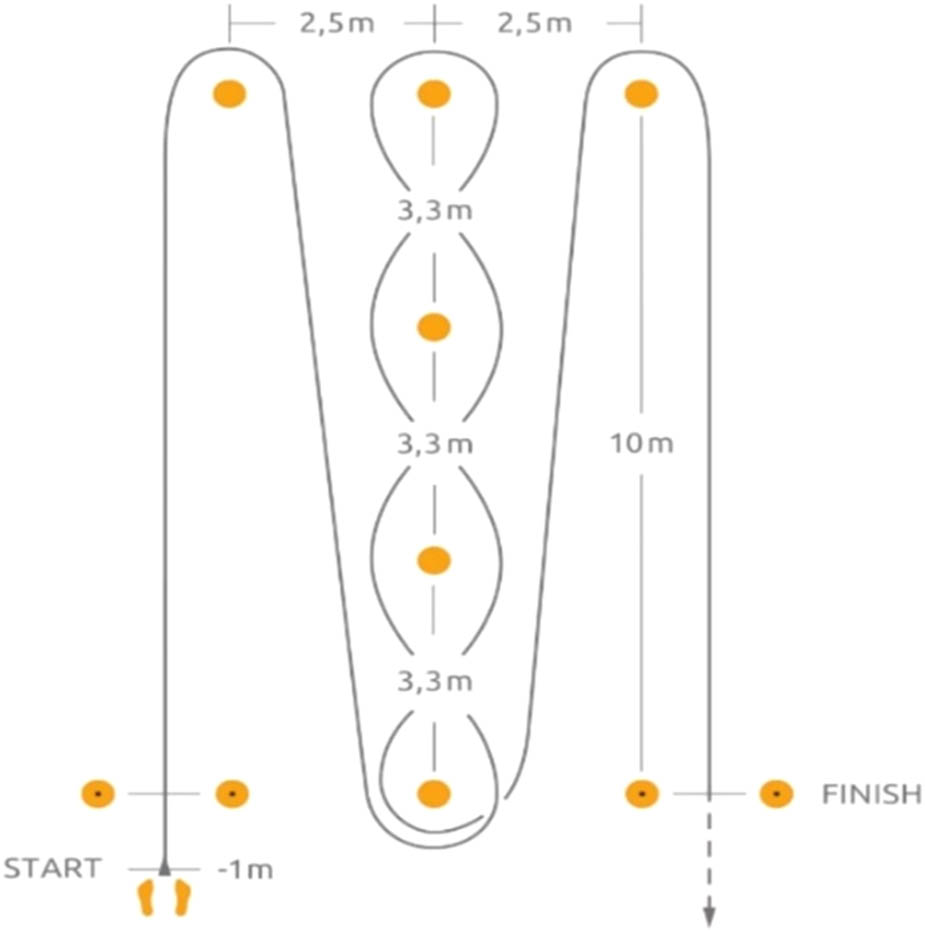
Figure A6
Illinois agility test.
Source: Ref. [47].
A3.6. Balance
YBT: Use a meter stick to record the test distance.
Participants stood on the dominant leg on a center of Y-Junction shape surface [43]. Prior to testing, it was established which leg of the individuals was dominant: if the right leg was dominant, the test would be counter-clockwise; if the left leg was dominant, the test would be clockwise [48,49]. They next performed the reaching via signs action in a direction that was chosen at random by the examiner, provided they made no mistakes, and they returned to standing on double leg position [43] (Figure A7).
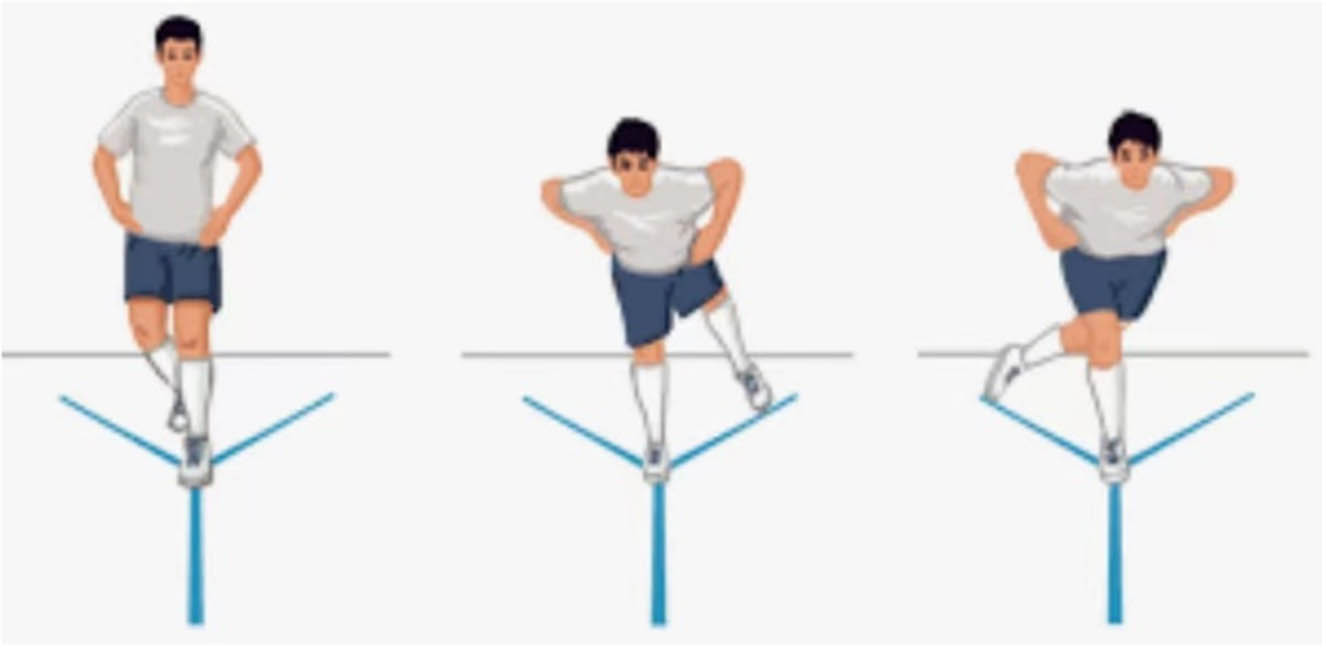
Figure A7
Y Balance Test.
Source: Ref. [43].
A3.7. Stability
One-legged standing with eyes closed test: Time of how long the tester can hold on is recorded with a stopwatch.
The subject stood naturally. After hearing the “start” command (while the tester opened the watch to time), the subject closed his eyes and stood on one foot with the dominant leg. The non-dominant leg was lifted off the ground and could not lean on the supporting leg, and the arms were naturally lowered to the sides of the body [44] (Figure A8).
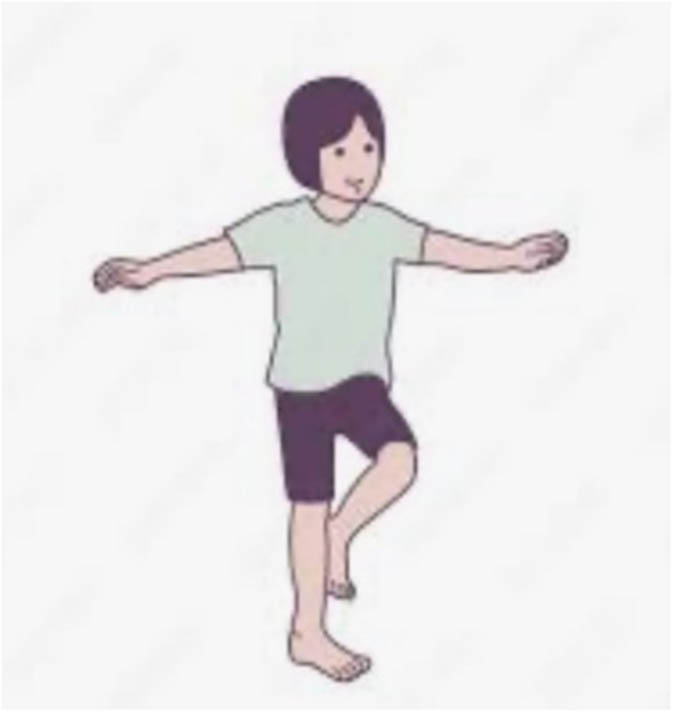
Figure A8
One-legged standing with eyes closed test.
Source: Ref. [44].
A3.8. Flexibility
Sit-and-reach: Use the sit-and-reach box. The score is recorded as the point where the subject’s fingertips reach the measurement scale.
Individual body flexibility level is measured and calculated by performing a sit and reach test, where the result is defined as a personal flexibility score [50]. In the sitting position of the test, participants have their legs straight, their feet pressed against the sit and read the box, and their arms extended forward as much as possible to push the sliding ruler on the box’s surface [45] (Figure A9).
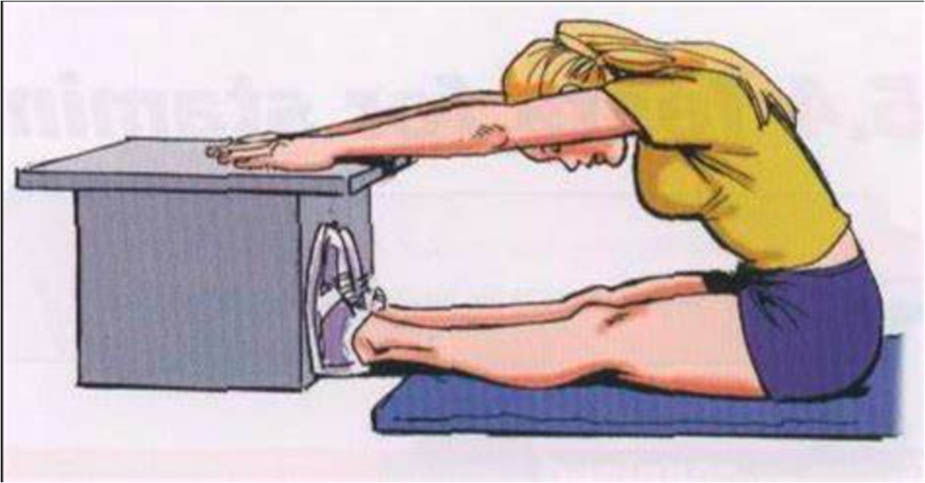
Figure A9
Sit-and-reach test.
Source: Ref. [45].
A3.9. Smash test
Accuracy: Record the number of successful smashes.
Velocity: Record the speed number of successful smashes.
Shuttle velocity and height of hit A colorful string was placed so that it was visible for the athlete at the height of 30 cm over the net, which was placed at the standard height of 155 cm [11]. The athlete’s task was to perform such a shot that the shuttlecock flew between the net and the colored string, giving the shuttlecock the highest possible velocity. Badminton subjects use their rackets (according to the player’s personal preferences) to spike the ball, test 10 balls, record the number of successful 10 balls, and use a SMART BDMINTON SENSOR to record the speed of each ball. The test process follows: In situ smash, jump smash, move left smash, move right smash, and back smash (Figure A10).
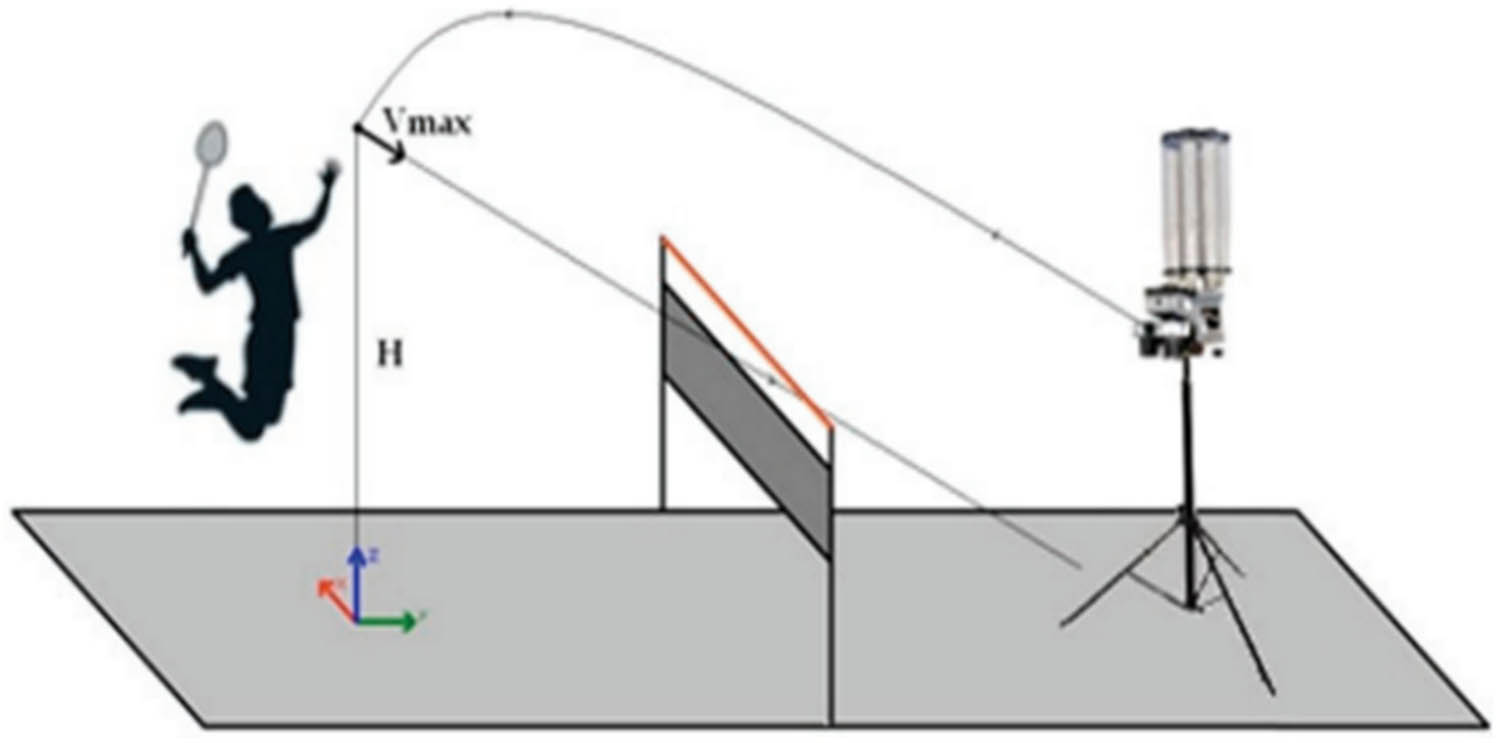
Figure A10
Smash test.
Source: Ref. [11].